

Abstract
Background
Multiple sclerosis (MS) is an autoimmune, neuroinflammatory disease, with an unclear etiology. However, T cells play a central role in the pathogenesis by crossing the blood–brain-barrier, leading to inflammation of the central nervous system and demyelination of the protective sheath surrounding the nerve fibers. MS has a complex inheritance pattern, and several studies indicate that gene interactions with environmental factors contribute to disease onset.
Methods
In the current study, we evaluated T cell dysregulation at the protein level using electrospray liquid chromatography–tandem mass spectrometry to get novel insights into immune-cell processes in MS. We have analyzed the proteomic profiles of CD4+ and CD8+ T cells purified from whole blood from 13 newly diagnosed, treatment-naive female patients with relapsing–remitting MS and 14 age- and sex-matched healthy controls.
Results
An overall higher protein abundance was observed in both CD4+ and CD8+ T cells from MS patients when compared to healthy controls. The differentially expressed proteins were enriched for T-cell specific activation pathways, especially CTLA4 and CD28 signaling in CD4+ T cells. When selectively analyzing proteins expressed from the genes most proximal to > 200 non-HLA MS susceptibility polymorphisms, we observed differential expression of eight proteins in T cells between MS patients and healthy controls, and there was a correlation between the genotype at three MS genetic risk loci and protein expressed from proximal genes.
Conclusion
Our study provides evidence for proteomic differences in T cells from relapsing–remitting MS patients compared to healthy controls and also identifies dysregulation of proteins encoded from MS susceptibility genes.
Electronic supplementary material
The online version of this article (10.1186/s12014-019-9241-5) contains supplementary material, which is available to authorized users.
Keywords: Multiple sclerosis, T cells, Mass spectrometry, SNPs, Autoimmunity, Proteomics
Background
Multiple sclerosis (MS) typically affects young adults and is the most common non-traumatic cause of neurological impairment. It affects around 2.5 million individuals worldwide leading to both physical and cognitive deficits [1]. MS is a chronic inflammatory, demyelinating disorder of the central nervous system (CNS) where lymphocyte-mediated inflammation causes demyelination and axonal degeneration. The underlying pathogenesis remains partly unclear, but T lymphocytes, both CD4+ and CD8+ T cells, have long been considered to play pivotal roles in MS pathogenesis [2, 3]. Also, the genetic architecture of MS susceptibility, emerging from genome-wide association studies, indicates an important role for the adaptive immune system, in particular T cells for MS-disease onset [4, 5].
Studies of MS etiology in monozygotic twins and recurrence risk in siblings indicate that MS has a complex inheritance pattern [6]. Furthermore, parent-of-origin effects affect inheritance of MS in rodents, and several studies indicate that gene-environment interactions contribute to MS development. Altogether, this suggests that also epigenetic mechanisms play a role in MS etiology [7]. Both genome-wide studies on epigenetic modifications, such as DNA methylation, as well as transcriptomic analyses in immune cells have been conducted in order to investigate the potential dysregulation of immune cells in MS. Epigenetic profiling in peripheral blood mononuclear cells and in immune cell subtypes, i.e. CD4+ and CD8+ T cells, suggests global differences in DNA methylation between MS patients and healthy controls [8–12]. Of note, a few single genes displayed significant differential DNA methylation levels between MS patients and healthy controls, but no overlap, except for in the HLA-DRB1 locus [12, 13], was observed between the different studies [7]. Microarray analyses of blood from MS patients and healthy controls indicate dysregulation of T cell pathways during MS pathogenesis [14, 15]. Recent candidate-gene approaches have profiled transcriptional changes in T cells from MS cases and healthy controls, and identified dysregulation of several genes, e.g. MIR-21 and corresponding target genes [16] and THEMIS [17]. However, the correlation between mRNA and protein copy numbers varies widely [18, 19]. Therefore, performing quantitative high-resolution mass spectrometry-based proteomics gives a unique opportunity for system-wide studies at the protein level.
Since the 1970′ies, HLA-DRB1*15:01 has been established as the major genetic risk factor in MS [6]. Recent genome-wide screenings have however identified more than 200 non-HLA single nucleotide polymorphisms (SNPs) associated with MS risk [4, 5, 20]. The majority of the non-HLA MS associated SNPs are non-coding, and an enrichment of these variants is observed in regulatory regions of DNA (DNase hypersensitive sites) in immune cells from the adaptive arm of the immune system, i.e. B and T cells [21]. In addition, given the widespread presence of expression quantitative trait loci (eQTLs) in the genome [22], it is likely that a number of MS-associated SNPs or SNPs inherited together with the MS-associated SNPs might act as eQTLs in immune cells. Indeed, a recent study identified 35 significant eQTLs from 110 non-HLA MS-associated SNPs in peripheral blood mononuclear cells from MS patients [23]. However, whether these expression differences at the transcriptomic levels also persists to the protein level is currently unknown.
The overall objective for this project is to evaluate immune dysregulation at the protein level in MS using liquid chromatography combined with mass spectrometry. We analyzed the proteomic profile of purified immune-cell subsets, i.e. CD4+ and CD8+ T cells, from genotyped relapsing–remitting MS (RRMS) patients and healthy controls, which allows us to disentangle potential cell-subtype specific differences that could not be detected in a heterogeneous cell material, permitting a comprehensive understanding of disease mechanisms of MS. Correlating protein expression with genotypes of MS-associated SNPs allowed for identification of protein expression quantitative trait loci (pQTLs).
Methods
MS patients and healthy controls
Samples from 13 untreated, female Norwegian MS patients with RRMS and 14 age-matched, female Norwegian healthy controls were included (see Table 1 for demographic, clinical and biochemical information). For two of the patients, the EDSS score was assessed by inspection of their medical journals. All patients and healthy controls were self-declared of Nordic ancestry. Patients were recruited from the MS out-patient clinic at the Oslo University Hospital, Oslo, Norway and the healthy controls among hospital employees. All MS patients fulfilled the updated McDonald criteria for MS [24], did not have an ongoing infection and had not experienced a relapse or received steroids in the 3 months prior to enrollment. The diagnosis was set less than 1 year prior to inclusion in the study. The healthy controls did report to have no MS in near family.
Table 1.
Characteristics of individual MS patients and summaries of patients and healthy controls
| Patient | Age categorya | Years since first MS symtoms | EDSS | MSSS | OCB | MRI lesion categoriesb | Contrast lesions MRI | Symptoms at onset | Family history of MS |
|---|---|---|---|---|---|---|---|---|---|
| MS1 | 3 | 6 | 2.5 | 7.1 | Yes | 3 | Yes | Visual | No |
| MS2 | 1 | 4 | 1 | 2.44 | Yes | 2 | Yes | Brainstem | Yes |
| MS3 | 6 | 7 | 3 | 7.93 | Yes | 1 | No | Visual | Yes |
| MS4 | 1 | 0.75 | 1.5 | 4.3 | Yes | 1 | Yes | Sensory | No |
| MS5 | 1 | 15 | 3.5 | 8.64 | Yes | 1 | No | Sensory | No |
| MS6 | 4 | 0.75 | 2 | 5.87 | Yes | 3 | Yes | Brainstem | No |
| MS7 | 2 | 0.5 | 1 | 2.44 | Yes | 3 | No | Sensory | No |
| MS8 | 4 | 2 | 1 | 2.44 | Yes | 3 | Yes | Visual | Yes |
| MS9 | 5 | 3 | 2.5 | 7.08 | No | 3 | Yes | Sensory, bladder/bowel | No |
| MS10 | 1 | 0.75 | 3 | 7.93 | Yes | 1 | Yes | Pyramidal | Yes |
| MS11 | 6 | 19 | 1.5 | 4.3 | Yes | 1 | No | Sensory | No |
| MS12 | 5 | 14 | 2.5 | 7.08 | Yes | 2 | No | Visual | No |
| MS13 | 1 | 1 | 1.5 | 4.3 | Yes | 2 | Yes | Sensory | No |
| Summarized | |||||||||
| Patients mean or median* (range) | 37.2 (25–52) | 5.7 (0.75–19) | 2 (1–3.5)* | 5.5 (2.4–8.6) | N/A | 2* | N/A | N/A | N/A |
| Healthy controls mean (range) | 32.6 (23–47) | N/A | N/A | N/A | N/A | N/A | N/A | N/A | N/A |
The table includes data for each individual MS patient at inclusion, from the left: patient identity number; aage category; number of years since first MS symptoms; EDSS; MSSS; presence of OCB in the cerebrospinal fluid; bMRI lesion categories; presence of contrast enhancing lesions (MRI); symptoms at onset and family history of MS. Below follows summary statistics with mean (range) for age category, years since first symptoms and MSSS and median (range) labelled with * for EDSS and MRI lesion categories
EDSS expanded disability status scale, MSSS MS severity score, OCB oligoclonal bands, MRI magnetic resonance imaging, N/A not applicable
aAge category: 1 = 25–29 years; 2 = 30–34 years; 3 = 35–39 years; 4 = 40–44 years; 5 = 45–49 years; 6 = 50–54 years
bMRI lesion categories:: 1 = 0–10 lesions; 2 = 10–20 lesions; 3 = more than 20 lesions
DNA isolation and genotyping
DNA was purified from blood (DNeasy Blood & Tissues Kit, Qiagen, Redwood City, CA, USA). Samples were genotyped with the Human Omni Express BeadChip (Illumina, San Diego, CA, USA).
Isolation of human CD4+ and CD8+ T cells, sample preparation and protein digestion
Peripheral blood mononuclear cells were isolated from whole blood by Lymphoprep (Axis Shield, Dundee, Scotland), before positive selection of CD8+ T cells (EasySep™ Human CD8+ Selection Kit, STEMCELL Technologies, Vancouver, Canada) followed by negative selection of CD4+ T cells (EasySep™ Human CD4+ T cell Isolation kit, STEMCELL Technologies). Cells that achieved cell purity of more than 95% as measured by flow cytometry (Attune Acoustic Focusing Flow Cytometer, Life Technologies, Carlsbad, CA, USA) were included in the study. Two CD8+ T cell samples from MS patients did not reach 95% cell purity and were excluded from the analyses. Antibodies used for flow cytometry analyses were fluorescein isothiocyanate-conjugated mouse anti-human CD4 (clone RTF-4 g, Southern Biotech, Birmingham, AL, USA), mouse anti-human CD8 (clone HIT8a, BD biosciences, San Jose, CA, USA) and mouse IgG1 isotype control (15H6, Southern Biotech).
Sample preparation and protein digestion
The pellet of 1 × 10⁶ cells from each sample was kept until use at − 80 °C. The pellets were then solubilized in 100 μl 0.1 M Tris–HCl pH 7.6 containing 4% SDS and homogenized at room temperature by sonication 3–4 times at 30% amplitude for 30 s with an ultrasonic processor with thumb-petuated pulser (Vibra-cell VC130 PB from Sonics and Materials Inc., Newton, CT, USA). After centrifugation for 10 min at 16,200 × g, supernatants were collected. Protein concentration in samples was measured by Pierce BCA protein assay (Thermo Fisher Scientific, Rockford, IL, USA) and the absorbance values at 562 nm were read on Multiskan FC 3.1 ELISA reader (Thermo Fisher Scientific). To 40 μl supernatant corresponding to about 10 μg protein, 4 μl 1 M DTT was added for reduction and incubated at 95 °C for 5 min. After cooling, SDS removal by dilution with urea and cysteine alkylation, digestion of proteins were accomplished using the filter aided sample preparation (FASP) protocol [25]. On the MicroconR-30 centrifugal filters (Merck Millipore Ltd, Ireland), proteins were digested with a protein-to-trypsin ratio of 50:1 (sequencing grade-modified trypsin from Promega, GmbH, Mannheim, Germany) [26]. After incubation overnight at 37 °C, tryptic peptides were collected by washing the filter three times with 50 mM ammonium bicarbonate pH 8.5, and with 0.5 M NaCl, each step followed by centrifugation at 11,000 × g [25]. Sample cleanup was performed using a reverse-phase OasisR HLB μElution Plate 30 μm (2-mg HLB sorbent, Waters, Milford, MA) [27]. After lyophilization, the dried peptides were suspended in 12 μl of 0.1% formic acid containing 2% acetonitrile. 2 μl were used for protein quantification based on absorbance at 280 nm using a NanoDrop spectrophotometer (Thermo Fisher Scientific). The sample volume was adjusted to 1 μg/μl and approximately 1 μg of the mixture was analyzed with mass spectrometry.
Liquid chromatography–mass spectrometry/mass spectrometry analysis
The peptides were analyzed by electrospray liquid chromatography–tandem mass spectrometry (LC–MS/MS) using a linear ion trap–orbitrap instrument (Orbitrap Elite, Thermo Fisher Scientific). The LC run length of 3 h was performed on a 50 cm analytical column (Acclaim PepMap 100, 50 cm × 75 µm ID nanoViper column, packed with 3 µm C18 beads (Thermo Fisher Scientific)). Peptides were loaded and desalted on a pre-column (Acclaim PepMap 100, 2 cm × 75 µm ID nanoViper column, packed with 3 µm C18 beads (Thermo Fisher Scientific)) with 0.1% (v/v) trifluoroacetic acid, and eluted with a gradient composition as follows: 5% B during trapping (5 min) followed by 5–7% B over 1 min, 7–32% B for the next 129 min, 32–40% B over 10 min, and 40–90% B over 5 min. Elution of very hydrophobic peptides and conditioning of the column were performed during 20 min isocratic elution with 90% B and 20 min isocratic elution with 5% B respectively. Mobile phases A and B with 0.1% formic acid (vol/vol) in water and 100% acetonitrile respectively, and the flow rate was of 270 nl per min. A full scan in the mass area of 300–2000 Da was performed in the Orbitrap. For each full scan performed at a resolution of 240,000, the 12 most intense ions were selected for collision induced dissociation (CID). The settings of the CID were as following: threshold for ion selection was 3000 counts, the target of ions used for CID was 1e4, activation time was 10 ms, isolation window was 2 Da, and normalized collision energy was 35 eV.
Mass spectrometry data analysis
MS raw files were analyzed by the MaxQuant software [28] (version 1.5.6.0), and peak lists were searched against the human SwissProt FASTA database (version May 2017), and a common contaminants database by the Andromeda search engine. As variable modification, methionine oxidation was used and as fixed modification cysteine carbamidomethylation was used. False discovery rate was set to 0.01 for proteins and peptides (minimum length of six amino acids) and was determined by searching a reverse database. Trypsin was set as digestion protease, and a maximum of two missed cleavages were allowed in the database search. Peptide identification was performed with an allowed MS mass deviation tolerance of 20 ppm, and MS/MS fragment ions could deviate by up to 0.5 Da. For accurate intensity-based label-free quantification in MaxQuant [MaxLFQ [29]], the type of label was “1″ for LFQ with a minimum ratio count of “2″. For matching between runs, the retention time alignment window was set to 20 min and the match time window was 0.7 min.
Statistical analyses
The statistical significance between comparisons was evaluated using a two-tailed Student t test, p < 0.05 was considered significant. The equality of variances of patient and control distributions was assessed with an F-test. Consequently, a Student t test with unequal variances was used when the F-test was significant (p < 0.05) and with equal variances otherwise. Area under the ROC curve (AUC) analyses of all significantly expressed proteins (p < 0.05) was calculated using GraphPad Prism 6 (La Jolla, CA, USA). Individual scatter plots of selected proteins (Figs. 4, 5) was created using GraphPad Prism 6. For the genotype-wise comparisons, a Students unpaired t-test with equal variances was performed when the data were normally distributed, if not, the non-parametric Mann U Whitney test was performed (GraphPad Prism 6).
Fig. 4.

Differential expression of proteins encoded by MS susceptibility genes. The scatter plots represent the log2-transformed protein abundances of proteins expressed from indicated MS susceptibility genes in CD4+ T cells and CD8+ T cells from MS patients (MS) and healthy controls (HC). Student t tests were used to compare the groups as specified in Materials and Methods. The horizontal lines represents the median within the groups
Fig. 5.

Genotype-dependent expression of proteins encoded by MS susceptibility genes. The scatter plots display the log2-transformed protein abundances of proteins expressed from indicated MS susceptibility genes as function of the MS risk SNP genotype in samples from CD4+ T cells (left and middle plot) and CD8+ T cells (right plot) from both MS patients and healthy controls sorted for the genotype of indicated MS-susceptibility SNPs. For normalized distributions (LEF1 and RUNX3), Student t-test were performed, otherwise (STAT3), the non-parametric Mann U Whitney test was performed to compare the groups. The horizontal lines represents the median within the groups
Data processing, principal component and hierarchical clustering analyses
Proteins identified as “only identified by site”, “reverse” or “potential contaminant” by Max Quant were removed from further analyses. In Perseus (Perseus Software, version 1.6.0.7), the normalized LFQ intensities from Max Quant were log2 transformed and the normal distributions were controlled using histogram function for each individual. Proteins with at least 70 percentage valid values in each group (healthy control and MS) were analyzed. Further, hierarchical clustering was performed using Z-scores created by default settings in Perseus. A principal component analysis (PCA) plot was generated using protein intensities as variables, with the missing protein intensity values imputed from the normal distribution using default settings in Perseus.
Ingenuity pathway analyses
QIAGEN’s Ingenuity® pathway Analysis (IPA®, QIAGEN, version 44691306 date; 2018-06-15, build version: 481437M date; 2018-08-25) was used for functional interpretation of significantly regulated proteins. The default settings were used, except only the following confidence, species and tissues and cells were permitted: “only experimentally observed” (confidence), “only mammals” (species) and “only T cells” (primary and cell-lines (tissues and cells)). A Benjamin-Hochberg (B-H) multiple testing correction was used, where a −log(B-H p-value) of 1.3 was considered as significant.
Results
Differential protein expression is observed in T cells between MS patients and healthy control
In this study, we monitored the difference in the proteomic profiles in T cells, i.e. CD4+ and CD8+ T cells, between RRMS patients (n = 13) and healthy controls (n = 14) in a label-free manner. We were able to identify and quantify 2031 and 2259 proteins in CD4+ and CD8+ T cells, respectively. In CD4+ T cells, 228 proteins were differentially expressed (p < 0.05) between MS cases and healthy controls (listed in Additional file 1: Table S1), whereas 195 proteins were differentially expressed between the two groups in CD8+ T cells (listed in Additional file 2: Table S2). Of the differentially expressed proteins, 74% in CD4+ T cells and 64% in CD8+ T cells were more abundant in samples from MS patients compared to healthy controls. The separation of MS versus healthy controls based on these proteins is shown in the principal component analyses (PCA) plot in Fig. 1, where the first component captures 55% (CD4+) and 62% (CD8+) of the variance, whereas the second component captures 11% (CD4+) and 9% (CD8+). Of the differentially expressed proteins, 26 overlapped between CD4+ and CD8+ T cells.
Fig. 1.
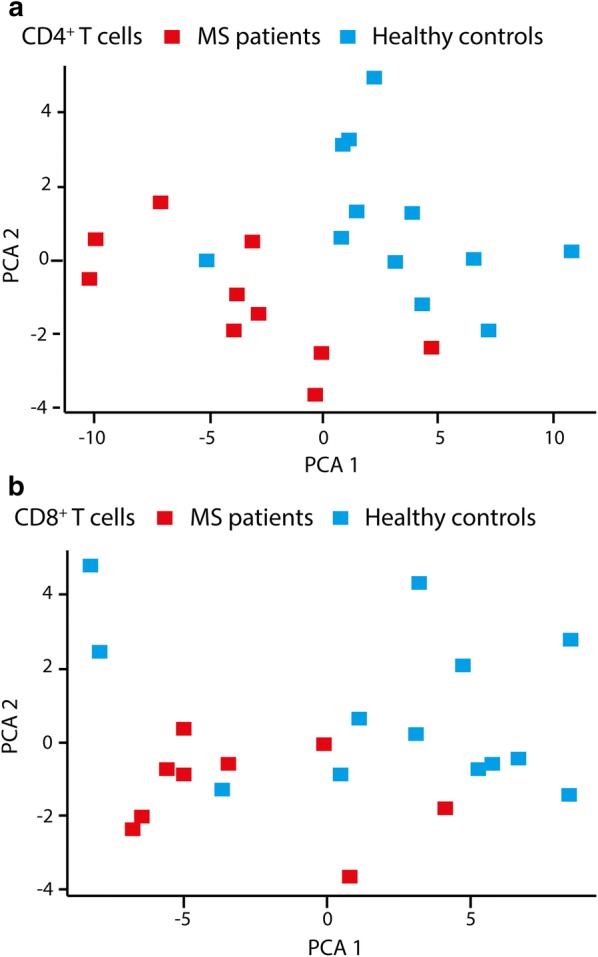
Principal component analyses (PCA) of differentially expressed proteins. PCA of proteins significantly different (p < 0.05) in a CD4+ and b CD8+ T cells from MS cases (red) compared to healthy controls (blue)
Ingenuity pathway analyses of differentially expressed proteins
To increase the chance of extracting the true candidate proteins differentially expressed between MS cases and healthy controls with a potential impact on cell function, a more stringent filter for selection was applied. By selecting proteins that fulfilled two of the three following criteria within the group of significantly differential expressed proteins (p < 0.05): (1) p-value cut-off of p < 0.01; (2) area under the curve (AUC) > 0.8 and (3) log2 fold change > [0.2], we created a top-hit list of differentially expressed proteins. Out of the 228 and 195 proteins listed in Additional file 1: Table S1 and Additional file 2: Table S2 from CD4+ and CD8+ T cells, respectively, we ended up with a shorter list of 90 and 61 proteins (Tables 2, 3), where five proteins expressed from the TOMM70A, ACP1, AGL, ATP2A2 and TPM4 genes appeared in both top-hit lists.
Table 2.
Top-hit list of differentially expressed proteins in CD4+ T cells
| Accession | Protein identity | Gene names | p-value | FC MS versus HC (log2) | Median intensity MS (log2) | MS SD | Median intensity HC (log2) | HC SD | % seq cov | # pep | AUC |
|---|---|---|---|---|---|---|---|---|---|---|---|
| Q5JSL3 | Dedicator of cytokinesis protein 11 | DOCK11 | 4.69E−05 | 0.27405 | 22.73205 | 0.14968 | 22.458 | 0.11384 | 13 | 21 | 0.98 |
| Q03252 | Lamin-B2 | LMNB2 | 0.000203 | 0.2023 | 26.23395 | 0.10367 | 26.03165 | 0.1219 | 58.1 | 42 | 0.94 |
| Q14978 | Nucleolar and coiled-body phosphoprotein 1 | NOLC1 | 0.000306 | 0.67815 | 21.4053 | 0.26237 | 20.72715 | 0.36787 | 16.2 | 9 | 0.92 |
| Q2M2I8; Q9NSY1 | AP2-associated protein kinase 1 | AAK1 | 0.000457 | 0.22605 | 23.1178 | 0.11404 | 22.89175 | 0.12897 | 33 | 20 | 0.92 |
| Q13148 | TAR DNA-binding protein 43 | TARDBP | 0.000642 | 0.29 | 23.3943 | 0.12816 | 23.1043 | 0.14754 | 39.4 | 11 | 0.89 |
| P20963 | T-cell surface glycoprotein CD3 zeta chain | CD247 | 0.000907 | 0.19535 | 23.48275 | 0.0965 | 23.2874 | 0.18125 | 60.4 | 11 | 0.88 |
| P49959 | Double-strand break repair protein MRE11A | MRE11A | 0.001405 | 0.1957 | 21.44665 | 0.17074 | 21.25095 | 0.15881 | 21.6 | 11 | 0.88 |
| P06239 | Tyrosine-protein kinase Lck | LCK | 0.001598 | 0.2009 | 24.642 | 0.12459 | 24.4411 | 0.13158 | 49.7 | 18 | 0.85 |
| Q9NR56; Q5VZF2; Q9NUK0 | Muscleblind-like protein 1 | MBNL1 | 0.001651 | 0.3464 | 22.0867 | 0.19817 | 21.7403 | 0.24361 | 21.6 | 8 | 0.87 |
| P35573 | Glycogen debranching enzyme; 4-alpha-glucanotransferase; amylo-alpha-1,6-glucosidase | AGL | 0.00177 | 0.32245 | 21.79335 | 0.29915 | 21.4709 | 0.18837 | 18.1 | 18 | 0.87 |
| P18085 | ADP-ribosylation factor 4 | ARF4 | 0.00199 | − 0.29765 | 21.6712 | 0.17375 | 21.96885 | 0.14457 | 64.4 | 10 | 0.86 |
| O75131; Q96FN4; Q8IYJ1; Q9HCH3; Q9UBL6 | Copine-3 | CPNE3 | 0.002255 | 0.1118 | 23.9288 | 0.09682 | 23.817 | 0.07363 | 46.7 | 19 | 0.88 |
| P27824 | Calnexin | CANX | 0.002331 | − 0.2029 | 24.6288 | 0.09381 | 24.8317 | 0.13864 | 37.7 | 22 | 0.85 |
| Q49A26 | Putative oxidoreductase GLYR1 | GLYR1 | 0.002442 | 0.2299 | 22.8002 | 0.15088 | 22.5703 | 0.13549 | 40 | 14 | 0.88 |
| P12694 | 2-oxoisovalerate dehydrogenase subunit alpha, mitochondrial | BCKDHA | 0.002513 | 0.2997 | 20.58005 | 0.14155 | 20.28035 | 0.16289 | 21.1 | 6 | 0.89 |
| P16615 | Sarcoplasmic/endoplasmic reticulum calcium ATPase 2 | ATP2A2 | 0.002577 | − 0.34015 | 20.91155 | 0.24663 | 21.2517 | 0.39528 | 22.5 | 15 | 0.85 |
| P31146; REV__Q02818 | Coronin-1A | CORO1A | 0.002667 | 0.196 | 28.77805 | 0.04311 | 28.58205 | 0.14531 | 63.8 | 33 | 0.91 |
| P29401 | Transketolase | TKT | 0.002709 | 0.18195 | 27.0961 | 0.16375 | 26.91415 | 0.08497 | 68.9 | 38 | 0.86 |
| Q00610; P53675 | Clathrin heavy chain 1 | CLTC | 0.00312 | − 0.10695 | 26.3723 | 0.05858 | 26.47925 | 0.08019 | 58.7 | 80 | 0.83 |
| P19971 | Thymidine phosphorylase | TYMP | 0.003318 | − 0.6095 | 21.51775 | 0.63532 | 22.12725 | 0.52772 | 51 | 16 | 0.85 |
| Q16401 | 26S proteasome non-ATPase regulatory subunit 5 | PSMD5 | 0.003478 | 0.12765 | 23.7053 | 0.09891 | 23.57765 | 0.13094 | 58.9 | 21 | 0.86 |
| Q15084 | Protein disulfide-isomerase A6 | PDIA6 | 0.003546 | − 0.3043 | 23.5948 | 0.25739 | 23.8991 | 0.17192 | 45.9 | 13 | 0.86 |
| P07237 | Protein disulfide-isomerase | P4HB | 0.003888 | − 0.1857 | 25.1359 | 0.14266 | 25.3216 | 0.09151 | 56.1 | 27 | 0.85 |
| O43665 | Regulator of G-protein signaling 10 | RGS10 | 0.003925 | 0.2594 | 23.5918 | 0.213 | 23.3324 | 0.14464 | 60.1 | 12 | 0.85 |
| P27986; O00459 | Phosphatidylinositol 3-kinase regulatory subunit alpha | PIK3R1 | 0.004008 | 0.2604 | 22.56095 | 0.17873 | 22.30055 | 0.21783 | 38.3 | 19 | 0.83 |
| Q9Y4L1 | Hypoxia up-regulated protein 1 | HYOU1 | 0.004021 | − 0.1815 | 23.00205 | 0.13058 | 23.18355 | 0.13156 | 31.8 | 20 | 0.83 |
| O75306 | NADH dehydrogenase [ubiquinone] iron-sulfur protein 2, mitochondrial | NDUFS2 | 0.004057 | 0.13545 | 22.6738 | 0.08259 | 22.53835 | 0.13156 | 34.8 | 12 | 0.83 |
| Q8WUX9 | Charged multivesicular body protein 7 | CHMP7 | 0.004115 | 0.23275 | 21.9775 | 0.21092 | 21.74475 | 0.18291 | 37.1 | 13 | 0.81 |
| P07602 | Prosaposin; Saposin-A; Saposin-B-Val; Saposin-B; Saposin-C; Saposin-D | PSAP | 0.004366 | − 0.19325 | 22.296 | 0.18336 | 22.48925 | 0.42157 | 12.6 | 6 | 0.94 |
| O00422 | Histone deacetylase complex subunit SAP18 | SAP18 | 0.004452 | 0.37715 | 20.6193 | 0.18761 | 20.24215 | 0.34985 | 41.8 | 5 | 0.87 |
| Q9ULA0 | Aspartyl aminopeptidase | DNPEP | 0.004664 | 0.3613 | 23.6397 | 0.17228 | 23.2784 | 0.18788 | 53.3 | 18 | 0.82 |
| O43681 | ATPase ASNA1 | ASNA1 | 0.004954 | − 0.11665 | 22.25215 | 0.13672 | 22.3688 | 0.11129 | 50.6 | 10 | 0.83 |
| O75832 | 26S proteasome non-ATPase regulatory subunit 10 | PSMD10 | 0.004963 | 0.21305 | 21.312 | 0.24569 | 21.09895 | 0.12837 | 40.3 | 6 | 0.89 |
| P30536 | Translocator protein | TSPO | 0.004964 | 0.5376 | 22.44845 | 0.37985 | 21.91085 | 0.337 | 23.1 | 3 | 0.82 |
| P24666 | Low molecular weight phosphotyrosine protein phosphatase | ACP1 | 0.005013 | 0.2241 | 22.8028 | 0.19373 | 22.5787 | 0.20543 | 72.2 | 8 | 0.88 |
| Q4G176 | Acyl-CoA synthetase family member 3, mitochondrial | ACSF3 | 0.005127 | 0.3234 | 20.8339 | 0.32659 | 20.5105 | 0.20115 | 19.3 | 7 | 0.83 |
| P35611 | Alpha-adducin | ADD1 | 0.005201 | 0.17245 | 23.941 | 0.12213 | 23.76855 | 0.20616 | 44.9 | 24 | 0.81 |
| P19525 | Interferon-induced, double-stranded RNA-activated protein kinase | EIF2AK2 | 0.005211 | − 0.54585 | 20.65625 | 0.47474 | 21.2021 | 0.40633 | 20.1 | 9 | 0.87 |
| O75791 | GRB2-related adapter protein 2 | GRAP2 | 0.00589 | 0.1927 | 23.58335 | 0.07421 | 23.39065 | 0.15601 | 43 | 13 | 0.84 |
| Q16666; Q6N021 | Gamma-interferon-inducible protein 16 | IFI16 | 0.006051 | − 0.27745 | 24.51685 | 0.24674 | 24.7943 | 0.12775 | 43.4 | 31 | 0.84 |
| Q9HAV4 | Exportin-5 | XPO5 | 0.006457 | − 0.402 | 18.4781 | 0.23884 | 18.8801 | 0.22546 | 5.1 | 4 | 0.87 |
| Q9NRY5 | Protein FAM114A2 | FAM114A2 | 0.006779 | 0.4935 | 19.3331 | 0.23485 | 18.8396 | 0.34369 | 15.8 | 4 | 0.86 |
| P11177 | Pyruvate dehydrogenase E1 component subunit beta, mitochondrial | PDHB | 0.006838 | 0.2322 | 24.05355 | 0.11379 | 23.82135 | 0.12468 | 52.9 | 13 | 0.83 |
| Q9NZZ3 | Charged multivesicular body protein 5 | CHMP5 | 0.006962 | − 0.28845 | 20.37145 | 0.31795 | 20.6599 | 0.20311 | 40.6 | 6 | 0.83 |
| P53634 | Dipeptidyl peptidase 1; dipeptidyl peptidase 1 exclusion domain chain; dipeptidyl peptidase 1 heavy chain; dipeptidyl peptidase 1 light chain | CTSC | 0.006992 | − 0.36305 | 20.5409 | 0.54754 | 20.90395 | 0.10359 | 19.9 | 7 | 0.81 |
| Q06546 | GA-binding protein alpha chain | GABPA | 0.006996 | 0.2074 | 21.3763 | 0.1983 | 21.1689 | 0.20734 | 28 | 8 | 0.8 |
| P21399 | Cytoplasmic aconitate hydratase | ACO1 | 0.008051 | 0.1699 | 21.4757 | 0.14153 | 21.3058 | 0.20875 | 20.4 | 11 | 0.82 |
| Q9H400 | Lck-interacting transmembrane adapter 1 | LIME1 | 0.008125 | 0.25515 | 21.11 | 0.19997 | 20.85485 | 0.21307 | 46.1 | 7 | 0.81 |
| Q02750 | Dual specificity mitogen-activated protein kinase kinase 1 | MAP2K1 | 0.00822 | 0.1771 | 23.2231 | 0.13291 | 23.046 | 0.1348 | 42.2 | 14 | 0.8 |
| O94826 | Mitochondrial import receptor subunit TOM70 | TOMM70A | 0.008231 | 0.21725 | 22.34995 | 0.15186 | 22.1327 | 0.20502 | 34.5 | 13 | 0.81 |
| O75475 | PC4 and SFRS1-interacting protein | PSIP1 | 0.008443 | 0.1899 | 22.08185 | 0.1504 | 21.9335 | 0.15516 | 45.5 | 21 | 0.8 |
| P02776 | Platelet factor 4; platelet factor 4, short form | PF4 | 0.008535 | − 1.5035 | 24.86845 | 1.22842 | 24.67855 | 1.48716 | 36.6 | 5 | 0.83 |
| Q5XKP0 | Protein QIL1 | QIL1 | 0.008552 | 0.31595 | 22.7718 | 0.27181 | 24.2753 | 0.34286 | 62.7 | 3 | 0.84 |
| Q9UGI8 | Testin | TES | 0.008688 | 0.14215 | 19.94335 | 0.09764 | 19.6274 | 0.12853 | 72 | 31 | 0.8 |
| Q86VP6; O75155 | Cullin-associated NEDD8-dissociated protein 1 | CAND1 | 0.008724 | 0.11355 | 25.3342 | 0.10321 | 25.19205 | 0.08176 | 48.9 | 46 | 0.84 |
| Q9C0K0 | B-cell lymphoma/leukemia 11B | BCL11B | 0.008892 | 0.2434 | 25.65085 | 0.17505 | 25.5373 | 0.22495 | 12.8 | 8 | 0.79 |
| P13861; P31323 | cAMP-dependent protein kinase type II-alpha regulatory subunit | PRKAR2A | 0.008993 | 0.13145 | 21.90015 | 0.12538 | 21.65675 | 0.09173 | 62.1 | 20 | 0.81 |
| P07741 | Adenine phosphoribosyltransferase | APRT | 0.008995 | 0.19165 | 23.14455 | 0.1699 | 23.0131 | 0.15824 | 91.1 | 17 | 0.83 |
| P23246 | Splicing factor, proline- and glutamine-rich | SFPQ | 0.009648 | 0.12175 | 25.8719 | 0.14919 | 25.68025 | 0.09657 | 47.9 | 31 | 0.83 |
| P49903 | Selenide, water dikinase 1 | SEPHS1 | 0.009747 | 0.2257 | 26.39505 | 0.15139 | 26.2733 | 0.15099 | 41.6 | 10 | 0.83 |
| P62995 | Transformer-2 protein homolog beta | TRA2B | 0.009757 | 0.17515 | 22.6718 | 0.18232 | 22.4461 | 0.12504 | 30.9 | 8 | 0.8 |
| Q86XP3 | ATP-dependent RNA helicase DDX42 | DDX42 | 0.009985 | 0.1467 | 23.91205 | 0.20211 | 23.7369 | 0.12402 | 22.7 | 13 | 0.85 |
| P13010 | X-ray repair cross-complementing protein 5 | XRCC5 | 0.01116 | 0.2196 | 22.23445 | 0.1468 | 22.08775 | 0.12306 | 71.2 | 48 | 0.82 |
| Q15428 | Splicing factor 3A subunit 2 | SF3A2 | 0.011498 | 0.30175 | 25.0703 | 0.2546 | 25.26055 | 0.28193 | 28.7 | 9 | 0.85 |
| P37837 | Transaldolase | TALDO1 | 0.011683 | 0.26525 | 24.0953 | 0.16309 | 23.9199 | 0.1934 | 47.2 | 19 | 0.8 |
| O94973 | AAK1 | AP2A2 | 0.01208 | 0.40715 | 22.87215 | 0.18724 | 22.7054 | 0.31295 | 25 | 16 | 0.82 |
| P16150 | Leukosialin | SPN | 0.012636 | 0.41995 | 27.0869 | 0.31488 | 26.8673 | 0.23838 | 19.5 | 5 | 0.8 |
| Q9Y6K5 | 2-5-oligoadenylate synthase 3 | OAS3 | 0.013062 | − 0.58225 | 24.1071 | 0.61142 | 23.9796 | 0.40043 | 26.2 | 21 | 0.8 |
| P13598 | Intercellular adhesion molecule 2 | ICAM2 | 0.013215 | − 0.33575 | 22.4839 | 0.36073 | 22.18215 | 0.13532 | 14.9 | 3 | 0.81 |
| O96000 | NADH dehydrogenase [ubiquinone] 1 beta subcomplex subunit 10 | NDUFB10 | 0.013266 | 0.2682 | 27.0077 | 0.2602 | 26.74245 | 0.17232 | 43 | 7 | 0.82 |
| P48059; Q7Z4I7 | LIM and senescent cell antigen-like-containing domain protein 1 | LIMS1 | 0.013613 | − 1.11835 | 22.2423 | 1.06748 | 22.4974 | 1.04857 | 45.8 | 13 | 0.83 |
| P0DOX5; P01857 | Ig gamma-1 chain C region | IGHG1 | 0.014981 | − 0.8553 | 21.9197 | 0.96324 | 21.51255 | 0.41275 | 28.3 | 9 | 0.8 |
| P67936 | Tropomyosin alpha-4 chain | TPM4 | 0.015875 | − 0.39585 | 22.849 | 0.50209 | 22.42905 | 0.33951 | 66.1 | 27 | 0.81 |
| Q53QZ3 | Rho GTPase-activating protein 15 | ARHGAP15 | 0.016084 | 0.2283 | 22.7616 | 0.11442 | 22.6226 | 0.26067 | 28.8 | 10 | 0.8 |
| Q93077; Q7L7L0; P04908 | Histone H2A type 1-C; histone H2A type 3; histone H2A type 1-B/E | HIST1H2AC; HIST3H2A; HIST1H2AB | 0.016472 | 0.5318 | 24.6077 | 0.68101 | 24.4913 | 0.51829 | 35.4 | 7 | 0.83 |
| Q00341 | Vigilin | HDLBP | 0.017653 | − 0.3557 | 22.1316 | 0.25975 | 22.71385 | 0.26847 | 5.3 | 5 | 0.8 |
| Q9Y3C4 | EKC/KEOPS complex subunit TPRKB | TPRKB | 0.01784 | 0.33545 | 25.2378 | 0.31196 | 25.04925 | 0.2556 | 56.6 | 7 | 0.83 |
| Q96I24 | Far upstream element-binding protein 3 | FUBP3 | 0.018912 | 0.2288 | 19.18425 | 0.18212 | 19.52 | 0.15408 | 24.7 | 9 | 0.81 |
| P18206 | Vinculin | VCL | 0.019685 | − 0.57615 | 22.07985 | 0.84436 | 21.81165 | 0.52692 | 64.2 | 60 | 0.83 |
| Q96BW5 | Phosphotriesterase-related protein | PTER | 0.020487 | 0.35515 | 23.0556 | 0.21492 | 22.8575 | 0.29673 | 24.4 | 6 | 0.82 |
| P02775 | Platelet basic protein; connective tissue-activating peptide III; TC-2; connective tissue-activating peptide III(1-81); beta-thromboglobulin; neutrophil-activating peptide 2(74); neutrophil-activating peptide 2(73); neutrophil-activating peptide 2; TC-1; Neutrophil-activating peptide 2(1–66); neutrophil-activating peptide 2(1–63) | PPBP | 0.022319 | − 1.4945 | 21.6995 | 1.19479 | 21.55895 | 1.23096 | 38.3 | 5 | 0.81 |
| P21333 | Filamin-A | FLNA | 0.023825 | − 0.23365 | 21.21755 | 0.43258 | 22.3359 | 0.24022 | 71.6 | 137 | 0.81 |
| Q01469; A8MUU1 | Fatty acid-binding protein, epidermal | FABP5 | 0.024356 | − 0.5329 | 26.41625 | 0.73245 | 26.33375 | 0.55502 | 76.3 | 11 | 0.83 |
| O94903 | Proline synthase co-transcribed bacterial homolog protein | PROSC | 0.024792 | 0.27275 | 24.465 | 0.13221 | 24.3072 | 0.20226 | 37.8 | 8 | 0.8 |
| P21291 | Cysteine and glycine-rich protein 1 | CSRP1 | 0.026425 | − 0.2011 | 25.4829 | 0.36999 | 25.34655 | 0.16603 | 64.2 | 8 | 0.8 |
| P53041 | Serine/threonine-protein phosphatase 5 | PPP5C | 0.028586 | 0.2748 | 23.5436 | 0.14823 | 23.3623 | 0.29589 | 22.8 | 8 | 0.84 |
| Q8WUM0 | Nuclear pore complex protein Nup133 | NUP133 | 0.030136 | 0.272 | 21.15755 | 0.26096 | 22.01285 | 0.19541 | 18.3 | 12 | 0.81 |
| P09525 | Annexin A4 | ANXA4 | 0.032901 | − 0.25805 | 26.25495 | 0.30546 | 26.6508 | 0.2431 | 47.6 | 13 | 0.82 |
| Q04826 | HLA class I histocompatibility antigen, B-40 alpha chain | HLA-B | 0.033546 | − 1.0305 | 21.98915 | 0.72834 | 21.76085 | 0.84434 | 44.5 | 13 | 0.81 |
| O43704 | Sulfotransferase family cytosolic 1B member 1 | SULT1B1 | 0.035541 | 0.4495 | 26.00495 | 0.2866 | 26.19745 | 0.42792 | 39.2 | 9 | 0.82 |
The table displays proteins (n = 90) that are differentially expressed in CD4+ T cells from MS patients compared to healthy controls (HC). The proteins are extracted from Additional file 1: Table S1 and selected by fulfilling at least two of the three criteria: p-value (p < 0.01), area under the curve (AUC) (AUC > 0.8) and log fold-change (FC) > [0.2] between samples from MS patients and healthy controls. The log2-fold changes in MS versus HC are based on normalized values. Accession number, protein identity and gene names are indicated for each protein, in addition to median log2-transformed protein abundances with standard variation (SD) for each group, the percentage of sequence coverage (% seq cov) and number of peptides (# pep) identified for each protein
Table 3.
Top-hit list of differentially expressed proteins in CD8+ T cells from MS patients compared healthy controls
| Accession | Protein identity | Gene names | p-value | FC MS versus HC (log2) | Median intesity MS (log2) | MS SD | Median intensity HC (log2) | HC SD | % seq cov | # pep | AUC |
|---|---|---|---|---|---|---|---|---|---|---|---|
| P36915 | Guanine nucleotide-binding protein-like 1 | GNL1 | 0.000363 | 0.3823 | 22.9373 | 0.13239 | 22.555 | 0.19548 | 22.6 | 9 | 0.9 |
| P57764 | Gasdermin-D | GSDMD | 0.0004 | − 0.247 | 23.0081 | 0.09966 | 23.2551 | 0.13969 | 27.9 | 8 | 0.91 |
| Q15027 | Arf-GAP with coiled-coil, ANK repeat and PH domain-containing protein 1 | ACAP1 | 0.000818 | 0.3588 | 25.3317 | 0.13259 | 24.9729 | 0.21057 | 44.7 | 22 | 0.89 |
| Q14240 | Eukaryotic initiation factor 4A-II; eukaryotic initiation factor 4A-II, N-terminally processed | EIF4A2 | 0.001679 | 0.2287 | 25.7838 | 0.1338 | 25.5551 | 0.31408 | 75.4 | 23 | 0.92 |
| Q9GZP4 | PITH domain-containing protein 1 | PITHD1 | 0.001791 | 0.1974 | 22.8647 | 0.13746 | 22.3619 | 0.14509 | 47.9 | 8 | 0.91 |
| P10155 | 60 kDa SS-A/Ro ribonucleoprotein | TROVE2 | 0.001865 | 0.1765 | 25.7638 | 0.08234 | 25.9917 | 0.13787 | 37.4 | 16 | 0.87 |
| P14174 | Macrophage migration inhibitory factor | MIF | 0.002217 | 0.3238 | 23.462 | 0.21611 | 23.2646 | 0.28198 | 36.5 | 4 | 0.88 |
| Q96ST3 | Paired amphipathic helix protein Sin3a | SIN3A | 0.002395 | 0.2302 | 25.1124 | 0.11111 | 24.9359 | 0.14227 | 14.2 | 13 | 0.85 |
| P06703 | Protein S100-A6 | S100A6 | 0.002446 | − 0.7296 | 26.8304 | 0.62637 | 26.5066 | 0.61209 | 52.2 | 4 | 0.9 |
| P51452 | Dual specificity protein phosphatase 3 | DUSP3 | 0.002706 | − 0.5138 | 23.1048 | 0.19565 | 22.8746 | 0.4382 | 29.2 | 4 | 0.88 |
| O75431 | Metaxin-2 | MTX2 | 0.002927 | 0.293 | 25.2256 | 0.21249 | 25.9552 | 0.11457 | 33.8 | 5 | 0.82 |
| Q8TBC4 | NEDD8-activating enzyme E1 catalytic subunit | UBA3 | 0.002937 | 0.1439 | 24.5971 | 0.10266 | 24.3764 | 0.1286 | 51.6 | 13 | 0.85 |
| P30405; Q6BAA4 | Peptidyl-prolyl cis–trans isomerase F, mitochondrial | PPIF | 0.003314 | − 1.0344 | 21.1705 | 0.33533 | 21.6843 | 0.63539 | 40.1 | 8 | 0.84 |
| P21953 | 2-oxoisovalerate dehydrogenase subunit beta, mitochondrial | BCKDHB | 0.003651 | 0.2586 | 22.4515 | 0.21161 | 22.1585 | 0.24451 | 15.3 | 4 | 0.83 |
| Q8TCD5 | 5(3)-deoxyribonucleotidase, cytosolic type | NT5C | 0.003791 | 0.3211 | 24.2434 | 0.14217 | 24.0995 | 0.45523 | 54.2 | 7 | 0.86 |
| P57737 | Coronin-7 | CORO7 | 0.004431 | 0.147 | 23.7522 | 0.148 | 23.3999 | 0.0888 | 49.4 | 28 | 0.86 |
| O94925 | Glutaminase kidney isoform, mitochondrial | GLS | 0.0047 | 0.1506 | 22.33535 | 0.10161 | 22.9562 | 0.13926 | 45 | 22 | 0.85 |
| Q3ZCW2 | Galectin-related protein | LGALSL | 0.005089 | − 2.2604 | 21.7926 | 0.93109 | 22.827 | 0.91857 | 61 | 8 | 0.86 |
| P63151; Q00005; Q9Y2T4 | Serine/threonine-protein phosphatase 2A 55 kDa regulatory subunit B alpha isoform | PPP2R2A | 0.005319 | 0.243 | 21.8042 | 0.15983 | 21.5456 | 0.24976 | 48.1 | 12 | 0.84 |
| O94826 | Mitochondrial import receptor subunit TOM70 | TOMM70A | 0.005477 | 0.235 | 23.0302 | 0.0878 | 22.7091 | 0.2231 | 32.1 | 13 | 0.89 |
| Q13586; Q9P246 | Stromal interaction molecule 1 | STIM1 | 0.005533 | − 0.2404 | 26.1487 | 0.20417 | 26.0017 | 0.23545 | 32.7 | 16 | 0.82 |
| P13224 | Platelet glycoprotein Ib beta chain | GP1BB | 0.005768 | − 1.9102 | 24.998 | 0.8499 | 24.8474 | 1.00102 | 23.8 | 5 | 0.82 |
| O00186 | Syntaxin-binding protein 3 | STXBP3 | 0.005812 | 0.193 | 22.9285 | 0.11405 | 23.296 | 0.15529 | 10.5 | 5 | 0.87 |
| P20645 | Cation-dependent mannose-6-phosphate receptor | M6PR | 0.006115 | − 0.1934 | 22.3302 | 0.22866 | 23.6924 | 0.17682 | 22 | 4 | 0.84 |
| Q96RQ3 | Methylcrotonoyl-CoA carboxylase subunit alpha, mitochondrial | MCCC1 | 0.007633 | 0.5028 | 21.2898 | 0.19278 | 23.5502 | 0.34081 | 16.4 | 7 | 0.83 |
| P78417 | Glutathione S-transferase omega-1 | GSTO1 | 0.007795 | − 0.2279 | 23.6102 | 0.09562 | 23.1469 | 0.19987 | 59.3 | 14 | 0.79 |
| P24666 | Low molecular weight phosphotyrosine protein phosphatase | ACP1 | 0.008395 | 0.2207 | 23.6258 | 0.18286 | 23.3828 | 0.19924 | 72.2 | 8 | 0.82 |
| Q9H0R4 | Haloacid dehalogenase-like hydrolase domain-containing protein 2 | HDHD2 | 0.008617 | 0.3523 | 24.1578 | 0.21888 | 23.9228 | 0.23008 | 67.2 | 8 | 0.84 |
| Q12913 | Receptor-type tyrosine-protein phosphatase eta | PTPRJ | 0.008808 | − 0.62085 | 24.2463 | 0.30864 | 24.4867 | 0.44153 | 10.9 | 11 | 0.83 |
| P49327 | Fatty acid synthase; [acyl-carrier-protein] S-acetyltransferase;[acyl-carrier-protein] S-malonyltransferase; 3-oxoacyl-[acyl-carrier-protein] synthase; 3-oxoacyl-[acyl-carrier-protein] reductase; 3-hydroxyacyl-[acyl-carrier-protein] dehydratase; enoyl-[acyl-carrier-protein] reductase; oleoyl-[acyl-carrier-protein] hydrolase | FASN | 0.009384 | − 0.3675 | 23.3745 | 0.18085 | 25.2847 | 0.4045 | 10.9 | 18 | 0.8 |
| P04275 | von Willebrand factor; von Willebrand antigen 2 | VWF | 0.009824 | − 1.3622 | 22.1391 | 1.21897 | 21.9461 | 1.05341 | 13 | 25 | 0.84 |
| P35573 | Glycogen debranching enzyme; 4-alpha-glucanotransferase; amylo-alpha-1,6-glucosidase | AGL | 0.010066 | 0.4633 | 21.956 | 0.26486 | 21.7305 | 0.29541 | 20.9 | 22 | 0.8 |
| Q8TDQ7 | Glucosamine-6-phosphate isomerase 2 | GNPDA2 | 0.010164 | 0.2255 | 23.3542 | 0.28146 | 23.8593 | 0.21281 | 59.8 | 10 | 0.84 |
| P16615 | Sarcoplasmic/endoplasmic reticulum calcium ATPase 2 | ATP2A2 | 0.010248 | − 0.5051 | 24.5083 | 0.30171 | 24.3585 | 0.32708 | 28.7 | 21 | 0.81 |
| Q13555; Q13554 | Calcium/calmodulin-dependent protein kinase type II subunit gamma; calcium/calmodulin-dependent protein kinase type II subunit beta | CAMK2G; CAMK2B | 0.010445 | 0.2908 | 22.9757 | 0.12761 | 22.6849 | 0.25143 | 24.6 | 10 | 0.82 |
| P12931; Q9H3Y6; P42685; P08581; Q04912 | Proto-oncogene tyrosine-protein kinase Src | SRC | 0.01081 | − 1.20015 | 22.8527 | 0.73685 | 24.05285 | 0.66689 | 37.5 | 15 | 0.81 |
| Q15120 | [Pyruvate dehydrogenase (acetyl-transferring)] kinase isozyme 3, mitochondrial | PDK3 | 0.010829 | 0.24475 | 20.7149 | 0.28722 | 20.47015 | 0.26592 | 12.1 | 3 | 0.81 |
| P05556 | Integrin beta-1 | ITGB1 | 0.010894 | − 0.4327 | 24.5472 | 0.41637 | 24.9799 | 0.37748 | 32.8 | 19 | 0.81 |
| Q9P0J1 | [Pyruvate dehydrogenase [acetyl-transferring]]-phosphatase 1, mitochondrial | PDP1 | 0.011178 | 0.3474 | 22.5526 | 0.14746 | 22.2052 | 0.18283 | 16.9 | 7 | 0.82 |
| P01137 | Transforming growth factor beta-1; latency-associated peptide | TGFB1 | 0.012983 | − 0.87595 | 24.8165 | 0.44917 | 24.6229 | 0.65195 | 29.5 | 7 | 0.81 |
| P14770 | Platelet glycoprotein IX | GP9 | 0.013113 | − 1.25275 | 29.9764 | 0.73326 | 29.8298 | 0.84609 | 30.5 | 5 | 0.82 |
| P05386 | 60S acidic ribosomal protein P1 | RPLP1 | 0.014256 | 0.2666 | 22.157 | 0.16745 | 22.4676 | 0.17334 | 94.7 | 5 | 0.81 |
| Q02083 | N-acylethanolamine-hydrolyzing acid amidase; N-acylethanolamine-hydrolyzing acid amidase subunit alpha; N-acylethanolamine-hydrolyzing acid amidase subunit beta | NAAA | 0.014286 | 0.43565 | 23.0686 | 0.40847 | 23.6457 | 0.49594 | 27.9 | 8 | 0.87 |
| P50148; P29992; O95837 | Guanine nucleotide-binding protein G(q) subunit alpha | GNAQ | 0.014465 | − 0.487 | 24.8592 | 0.48364 | 24.5987 | 0.51884 | 30.6 | 8 | 0.82 |
| O14828 | Secretory carrier-associated membrane protein 3 | SCAMP3 | 0.014503 | − 0.2404 | 22.5342 | 0.16111 | 22.3259 | 0.19252 | 22.8 | 5 | 0.8 |
| P67936; Q2TAC2 | Tropomyosin alpha-4 chain | TPM4 | 0.015754 | − 0.598 | 23.0621 | 0.52458 | 22.8134 | 0.46362 | 70.6 | 27 | 0.81 |
| O14561 | Acyl carrier protein, mitochondrial | NDUFAB1 | 0.015958 | 0.2347 | 23.5152 | 0.23866 | 23.7086 | 0.12417 | 21.2 | 4 | 0.82 |
| Q00653 | Nuclear factor NF-kappa-B p100 subunit; nuclear factor NF-kappa-B p52 subunit | NFKB2 | 0.016322 | 0.322 | 22.11305 | 0.2449 | 22.989 | 0.28366 | 15.8 | 9 | 0.81 |
| P35244 | Replication protein A 14 kDa subunit | RPA3 | 0.016781 | 0.2976 | 23.4742 | 0.16891 | 24.72695 | 0.38956 | 86.8 | 7 | 0.8 |
| O95379 | Tumor necrosis factor alpha-induced protein 8 | TNFAIP8 | 0.016869 | 0.2251 | 22.0409 | 0.1305 | 23.8998 | 0.38972 | 40.4 | 5 | 0.8 |
| Q9NY12 | H/ACA ribonucleoprotein complex subunit 1 | GAR1 | 0.01728 | 0.2208 | 27.6053 | 0.18001 | 28.7912 | 0.21825 | 29 | 5 | 0.8 |
| P16109 | P-selectin | SELP | 0.017721 | − 2.0401 | 24.1549 | 1.03363 | 23.9684 | 1.06785 | 29 | 14 | 0.81 |
| Q96RP9 | Elongation factor G, mitochondrial | GFM1 | 0.020163 | 0.288 | 24.2375 | 0.19021 | 24.3248 | 0.22518 | 13.2 | 7 | 0.8 |
| Q96F86 | Enhancer of mRNA-decapping protein 3 | EDC3 | 0.02024 | 0.44525 | 26.7743 | 0.34422 | 26.5077 | 0.41686 | 12.4 | 3 | 0.82 |
| P08134 | Rho-related GTP-binding protein RhoC | RHOC | 0.022534 | 0.3601 | 23.692 | 0.17871 | 23.25635 | 0.48992 | 65.8 | 10 | 0.81 |
| Q15283 | Ras GTPase-activating protein 2 | RASA2 | 0.025799 | 0.2581 | 25.2002 | 0.25399 | 25.0644 | 0.3012 | 14.5 | 9 | 0.8 |
| O95866 | Protein G6b | G6B | 0.025824 | − 1.4023 | 21.8137 | 0.77427 | 22.3007 | 0.97969 | 23.7 | 5 | 0.81 |
| O75874 | Isocitrate dehydrogenase [NADP] cytoplasmic | IDH1 | 0.026221 | − 0.3508 | 21.6884 | 0.25198 | 21.9288 | 0.44714 | 52.4 | 17 | 0.81 |
| P09564 | T-cell antigen CD7 | CD7 | 0.027969 | 0.3583 | 22.542 | 0.19792 | 22.6533 | 0.35246 | 16.7 | 4 | 0.82 |
| O75439 | Mitochondrial-processing peptidase subunit beta | PMPCB | 0.031524 | 0.2241 | 22.4262 | 0.21703 | 24.1114 | 0.27829 | 22.1 | 7 | 0.83 |
| P24158 | Myeloblastin | PRTN3 | 0.049099 | − 0.55295 | 28.221 | 0.57502 | 28.819 | 0.84918 | 20.7 | 4 | 0.81 |
The table displays proteins (n = 61) that are differentially expressed in CD8+ T cells from MS patients compared to healthy controls (HC). The proteins are extracted from Additional file 2: Table S2 and selected by fulfilling at least two of the three criteria: p-value (p < 0.01), area under the curve (AUC) (AUC > 0.8) and log fold-change (FC) > [0.2] between samples from MS patients and healthy controls. The log2-fold changes in MS versus HC is based on normalized values. Accession number, protein identity and gene names are indicated for each protein, in addition to median log2-transformed protein abundances with standard variation (SD) for each group, the percentage of sequence coverage (% sequence coverage) and number of peptides (# peptides) identified for each protein
The ingenuity pathway analyses (IPA) software was used for network analyses of the top-hit proteins (Tables 2, 3) from the CD4+ and CD8+ T cell data sets separately. After correcting for multiple testing, we identified 14 biological processes in CD4+ T cells that were affected by the presence of MS disease (Fig. 2), however, no pathways were significant for CD8+ T cells. When performing network analyses of the entire list of 195 differentially expressed proteins (p < 0.05) from CD8+ T cells, two pathways were significant after multiple testing, i.e. the sirtuin signaling pathway and the protein kinase A pathway (data not shown). In the CD4+ T cell data set, mainly T cell activation pathways, such as CTLA4, CD28, T cell receptor, PKCθ and iCOS-iCOSL signaling and calcium-induced T lymphocyte apoptosis were identified. In addition, general pathways as for instance the pentose phosphate pathway in addition to immune related pathways were represented.
Fig. 2.

Enriched pathways in CD4+ T cells from MS patients. The graph displays the cellular pathways enriched in the proteomic profiles of the top-hit regulated proteins from MS patients as compared with healthy controls in CD4+ T cells after correcting for multiple testing (p-value, left axis). The orange line represents the ratio of the number of proteins in the data set of differentially expressed proteins divided by the number of proteins in the reference data set for that specific pathway (right axis)
Hierarchical clustering
The normalized intensities of the 90 and 61 proteins in the top-hit list (Tables 2, 3) in CD4+ and CD8+ T cells from MS patients and healthy controls were used as input to hierarchical clustering in Perseus (Fig. 3). The proteomic profiles for each cell type were divided into two groups consisting mainly of (1) MS and (2) healthy control samples. The differentially expressed proteins are divided into two major groups that are oppositely regulated between MS patients and healthy controls. Using IPA, we did not detect any enrichment for specific biological pathways if we separately analyzed proteins that are either up- or down-regulated in CD8+ T cells from MS patients. However, in the proteins that are upregulated in MS CD4+ T cells, there is an enrichment for T cell specific activation pathways, in addition to general pathways such as the pentose phosphate and sirtuin pathways. For the proteins that are down-regulated in MS CD4+ T cell samples, network analyses in IPA showed enrichment of proteins in integrin signaling and endocytic pathways (data not shown). Of note, we observed three exceptions where two MS patients clustered together with the healthy controls (one for each data set) and one healthy control clustered with MS patients in the CD8+ T cell data set.
Fig. 3.

Hierarchical clustering of differentially expressed proteins. The heatmaps show the hierarchical clustering of differentially expressed proteins from the top-hit list fulfilling two out of the three criteria: p < 0.01, AUC > 0.8 and log fold change > [0.2] in a CD4+ T cells and b CD8+ T cells from MS patients and healthy control using Perseus. Red: upregulated in MS samples, green: down-regulated in MS samples, grey: missing values. MS (black): samples from MS patients; HC (blue): samples from healthy controls
Analyses of proteins expressed by MS susceptibility genes
To date more than 200 non-HLA associated MS risk SNPs have been identified by genome-wide approaches [4, 5, 20]. We next selectively analyzed the abundance of proteins expressed from the gene(s) most proximal to these MS-associated SNPs in order to identify proteins with a potential impact on MS disease. For intergenic MS-associated SNPs, we analyzed the abundance of the proteins expressed from the most proximal gene both upstream and downstream of the SNPs. Not all MS susceptibility genes are expressed in T cells, and in our samples, we detected 31 proteins encoded from MS susceptibility genes in CD4+ T cells and 37 proteins in CD8+ T cells. Of these, eight proteins (seven in CD4+ T and one in CD8+ T cells) were differentially expressed in samples from MS cases versus healthy controls (Fig. 4).
To assess the functional link between GWAS-identified risk variants and disease, we evaluated whether there was any correlation between MS risk genotypes and expression of proteins encoded from the most proximal gene(s). For proteins that did not display any difference in abundance in samples from MS cases and healthy controls, i.e. 24 and 36 proteins from CD4+ and CD8+ T cells, respectively, samples (from both MS patients and healthy controls) were pooled by carriers of the risk allele at each SNP as compared to samples from individuals homozygous for the protective allele for each SNP. We observed a genotype-dependent expression of proteins expressed from the STAT3 and LEF1 genes in CD4+ T cells and the RUNX3 gene in CD8+ T cells (Fig. 5). However, after multiple testing these correlations did not reach statistical significance.
Discussion
MS is considered as an autoimmune disorder of the CNS and the pathological immune dysregulation involves an interaction between the innate and adaptive immune system. T cells are thought to be one of the main cellular drivers for disease development, and from genome-wide association screens, a significant enrichment of genetic loci encoding proteins in T-cell specific pathways is observed [5]. Nevertheless functional and epigenomic annotation studies of genetic risk loci suggests that also other cells of the immune system are involved [5, 21, 30]. Proteomic profiling of whole blood or peripheral blood mononuclear cells could contribute to achieve mechanistic insights behind the development of MS pathology. However, such samples are heterogeneous in their cellular composition, so any cell-specific variation may be overshadowed by variation in the proportions of the various cell types. In the current study, we therefore purified CD4+ and CD8+ T cells and compared their respective proteomic profiles between RRMS patients and healthy controls using liquid chromatography–tandem mass spectrometry. Our study provides evidence for proteomic differences in T cells from RRMS patients compared to healthy controls and identifies three putative pQTLs for proteins encoded by three MS susceptibility genes.
MS is an inflammatory disease that affects the CNS. The cerebrospinal fluid is an obvious fluid to perform proteomic profiling into search for biomarkers of MS, as it reflects ongoing pathological and inflammatory processes in the CNS. However, in the current study, we are examining immune cell subsets, i.e. CD4+ and CD8+ T cells that enables us to identify proteins and pathways involved in MS development. We are aware of that also other cells of the immune system, including B cells and innate cells such as NK cells and dendritic cells in addition to brain-resident immune cells, i.e. astrocytes [20], have potential impact on MS pathogenesis. However, this study enables us to achieve mechanistic insights into T-cell mediated pathology of MS. Identification of novel proteins and pathways involved in MS pathology could enable progress in the development of new drug targets in order to improve the clinical outcome of MS.
Hierarchical clustering of the differentially expressed proteins from our top-hit list of 90 and 61 proteins from CD4+ and CD8+ T cells, respectively, divided the samples into two main groups with MS patients and healthy controls. Of note, for each of the cell types, there was one MS patient sample (not the same in the two cell types) clustering with the healthy control group. One of these patients (MS12) has a benign form of MS, and in contrast to all other patients, this patient is currently electively untreated (3 years after inclusion to the study). One healthy control also groups with the MS patients for CD8+ T cells; however, whether this control experienced an undetected inflammatory condition or have developed autoimmunity after sample collection giving rise to a proteomic profile similar to MS cases is not known. Even though we have separated immune-cell subsets from the entire pool of immune cells in blood, we acknowledge that these sub-populations can be divided further into different subpopulations such as Th1 and Th2 cells, effector, memory and regulatory T cells. Whether the individuals not clustering with their own group have differences in the proportion of CD4+ and CD8+ T cell subsets is not known and could potentially affect the proteomic profile achieved. The fold change in protein abundance in T cells from MS patients and healthy controls are modest. However, enrichment in specific pathways (see Fig. 2) suggests that they collectively may have an impact on selected T cell responses. Also, the study is limited by the small sample size, and further studies are needed to validate and verify the biological impact of selected proteins in T cells.
Of the top-ten (based on p-value) differentially expressed proteins in each cell type, only three of them have previously been identified to have a potential role for MS, either through a genetic association, i.e. Lck [20], as a biomarker for MS progression and severity, i.e. macrophage migration inhibitory factor (MIF) [31, 32] or in functional studies, where gasdermin-D (GSDMD) is shown to promote inflammatory demyelination both in human cells and in murine models [33]. Of note, a selection of the top hit proteins in T cells [TAR binding protein (TARDBP), calnexin (CANX) and AP2 associated kinase 1 (AAK1)] have been shown to play important roles for other neurodegenerative disorders such as Alzheimer’s disease, Parkinson’s disease and amyotrophic lateral sclerosis [34–37], suggesting common disease mechanisms across neurodegenerative disorders and highlighting the importance for these proteins also in immune cells.
MS is an inflammatory disease, and therefore it is no surprise that the differentially expressed proteins in CD4+ T cells are enriched for pathways related to T cell activation or immune function. Whether these pathways are affected because of the active inflammation that is characteristic for the early phase of RRMS or whether similar changes can be detected prior to disease onset is not known. MS develops in genetic susceptible individuals, and genome-wide screenings have highlighted the importance of genes involved in T cell differentiation, in CD4+ T cells in particular [5]. Interestingly, we have identified eight proteins encoded by MS susceptibility genes (LCK, GRAP2, CD5, ZC3HAV1, SAE1, EPPK1 and CD6 in CD4+ T cells and TNFAIP8 in CD8+ T cells), which are more abundant in T cells from MS patients compared to healthy controls. This underlines the potential role for these MS susceptibility genes in T cells during MS development prior to disease onset.
Furthermore, correlating MS risk genotype with protein expression from genes proximal to MS risk SNPs, we identified three potential pQTLs, i.e. rs1026916, rs9992731 and rs6672420. Samples from individuals homozygous for the protective allele displayed higher expression of the specified proteins compared to samples from individual being a carrier of the risk allele. Even though these correlations did not reach statistical significance after multiple testing, the data indicate that these SNP-protein pairs are of relevance to study further as the corresponding MS associated SNPs could act as pQTLs. Interestingly, the rs1026916 SNP has previously been shown to act as an eQTL for STAT3 (at the mRNA level) in skeletal muscle and tibial artery [38]. Rs1026916 lies within a region with moderately high histone H3 acetylation levels, but outside DNAse clusters and transcription factor binding sites [39]. Whether this SNP affects transcription factor binding and thereby regulates transcription remains to be analyzed. Our study further suggests a functional implication of this SNP or a SNP tagged by rs1026916 in T cells. Neither rs6672420 nor rs9992731 are reported to act as an eQTLs [38]. However, the correlation between mRNA and protein copy numbers can vary widely [18, 19] and this study suggests that these SNPs could act as pQTLs in T cells. In contrast to rs9992731 that is not situated in any typical gene-regulatory region, in silico analyses suggests that rs6672420 might affect gene expression, as it is located in a region shown by chromatin immunoprecipitation to be bound by RNA polymerase 2 (POLR2A) and the STAT5A transcription factor [39]. Confirmatory studies in T cells need to be pursued in order to confirm the relationship between genotype at rs6672420, transcription factor occupancy and gene and protein expression of RUNX3. Altogether, the reported pQTLs suggests further exploration of LEF1, STAT3 and RUNX3 to understand the molecular pathways involved in disease with the ultimate goal to identify new therapeutic targets.
Conclusion
We show that there is a dysregulation at the protein level in T cells from RRMS patients at an early stage of disease. Pathway analyses, pinpoints to the importance of CD4+ T-cell specific activation pathway, which is indicative of an inflammatory condition. By specifically analyzing proteins expressed from MS susceptibility genes, eight proteins were found to be dysregulated in T cells from MS patients. In addition, we identified three novel pQTLs, which might contribute to mechanistically understand the molecular background of MS development and the biology behind three SNPs that have been identified as MS susceptibility gene variants through genome-wide screenings.
Additional files
Additional file 1: Table S1. Proteins from CD4+ T cells differentially expressed in MS patients and healthy controls. The table displays proteins (n = 228) that are differentially expressed in CD4+ T cells from MS patients compared to healthy controls (p < 0.05). For each protein, accession number, protein identity, gene name, log2-fold change in samples from MS versus HC, median log-2 transformed protein abundances with standard variation (SD), the percentage of sequence coverage (% sequence coverage) and number of peptides (# peptides), is given.
Additional file 2: Table S2. Proteins from CD8+ T cells differentially expressed in MS patients and healthy controls. The table displays proteins (n = 195) that are differentially expressed in CD8+ T cells from MS patients compared to healthy controls (p < 0.05). For each protein, accession number, protein identity, gene name, log2-fold change in samples from MS versus HC, median log-2 transformed protein abundances with standard variation (SD), the percentage of sequence coverage (% sequence coverage) and number of peptides (# peptides), is given.
Authors’ contributions
TB and FB conceived the idea and planned the study. PBH, EAH, HFH, TB, AE and ISB recruited patients and healthy controls. PBH, EAH and HFH performed clinical examination of the MS patients. TB, AE, SDB and ISB collected samples. AD and OM carried out mass spectrometry. AE, TB, SDB, AD, OM and FB analyzed and interpreted the data. TB wrote the manuscript. TB and AE prepared figures and tables. All authors read and approved the final manuscript.
Acknowledgements
We thank all patients and healthy controls for participation and research nurses involved in the collection of samples included in the study.
Competing interests
The authors declare that they have no competing interests.
Availability of data and materials
MS raw files have been uploaded into the Proteomics IDEntifications (PRIDE) database [40].
Consent for publication
Not applicable.
Ethics approval and consent to participate
The Regional Committee for Medical and Health Research Ethics South East, Norway approved the study. All study participants received oral and written information and written informed consent was obtained from all study participants.
Funding
The study was funded by the South Eastern Norway Regional Health Authority (Grant No. 2017114), the Norwegian Research Council (Grant No. 240102), OsloMet – Oslo Metropolitan University, Biogen, Sanofi Genzyme and the Odd Fellow Society. The founders had no role in the design of the study and collection, analysis, decision to publish, interpretation of data or preparation of the manuscript.
Publisher’s Note
Springer Nature remains neutral with regard to jurisdictional claims in published maps and institutional affiliations.
Abbreviations
- MS
multiple sclerosis
- RRMS
relapsing remitting MS
- HC
healthy control
- SNP
single nucleotide polymorphism
- CNS
central nervous system
- EDSS
extended disability status scale
- eQTL
expression quantitative trait locus
- pQTL
protein quantitative trait locus
- PCA
principal component analyses
- LFQ
label-free quantification
Contributor Information
Tone Berge, Email: tone.berge@oslomet.no.
Anna Eriksson, Email: anna.eriksson@medisin.uio.no.
Ina Skaara Brorson, Email: i.s.brorson@medisin.uio.no.
Einar August Høgestøl, Email: einar.august@gmail.com.
Pål Berg-Hansen, Email: pberghansen@gmail.com.
Anne Døskeland, Email: anne-doskeland@uib.no.
Olav Mjaavatten, Email: olav.mjaavatten@uib.no.
Steffan Daniel Bos, Email: s.d.bos@medisin.uio.no.
Hanne F. Harbo, Email: h.f.harbo@medisin.uio.no
Frode Berven, Email: frode.berven@uib.no.
References
- 1.Alonso A, Hernan MA. Temporal trends in the incidence of multiple sclerosis: a systematic review. Neurology. 2008;71(2):129–135. doi: 10.1212/01.wnl.0000316802.35974.34. [DOI] [PMC free article] [PubMed] [Google Scholar]
- 2.Chitnis T. The role of CD4 T cells in the pathogenesis of multiple sclerosis. Int Rev Neurobiol. 2007;79:43–72. doi: 10.1016/S0074-7742(07)79003-7. [DOI] [PMC free article] [PubMed] [Google Scholar]
- 3.Friese MA, Fugger L. Pathogenic CD8(+) T cells in multiple sclerosis. Ann Neurol. 2009;66(2):132–141. doi: 10.1002/ana.21744. [DOI] [PubMed] [Google Scholar]
- 4.International Multiple Sclerosis Genetics C. Beecham AH, Patsopoulos NA, Xifara DK, Davis MF, Kemppinen A, et al. Analysis of immune-related loci identifies 48 new susceptibility variants for multiple sclerosis. Nat Genet. 2013;45(11):1353–1360. doi: 10.1038/ng.2770. [DOI] [PMC free article] [PubMed] [Google Scholar]
- 5.International Multiple Sclerosis Genetics C, Wellcome Trust Case Control C. Sawcer S, Hellenthal G, Pirinen M, Spencer CC, et al. Genetic risk and a primary role for cell-mediated immune mechanisms in multiple sclerosis. Nature. 2011;476(7359):214–219. doi: 10.1038/nature10251. [DOI] [PMC free article] [PubMed] [Google Scholar]
- 6.Patsopoulos NA. Genetics of multiple sclerosis: an overview and new directions. Cold Spring Harb Perspect Med. 2018;8(7):a028951. doi: 10.1101/cshperspect.a028951. [DOI] [PMC free article] [PubMed] [Google Scholar]
- 7.Zheleznyakova GY, Piket E, Marabita F, Pahlevan Kakhki M, Ewing E, Ruhrmann S, et al. Epigenetic research in multiple sclerosis: progress, challenges, and opportunities. Physiol Genom. 2017;49(9):447–461. doi: 10.1152/physiolgenomics.00060.2017. [DOI] [PubMed] [Google Scholar]
- 8.Baranzini SE, Mudge J, van Velkinburgh JC, Khankhanian P, Khrebtukova I, Miller NA, et al. Genome, epigenome and RNA sequences of monozygotic twins discordant for multiple sclerosis. Nature. 2010;464(7293):1351–1356. doi: 10.1038/nature08990. [DOI] [PMC free article] [PubMed] [Google Scholar]
- 9.Bos SD, Page CM, Andreassen BK, Elboudwarej E, Gustavsen MW, Briggs F, et al. Genome-wide DNA methylation profiles indicate CD8+ T cell hypermethylation in multiple sclerosis. PLoS ONE. 2015;10(3):e0117403. doi: 10.1371/journal.pone.0117403. [DOI] [PMC free article] [PubMed] [Google Scholar]
- 10.Graves MC, Benton M, Lea RA, Boyle M, Tajouri L, Macartney-Coxson D, et al. Methylation differences at the HLA-DRB1 locus in CD4+ T-cells are associated with multiple sclerosis. Mult Scler. 2014;20(8):1033–1041. doi: 10.1177/1352458513516529. [DOI] [PubMed] [Google Scholar]
- 11.Maltby VE, Graves MC, Lea RA, Benton MC, Sanders KA, Tajouri L, et al. Genome-wide DNA methylation profiling of CD8+ T cells shows a distinct epigenetic signature to CD4+ T cells in multiple sclerosis patients. Clin Epigenet. 2015;7:118. doi: 10.1186/s13148-015-0152-7. [DOI] [PMC free article] [PubMed] [Google Scholar]
- 12.Rhead B, Brorson IS, Berge T, Adams C, Quach H, Moen SM, et al. Increased DNA methylation of SLFN12 in CD4+ and CD8+ T cells from multiple sclerosis patients. PLoS ONE. 2018;13(10):e0206511. doi: 10.1371/journal.pone.0206511. [DOI] [PMC free article] [PubMed] [Google Scholar]
- 13.Kular L, Liu Y, Ruhrmann S, Zheleznyakova G, Marabita F, Gomez-Cabrero D, et al. DNA methylation as a mediator of HLA-DRB1*15:01 and a protective variant in multiple sclerosis. Nat Commun. 2018;9(1):2397. doi: 10.1038/s41467-018-04732-5. [DOI] [PMC free article] [PubMed] [Google Scholar]
- 14.Gandhi KS, McKay FC, Cox M, Riveros C, Armstrong N, Heard RN, et al. The multiple sclerosis whole blood mRNA transcriptome and genetic associations indicate dysregulation of specific T cell pathways in pathogenesis. Hum Mol Genet. 2010;19(11):2134–2143. doi: 10.1093/hmg/ddq090. [DOI] [PubMed] [Google Scholar]
- 15.Ramanathan M, Weinstock-Guttman B, Nguyen LT, Badgett D, Miller C, Patrick K, et al. In vivo gene expression revealed by cDNA arrays: the pattern in relapsing–remitting multiple sclerosis patients compared with normal subjects. J Neuroimmunol. 2001;116(2):213–219. doi: 10.1016/S0165-5728(01)00308-3. [DOI] [PubMed] [Google Scholar]
- 16.Ruhrmann S, Ewing E, Piket E, Kular L, Cetrulo Lorenzi JC, Fernandes SJ, et al. Hypermethylation of MIR21 in CD4+ T cells from patients with relapsing–remitting multiple sclerosis associates with lower miRNA-21 levels and concomitant up-regulation of its target genes. Mult Scler. 2017;24:1288. doi: 10.1177/1352458517721356. [DOI] [PMC free article] [PubMed] [Google Scholar]
- 17.Davies JL, Thompson S, Kaur-Sandhu H, Sawcer S, Coles A, Ban M, et al. Increased THEMIS first exon usage in CD4+ T-cells is associated with a genotype that is protective against multiple sclerosis. PLoS ONE. 2016;11(7):e0158327. doi: 10.1371/journal.pone.0158327. [DOI] [PMC free article] [PubMed] [Google Scholar]
- 18.Payne SH. The utility of protein and mRNA correlation. Trends Biochem Sci. 2015;40(1):1–3. doi: 10.1016/j.tibs.2014.10.010. [DOI] [PMC free article] [PubMed] [Google Scholar]
- 19.Schwanhausser B, Busse D, Li N, Dittmar G, Schuchhardt J, Wolf J, et al. Corrigendum: global quantification of mammalian gene expression control. Nature. 2013;495(7439):126–127. doi: 10.1038/nature11848. [DOI] [PubMed] [Google Scholar]
- 20.International Multiple Sclerosis Genetics Consorti NP, Sergio E. Baranzin et al.,. The multiple sclerosis genomic map: role of peripheral immune cells and resident microglia in susceptibility. bioRxiv.org 2017.
- 21.Maurano MT, Humbert R, Rynes E, Thurman RE, Haugen E, Wang H, et al. Systematic localization of common disease-associated variation in regulatory DNA. Science. 2012;337(6099):1190–1195. doi: 10.1126/science.1222794. [DOI] [PMC free article] [PubMed] [Google Scholar]
- 22.Lappalainen T, Sammeth M, Friedlander MR, t Hoen PA, Monlong J, Rivas MA, et al. Transcriptome and genome sequencing uncovers functional variation in humans. Nature. 2013;501(7468):506–511. doi: 10.1038/nature12531. [DOI] [PMC free article] [PubMed] [Google Scholar]
- 23.James T, Linden M, Morikawa H, Fernandes SJ, Ruhrmann S, Huss M, et al. Impact of genetic risk loci for multiple sclerosis on expression of proximal genes in patients. Hum Mol Genet. 2018;27(5):912–928. doi: 10.1093/hmg/ddy001. [DOI] [PubMed] [Google Scholar]
- 24.Polman CH, Reingold SC, Banwell B, Clanet M, Cohen JA, Filippi M, et al. Diagnostic criteria for multiple sclerosis: 2010 revisions to the McDonald criteria. Ann Neurol. 2011;69(2):292–302. doi: 10.1002/ana.22366. [DOI] [PMC free article] [PubMed] [Google Scholar]
- 25.Wisniewski JR, Zougman A, Nagaraj N, Mann M. Universal sample preparation method for proteome analysis. Nat Methods. 2009;6(5):359–362. doi: 10.1038/nmeth.1322. [DOI] [PubMed] [Google Scholar]
- 26.Hernandez-Valladares M, Aasebo E, Mjaavatten O, Vaudel M, Bruserud O, Berven F, et al. Reliable FASP-based procedures for optimal quantitative proteomic and phosphoproteomic analysis on samples from acute myeloid leukemia patients. Biol Proced Online. 2016;18:13. doi: 10.1186/s12575-016-0043-0. [DOI] [PMC free article] [PubMed] [Google Scholar]
- 27.Bjorlykke Y, Vethe H, Vaudel M, Barsnes H, Berven FS, Tjora E, et al. Carboxyl-ester lipase maturity-onset diabetes of the young disease protein biomarkers in secretin-stimulated duodenal juice. J Proteome Res. 2015;14(1):521–530. doi: 10.1021/pr500750z. [DOI] [PubMed] [Google Scholar]
- 28.Cox J, Mann M. MaxQuant enables high peptide identification rates, individualized ppb-range mass accuracies and proteome-wide protein quantification. Nat Biotechnol. 2008;26(12):1367–1372. doi: 10.1038/nbt.1511. [DOI] [PubMed] [Google Scholar]
- 29.Cox J, Hein MY, Luber CA, Paron I, Nagaraj N, Mann M. Accurate proteome-wide label-free quantification by delayed normalization and maximal peptide ratio extraction, termed MaxLFQ. MCP. 2014;13(9):2513–2526. doi: 10.1074/mcp.M113.031591. [DOI] [PMC free article] [PubMed] [Google Scholar]
- 30.Farh KK, Marson A, Zhu J, Kleinewietfeld M, Housley WJ, Beik S, et al. Genetic and epigenetic fine mapping of causal autoimmune disease variants. Nature. 2015;518(7539):337–343. doi: 10.1038/nature13835. [DOI] [PMC free article] [PubMed] [Google Scholar]
- 31.Benedek G, Meza-Romero R, Jordan K, Zhang Y, Nguyen H, Kent G, et al. MIF and D-DT are potential disease severity modifiers in male MS subjects. Proc Natl Acad Sci USA. 2017;114(40):E8421–E8429. doi: 10.1073/pnas.1712288114. [DOI] [PMC free article] [PubMed] [Google Scholar]
- 32.Fagone P, Mazzon E, Cavalli E, Bramanti A, Petralia MC, Mangano K, et al. Contribution of the macrophage migration inhibitory factor superfamily of cytokines in the pathogenesis of preclinical and human multiple sclerosis: in silico and in vivo evidences. J Neuroimmunol. 2018;322:46–56. doi: 10.1016/j.jneuroim.2018.06.009. [DOI] [PubMed] [Google Scholar]
- 33.McKenzie BA, Mamik MK, Saito LB, Boghozian R, Monaco MC, Major EO, et al. Caspase-1 inhibition prevents glial inflammasome activation and pyroptosis in models of multiple sclerosis. Proc Natl Acad Sci USA. 2018;115(26):E6065–E6074. doi: 10.1073/pnas.1722041115. [DOI] [PMC free article] [PubMed] [Google Scholar]
- 34.Goutman SA, Chen KS, Paez-Colasante X, Feldman EL. Emerging understanding of the genotype-phenotype relationship in amyotrophic lateral sclerosis. Handb Clin Neurol. 2018;148:603–623. doi: 10.1016/B978-0-444-64076-5.00039-9. [DOI] [PubMed] [Google Scholar]
- 35.Latourelle JC, Pankratz N, Dumitriu A, Wilk JB, Goldwurm S, Pezzoli G, et al. Genomewide association study for onset age in Parkinson disease. BMC Med Genet. 2009;10:98. doi: 10.1186/1471-2350-10-98. [DOI] [PMC free article] [PubMed] [Google Scholar]
- 36.Montibeller L, de Belleroche J. Amyotrophic lateral sclerosis (ALS) and Alzheimer’s disease (AD) are characterised by differential activation of ER stress pathways: focus on UPR target genes. Cell Stress Chaperon. 2018;23:897. doi: 10.1007/s12192-018-0897-y. [DOI] [PMC free article] [PubMed] [Google Scholar]
- 37.Rayaprolu S, Fujioka S, Traynor S, Soto-Ortolaza AI, Petrucelli L, Dickson DW, et al. TARDBP mutations in Parkinson’s disease. Parkinsonism Relat Disord. 2013;19(3):312–315. doi: 10.1016/j.parkreldis.2012.11.003. [DOI] [PMC free article] [PubMed] [Google Scholar]
- 38.The GTEx Portal. https://www.gtexportal.org/. Accessed 08 Nov 2018.
- 39.The Genome Browser. http://genome.ucsc.edu. Accessed 08 November 2018.
- 40.Vizcaino JA, Csordas A, del-Toro N, Dianes JA, Griss J, Lavidas I, et al. 2016 update of the PRIDE database and its related tools. Nucleic Acids Res. 2016;44(D1):D447–D456. doi: 10.1093/nar/gkv1145. [DOI] [PMC free article] [PubMed] [Google Scholar]
Associated Data
This section collects any data citations, data availability statements, or supplementary materials included in this article.
Supplementary Materials
Additional file 1: Table S1. Proteins from CD4+ T cells differentially expressed in MS patients and healthy controls. The table displays proteins (n = 228) that are differentially expressed in CD4+ T cells from MS patients compared to healthy controls (p < 0.05). For each protein, accession number, protein identity, gene name, log2-fold change in samples from MS versus HC, median log-2 transformed protein abundances with standard variation (SD), the percentage of sequence coverage (% sequence coverage) and number of peptides (# peptides), is given.
Additional file 2: Table S2. Proteins from CD8+ T cells differentially expressed in MS patients and healthy controls. The table displays proteins (n = 195) that are differentially expressed in CD8+ T cells from MS patients compared to healthy controls (p < 0.05). For each protein, accession number, protein identity, gene name, log2-fold change in samples from MS versus HC, median log-2 transformed protein abundances with standard variation (SD), the percentage of sequence coverage (% sequence coverage) and number of peptides (# peptides), is given.
Data Availability Statement
MS raw files have been uploaded into the Proteomics IDEntifications (PRIDE) database [40].