

Abstract
The liver is the predominant organ of metabolism for many endogenous and foreign chemicals. Cytosolic sulfotransferases (SULTs) catalyze the sulfonation of drugs and other xenobiotics, as well as hormones, neurotransmitters, and sterols, with consequences that include enhanced drug elimination, hormone inactivation, and procarcinogen bioactivation. SULTs are classified into six gene families, but only SULT1 and SULT2 enzymes are expressed in human liver. We characterized the developmental expression patterns of SULT1 and SULT2 mRNAs and proteins in human liver samples using reverse transcription quantitative polymerase chain reaction (RT-qPCR), RNA sequencing, and targeted quantitative proteomics. Using a set of prenatal, infant, and adult liver specimens, RT-qPCR analysis demonstrated that SULT1A1 (transcript variant 1) expression did not vary appreciably during development; SULT1C2, 1C4, and 1E1 mRNA levels were highest in prenatal and/or infant liver, and 1A2, 1B1, and 2A1 mRNA levels were highest in infant and/or adult. Hepatic SULT1A1 (transcript variant 5), 1C3, and 2B1 mRNA levels were low regardless of developmental stage. Results obtained with RNA sequencing of a different set of liver specimens (prenatal and pediatric) were generally comparable results to those of the RT-qPCR analysis, with the additional finding that SULT1A3 expression was highest during gestation. Analysis of SULT protein content in a library of human liver cytosols demonstrated that protein levels generally corresponded to the mRNAs, with the major exception that SULT1C4 protein levels were much lower than expected based on mRNA levels. These findings further support the concept that hepatic SULTs play important metabolic roles throughout the human life course, including early development.
Introduction
Experimental and epidemiologic studies increasingly indicate that early life exposures to environmental stressors can increase a person’s risk for developing diseases, such as cancer and metabolic syndrome, later in life (Murray et al., 2007; Drake et al., 2010; La Merrill et al., 2013; Merlo et al., 2014; Shen et al., 2014). The vulnerability of a developing fetus to the adverse effects of xenobiotic exposures is modulated by the defense systems that are present in mother and child. It is well known that xenobiotic-metabolizing enzymes and transporters undergo temporal changes in expression during development, and three major patterns of hepatic expression have been described: 1) class I, where expression is highest in prenatal liver; 2) class II, where expression is relatively constant from prenatal to adult life; and 3) class III, where expression is highest in adult liver (Hines, 2013).
The cytosolic sulfotransferases (SULTs) are xenobiotic-metabolizing enzymes that add a sulfonate moiety to a suitable functional group on a substrate molecule. These conjugation reactions protect against toxicity produced by certain chemicals, such as acetaminophen (Reiter and Weinshilboum, 1982; Yamamoto et al., 2015), as well as activate some prodrugs, such as minoxidil (Falany and Kerl, 1990). SULTs also regulate physiologic processes by sulfonating endogenous molecules, thereby modulating their biologic activities. For example, several SULTs, including SULT1A1, SULT1B1, SULT1C2, and SULT1E1, can metabolize various forms of thyroid hormone, which regulates multiple metabolic pathways (Wang et al., 1998; Kester et al., 1999; Li et al., 2000). Another consequence of sulfonation is bioactivation of certain procarcinogens, such as N-hydroxylated arylamines and heterocyclic amines (Chou et al., 1995).
SULTs are expressed in hepatic and extra-hepatic tissues throughout development. In a study quantifying the levels of five major SULT proteins in human tissues, Riches et al. (2009) reported that SULT1A1, SULT2A1, and SULT1B1 are the most abundant SULTs in adult human liver, while SULT1E1 is present and SULT1A3 is not detectable. Using a panel of 235 human liver cytosols prepared from donors ranging in age from early gestation to 18 years, we previously reported that SULT1E1, 1A1, and 2A1 proteins are expressed with class I, II, and III developmental patterns, respectively (Duanmu et al., 2006). Additional evidence indicates that SULT1A3 and SULT1C subfamily members are also preferentially expressed in fetal liver (Cappiello et al., 1991; Her et al., 1997; Sakakibara et al., 1998; Richard et al., 2001; Stanley et al., 2005). These findings suggest that several SULT enzymes are poised to play important roles in hepatic metabolism during prenatal life.
Interspecies variation in the expression of xenobiotic-metabolizing enzymes has been well documented (DeKeyser and Shou, 2012). Marked differences in SULT sequence, expression, and regulation have been reported in multiple studies. For example, while human SULT1C2 shares greater than 90% sequence similarity with its apparent mouse, rat, and rabbit counterparts, human SULT1C3 and SULT1C4 share less than 80% amino acid sequence similarity with any of the known SULT1C proteins in the three animal species (Runge-Morris and Kocarek, 2013). Interspecies differences in SULT sequences are reflected in differences in the orthologs’ substrate specificities. This is exemplified by SULT1A1, where human SULT1A1 and its presumed mouse, rat, and rabbit orthologs share 79%–85% amino acid sequence similarity and a preference for sulfonation of phenolic substrates. However, human SULT1A1 has much higher activity than the animal enzymes toward troglitazone and 2-amino-4′-hydroxy-1-methyl-6-phenylimidazo[4,5-b]pyridine (Honma et al., 2001). As an interspecies difference in regulation, we previously reported that activation of peroxisome proliferator-activated receptor α increased expression of SULT2A1 in primary cultured human but not rat hepatocytes (Fang et al., 2005). Considering these interspecies differences, it is important to include the use of human biospecimens and cellular models when studying the expression and function of SULTs.
Studies examining SULT activity in human liver cytosols have demonstrated that SULTs are enzymatically active during development, and therefore likely play important roles in modifying hormone activities and detoxifying drugs and other xenobiotics (Richard et al., 2001; Stanley et al., 2005). To gain more insight into the role of SULTs during development, we characterized the expression patterns of these enzymes at the RNA and protein levels using human liver specimens and cytosols from different life stages. To achieve a high level of rigor in our assessment, we evaluated SULT expression in three independent sets of human liver specimens using three different methods of measurement, two for mRNA and one for protein.
Materials and Methods
Materials.
Human prenatal (18 to 19 weeks of gestation, n = 10), infant (1–12 months old, n = 10), and adult (18–50 years old, n = 10) liver specimens analyzed by reverse transcription quantitative polymerase chain reaction (RT-qPCR) were obtained from the University of Maryland National Institute of Child Health and Human Development Brain and Tissue Bank for Developmental Disorders (National Institutes of Health Contract Number HHSN275200900011C, Reference Number N01-HD-9-0011). A separate set of prenatal (weeks 14–16, n = 10) and pediatric (0 days–17 years, n = 52) human liver specimens was analyzed by RNA sequencing (RNA-seq). The prenatal specimens were obtained from the Central Laboratory for Human Embryology at the University of Washington (Seattle, WA). The pediatric specimens were obtained from the National Institute of Child Health and Human Development Brain and Tissue Bank for Developmental Disorders and the Liver Tissue Cell Distribution System (National Institutes of Health Contract Number N01-DK-7-0004/HHSN267200700004C). In addition, six samples were generously provided by Xenotech, LLC (Kansas City, KS). All tissues were maintained at −80°C prior to use. The use of these tissues was reviewed and declared nonhuman subjects research by the University of Missouri-Kansas City Pediatric Health Sciences Review Board at Children’s Mercy Kansas City and the institutional review board at Wayne State University. Donor information (age, sex, and postmortem interval) for the human liver specimens is provided in Supplemental Tables 1 and 2.
The library of human liver cytosols used for measurement of SULT protein levels was previously described (Duanmu et al., 2006). One hundred ninety-three samples from this library were available for the current analysis. The cytosols were prepared from livers at different developmental stages, starting from week 8 of gestation until 18 years, and included prenatal samples from first trimester (n = 15), second trimester (n = 34), and third trimester (n = 13); infants (0 to 1 years old, n = 76); and children (1–18 years old, n = 55). The preparation of the subcellular fractions and donor information were previously described (Koukouritaki et al., 2002; McCarver et al., 2017).
RNA Isolation and Gene Expression Analysis.
For the samples analyzed by RT-qPCR, liver specimens were thawed on ice, and 30–50 mg pieces were dissected and homogenized in QIAzol Lysis Reagent using a TissueRuptor (Qiagen Inc., Germantown, MD). Total RNA was prepared using the RNeasy Plus Universal Mini Kit (Qiagen), and RNA quality was determined using a 2100 Bioanalyzer (Agilent Technologies, Santa Clara, CA). The RNA integrity number (RIN) was used to assess the quality of the RNA samples. All prenatal RNA samples had RIN values >8, whereas most of the infant and adult RNA samples had RIN values >5. Three infant and three adult liver specimens yielded RNA with RIN values <4. These samples were considered extensively degraded and were excluded from the analysis. RNA samples (3 µg) were reversed transcribed using the High Capacity cDNA Reverse Transcription Kit, according to the manufacturer’s instructions (Thermo Fisher Scientific, Waltham, MA). The levels of nine SULT transcripts, CYP3A4, and CYP3A7 were measured using the TaqMan Gene Expression Assays (Thermo Fisher Scientific) listed in Supplemental Table 3, 75 ng of cDNA, and a StepOnePlus Real-Time PCR System (Thermo Fisher Scientific). The assays were performed as described previously (Fang et al., 2007). The SULT or CYP3A4/7 mRNA level in each sample was first normalized to the corresponding 18S RNA level to calculate the Δ threshold cycle (ΔCt). The ΔCt values in the various samples were then normalized to the median ΔCt value of the prenatal group to calculate ΔΔCt. Relative mRNA levels were then calculated as 2−ΔΔCt (Livak and Schmittgen, 2001).
For the samples analyzed by RNA-seq, frozen liver specimens (20–30 mg) were homogenized and total RNA was extracted according to the RNeasy protocol (Qiagen) with on-column DNase I treatment. The quality of the isolated RNA was assessed using an Experion Automated Electrophoresis Station (Bio-Rad, Hercules, CA) and evaluated by the RNA quality indicator (RQI) value. All samples analyzed by RNA-seq had RQI values >4.9, with 39 (out of 62) samples having RQI values >8. Libraries were then prepared from 1 µg total RNA of each sample using the TruSeq Stranded Total RNA Sample Prep Kit (Illumina, San Diego, CA). Paired-end sequencing (2 × 101 base pairs) of high-output run mode was performed using the HiSeq1500 instrument (Illumina). The resulting base calling files were converted to FASTQ files and trimmed RNA-seq reads were mapped to the human genome (GRCh37/hg19). Transcript assembly and abundance estimation were conducted using the Tuxedo Suite pipeline and reported in transcripts per kilobase of exon per million fragments mapped (i.e., transcripts per million). The transcripts per million values were log transformed and differences in mRNA expression were compared between age groups. Age groups were defined according to National Institute of Child Health and Human Development Pediatric Terminology and are presented as follows: prenatal samples, infants <1 year of age, children 1 to 2 years of age, children 2–5 years of age, children 6–11 years of age, and adolescents 12–17 years of age (Williams et al., 2012).
Targeted Quantitative Proteomics.
Protein concentrations of liver cytosols were estimated using the Pierce BCA Protein Assay Kit (Thermo Fisher Scientific). For each sample, 100 µg of protein was resolved on a 4%–12% bis(2-hydroxyethyl)iminotris(hydroxymethyl)methane/Tris gel (Thermo Fisher Scientific) in duplicate. The region between 30 and 40 kDa was excised and proteins were reduced, alkylated, and digested with Trypsin In-Gel. Peptides were eluted from the gel pieces and dried. Heavy proteotypic AQUA peptides with labels on C-terminal lysine or arginine residues for eight SULTs were purchased from Thermo Fisher Scientific, and aliquots were stored at −80°C as 10X stocks (40 fmol/µl). On the day of the assay, the dried samples were resuspended in 30 µl of 5% acetonitrile, 0.1% formic acid, and 0.005% trifluoroacetic acid buffer containing 120 fmol of each heavy peptide, and 5 µl was separated by C18 reverse phase chromatography using an Easy nLC-1000 (Thermo Fisher Scientific) and a 20-minute gradient that increased from 5% to 40% acetonitrile over 20 minutes at 300 nl/min. Peptides were analyzed with a TSQ Vantage triple quadrupole mass spectrometer (Thermo Fisher Scientific). Transition settings were optimized for collision energies and peak retention times. Analysis time for each peptide spanned over a 2-minute window during the 20-minute gradient. Instrument settings included full width at half maximum of 0.7 and cycle time of 1.2 seconds. Multiple reactions monitoring settings are shown in Supplemental Table 4.
Data were imported into Skyline (version 4.1.0; MacCoss Laboratory, University of Washington). Integrated peaks were manually validated and those with signal-to-noise ratios <3 were excluded. The areas under the curve (AUCs) for each transition peak were summed per peptide, and final calculations for absolute quantitation were obtained using the following equation:
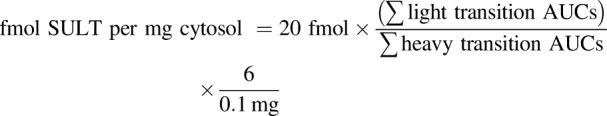 |
Samples were analyzed in duplicate; therefore, results represent the average of two samples. The limit of detection was determined as the lowest concentration of a standard curve where the transition ion ratios and coelution profiles of the unlabeled synthetic peptide were similar to that of the labeled synthetic peptide. Additionally, a signal-to-noise ratio ≥3 and a CV from triplicate measurements ≤25% were used. The calculated on-column limit of detection values for SULT1C2 and 1C4 were 500 and 600 amol, respectively, which would correspond to detection of 30 and 36 fmol per milligram of cytosolic protein. For the purposes of plotting data and performing statistical analyses, the level of a SULT protein in a sample with an undetectable level of that protein was given a value of 0.
Data Analysis.
Samples were grouped according to age, and scatter and box-and-whisker plots were prepared for the mRNA and protein data, respectively. Statistical comparisons among groups were performed using Kruskal-Wallis nonparametric ANOVA and Dunn’s multiple comparisons test, using Prism version 6 (GraphPad Software, La Jolla, CA).
Results
Developmental Expression of SULT mRNA in Human Liver.
There are currently few studies that evaluate the developmental expression profiles of SULT mRNAs at multiple times during the human life course. Therefore, we obtained specimens of pre- and postnatal human liver and characterized the developmental expression of SULT1 and SULT2 family genes using RT-qPCR and RNA-seq. While CYP3A7 is established as a gene that is preferentially expressed during fetal life, and remains detectable in many individuals until 2 years of age, CYP3A4 is known to be primarily expressed in postnatal liver (Lacroix et al., 1997; Stevens et al., 2003). Therefore, CYP3A7 and CYP3A4 mRNA levels were measured in our tissue sets to demonstrate that these expected patterns of expression were observed (Figs. 1 and 2).
Fig. 1.

SULT mRNA developmental expression profiles in human liver specimens analyzed by RT-qPCR. RNA was isolated from human liver specimens from prenatal, infant, and adult donors, and levels of SULT1A1 (TV1 or TV5), 1A2, 1B1, 1C2, 1C3, 1C4, 1E1, 2A1, and 2B1 were measured using TaqMan Gene Expression assays, as described in Materials and Methods. CYP3A4 and CYP3A7 mRNA levels were measured for comparison. The median Ct value for each transcript and developmental stage is shown as an estimation of abundance. For each transcript, data are normalized to the median mRNA level (Ct value) in the prenatal group and presented as scatter plots, with the horizontal lines representing the median values (significantly different; *P < 0.05; **P < 0.01; ***P < 0.001).
Fig. 2.

SULT mRNA developmental expression profiles in human liver specimens analyzed by RNA-seq. RNA-seq was performed on human liver specimens from prenatal and pediatric donors (divided into the following groups: infants, 1 to 2 years old, 2–5 years old, 6–11 years old, and 12–17 years old), and the transcripts per million values for SULT1A1 (TV1/2, TV3/4, or TV5), 1A2, 1A3, 1B1, 1C2, 1C3, 1C4, 1E1, 2A1, and 2B1 and CYP3A4 and 3A7 were determined as described in Materials and Methods. For each transcript, data are normalized to the median mRNA level in the prenatal group and presented as scatter plots, with the horizontal lines representing the median values. Groups not sharing a letter are significantly different from each other (P < 0.05).
Figure 1 shows the levels of SULT mRNA in prenatal, infant, and adult liver, as measured by RT-qPCR. Based on the information about SULT1A1 transcript variants (TVs) published in GenBank (https://www.ncbi.nlm.nih.gov/gene/6817) (five reported TVs), SULT1A1 mRNA was measured using two different TaqMan Gene Expression Assays. The first was designed to detect TV1, reported to be the most abundant transcript that encodes isoform a, and the second detected TV5, which has a unique transcription start site that is located more than 10 kb upstream from that of TVs 1–4 and encodes isoform b. SULT1A1 (TV1), 1A2, 1B1, 1C2, 1C4, 1E1, and 2A1 mRNAs were readily detectable (as determined by Ct values <30) in at least one of the developmental stages, but SULT1A1 (TV5), 1C3, and 2B1 mRNAs were minimally present at all stages (Ct ≥ 33) (Fig. 1). Although the differences were not statistically significant, SULT1E1 showed a clear trend toward preferential expression in the prenatal specimens, while SULT2A1 expression was highest in the postnatal specimens, in agreement with our previous analysis of SULT1E1 and 2A1 immunoreactive protein in human liver cytosols (Duanmu et al., 2006). Nevertheless, SULT2A1 mRNA levels were relatively high in the prenatal specimens, as estimated by a median Ct value of 25.5, which was the third lowest (approximately the same as SULT1A1 TV1) after SULT1C4 and 1E1. Like SULT2A1, SULT1A2 mRNA levels were higher in the postnatal specimens than in the prenatal specimens, while for SULT1B1, mRNA levels were highest in the adult specimens. SULT1C2 and 1C4 were preferentially expressed in the prenatal and infant liver specimens. However, the SULT1C2 and SULT1C4 expression patterns were not identical since SULT1C2 mRNA content was highest in the infant livers, with a median level that was ∼3- and 310-fold higher than it was in the prenatal and adult specimens, respectively. By contrast, SULT1C4 mRNA content was highest in the prenatal specimens, with a median level that was ∼91- and ∼192-fold higher than it was in the infant and adult specimens, respectively.
A separate set of pre- and postnatal human liver specimens was analyzed by RNA-seq, and the relative SULT transcript levels from this data set were compared with the RT-qPCR findings. While both tissue sets included prenatal and infant liver specimens, the set used for RNA-seq included specimens from children ranging in age from 1 to 17 [evaluated as five age groups: infants (<1 year of age), and children 1 to 2, 2–5, 6–11, and 12–17 years of age] but did not include adult specimens. As for the RT-qPCR data, CYP3A7 and 3A4 displayed the expected patterns of predominantly prenatal and postnatal expression, respectively (Fig. 2). The SULT1A1, 1A2, 1C2, 1C4, 1E1, and 2A1 developmental expression profiles determined by RNA-seq (Fig. 2) were generally consistent with those observed by RT-qPCR (Fig. 1). SULT1A1 was expressed at a relatively constant level throughout development, with SULT1A1 TV1/2 being the most abundant transcripts (Supplemental Table 5); SULT1A2 expression did not vary significantly during development but showed a trend toward higher expression in the postnatal periods (particularly in infants and children ≥2 years old); SULT1C2, 1C4, and 1E1 mRNA levels were highest in the specimens from prenatal donors; and SULT2A1 expression increased after birth (Fig. 2; Supplemental Table 5). SULT1A1 TVs 3/4 and 5, 1C3, and 2B1 mRNA levels were low throughout development (Supplemental Table 5). SULT1B1 mRNA levels in prenatal liver specimens were not significantly different from those in infant liver, which is also consistent with the RT-qPCR data, but were higher than they were in the specimens from children ages 2–5 to 6–11. The higher SULT1B1 mRNA levels that were present in the adult liver specimens analyzed by RT-qPCR could not be confirmed since the tissue set analyzed by RNA-seq did not include adult specimens. SULT1A3 mRNA, which was not analyzed by RT-qPCR, was also detected in prenatal and postnatal liver by RNA-seq, with highest expression in specimens from prenatal donors, infants, and children 1 to 2 years old. Two differences between the tissue sets analyzed by RT-qPCR and RNA-seq were that SULT1B1 and 1C4 were the seventh and first most abundant transcripts in the prenatal samples in Fig. 1 (as estimated by Ct values) but were the second and seventh most abundant transcripts in prenatal samples in Supplemental Table 5 (as estimated by the transcripts per million values).
SULT Protein Developmental Expression in Human Liver.
Since gene expression at the mRNA level does not always reflect protein abundancy, we used targeted quantitative proteomics to measure the protein levels of SULT1A1, 1A2, 1A3, 1B1, 1C2, 1C4, 1E1, and 2A1 in human liver cytosols isolated from prenatal, infant (0–12 months old), and child (1 to 2, 2–5, 6–11, and 12–18 years old) donors. One-half of these SULTs (SULT1A1, 1C2, 1E1, and 2A1) were detected in at least 90% of the samples that were evaluated, while the others were detected in smaller percentages of the samples (11%–69%). Most SULT proteins were detected in the prenatal period, some as early as 9 to 10 weeks of gestation, and their prenatal levels were generally highest at the beginning of the second trimester (14–17 weeks) (Supplemental Fig. 1).
SULT1A1 was detected in all but two of the cytosols that were analyzed (both were prenatal samples) and was the most abundant SULT protein regardless of developmental stage (median levels of 1126–2681 fmol per milligram of cytosolic protein among the age brackets). SULT1A1 protein levels were relatively constant throughout the age groups that were evaluated, although the levels appeared to trend upward somewhat during later childhood (6–11 and 12–18 years) (Fig. 3).
Fig. 3.

SULT protein developmental expression profiles in human liver cytosols analyzed by targeted quantitative proteomics. SULT1A1, 1A2, 1A3, 1B1, 1C2, 1C4, 1E1, and 2A1 protein levels were measured by targeted quantitative proteomics in a library of 193 human liver cytosols from prenatal and pediatric donors (divided into the following groups: infants, 1 to 2 years old, 2–5 years old, 6–11 years old, and 12–18 years old). The data for each developmental stage are presented as box and whisker plots of femtomole SULT/mg cytosolic protein, where the whiskers indicate the fifth to 95th percentile. >LD indicates greater than the limit of detection = the number of samples in each group with detectable levels of SULT protein. Groups not sharing a letter are significantly different from each other (P < 0.05).
SULT1A2 was detected in most (69%) of the cytosols that were analyzed, with the frequency of detection ranging from 36% to 100% among the various age groups. The median levels of SULT1A2 protein were highest in the two oldest age groups (195 and 145 fmol/mg in children 6–11 and 12–18 years old, respectively).
SULT1A3 was detected in only 34% of the samples and was detected more frequently in samples from some of the earlier age groups [prenatal (60%) and children 1 to 2 years of age (100%), although not infant (16%)] than it was in samples from older children (13%–19%). The median level of SULT1A3 in the prenatal samples was 144 fmol/mg.
SULT1B1 was detected in a relatively small percentage of the samples that were analyzed (38%). The percentage of detection was especially low in the prenatal samples (21%). Detection then trended upward (except in children 2–5 years), from 36% of infant samples to 100% of children 1 to 2 years, and 56%–75% of children 6–18 years. The median level of SULT1B1 in children 12–18 years was 331 fmol/mg.
SULT1C2 was detected in 95% of the samples that were evaluated. The median levels of protein were significantly higher in the prenatal samples (61 fmol/mg) than they were in children 2–18 years. Unlike SULT1C2 protein, and unlike the findings for SULT1C4 mRNA, SULT1C4 protein was detected in a small percentage of the samples (11%). The largest percentage of detection of SULT1C4 protein occurred in specimens from prenatal donors and children 1 to 2 years (27% and 44%, respectively). The majority of SULT1C4 protein detected in the prenatal specimens was seen in the earliest ages that were evaluated (∼9–16 weeks) (Supplemental Fig. 3). No SULT1C4 protein was detected in children 2–18 years.
SULT1E1 was detected in all samples that were evaluated. SULT1E1 was the second most abundant SULT protein in prenatal liver cytosols (873 fmol/mg) and its levels were lower in the postnatal groups (104–185 fmol/mg).
SULT2A1 was detected in 90% of the samples and was detected at approximately this frequency in all age groups (79%–100%). The median levels of SULT2A1 in cytosols from prenatal donors and children 12–18 were 45 and 158 fmol/mg, respectively.
Discussion
Previous studies have demonstrated that xenobiotic-metabolizing enzymes are expressed during human development, as early as the first trimester of fetal life (Koukouritaki et al., 2002, 2004; Stevens et al., 2003; Duanmu et al., 2006). For example, flavin-containing monooxygenase 1 and SULT1E1 are detected in liver at 8 weeks of gestation (Koukouritaki et al., 2002; Duanmu et al., 2006). Many of these enzymes have dual roles in the regulation of endogenous processes as well as in protecting the developing human from exposures to drugs and environmental toxicants. However, some of the detoxification enzymes that are expressed during early development are capable of bioactivating procarcinogens and other xenobiotics, thereby increasing the risk of developmental disorders and diseases later in life. Therefore, identifying the enzymes that determine the xenobiotic-metabolizing capacity of the liver during development is important, both to understand the physiologic roles of these enzymes in human development and the risks that are associated with xenobiotic exposures during this critical life window of susceptibility.
To determine the developmental expression patterns of the major SULTs that have been detected in human liver, we used liver specimens that were mostly obtained from National Institutes of Health–supported repositories. It is known that human tissue RNA is susceptible to degradation due to postmortem processes as well as the handling and storage procedures that are used (Holland et al., 2003). Although some of the RNA samples we used for RT-qPCR were partially degraded, we do not believe that this negatively affected our results. Previous studies have indicated that the effect of RNA quality is minimal when: 1) Ct values are normalized to a reference gene, 2) PCR products are short (<200 base pairs), and 3) PCR reaction efficiency is high (Antonov et al., 2005; Fleige et al., 2006; Weis et al., 2007; González-Herrera et al., 2013). In this study, we used TaqMan Gene Expression Assays that produce relatively short amplicons (<200 base pairs) and have essentially 100% amplification efficiency, and we normalized mRNA levels to 18S RNA levels, which were relatively stable among the samples that were analyzed. As for the RNA-seq data, the RQI values and total reads did not significantly correlate, suggesting that partial degradation of some RNA samples did not adversely affect the analysis. Additionally, the expression profiles of most SULTs that were determined by RT-qPCR, RNA-seq, and mass spectrometry were qualitatively similar, suggesting that RNA quality did not affect our overall conclusions.
The RT-qPCR and RNA-seq data were generally consistent, although some discrepancies were noted, such as the previously described differences in SULT1B1 and 1C4 RNA abundance in the prenatal specimens that were determined by the two methods. To some extent, these discrepancies could reflect the small differences in developmental ages of the prenatal specimens in the two data sets, since the specimens analyzed by RNA-seq were from subjects at 14–16 weeks of gestation while those analyzed by RT-qPCR were from donors at 18 to 19 weeks of gestation. Differences could also reflect the nature of the two RNA quantification approaches, where one targets a specific region of a targeted transcript and the other assembles and aggregates counts of sequence reads that map onto the human genome.
We recently investigated SULT expression in two cell culture models of human hepatic development: primary cultures of fetal human hepatocytes and HepaRG cells as they passed through the stages of proliferation, confluency, and differentiation to hepatocyte-like cells (Dubaisi et al., 2018). The most abundant SULT mRNAs (as determined by RT-qPCR) in the primary cultured fetal human hepatocytes (in approximate order of abundancy) were SULT1C4 > 1E1 > 1A1 ≈ 2A1 > 1C2, which was the same order (as estimated by median Ct values) that was seen in the prenatal sample set analyzed by RT-qPCR (i.e., using the same assays). In the HepaRG model, SULT1B1, 1C2, 1C3, 1C4, and 1E1 mRNA levels were highest in confluent cells, with markedly reduced expression in differentiated cells. SULT1A1 and SULT2A1 mRNAs were also abundant in confluent cells, but SULT1A1 expression was relatively constant throughout the differentiation process, while SULT2A1 expression increased further with differentiation. These patterns of SULT expression are consistent with the idea that confluent HepaRG cells represent an early differentiation stage akin to fetal liver, while differentiated HepaRG cells represent a stage that is more like adult liver.
We also determined the profiles of SULT proteins during liver development using a library of human liver subcellular fractions that has been previously used by us and others to characterize the developmental expression profiles of xenobiotic-metabolizing enzymes, including flavin-containing monooxygenase 1 and 3 (Koukouritaki et al., 2002), CYP2C9 and 2C19 (Koukouritaki et al., 2004), CYP2E1 (Johnsrud et al., 2003), CYP3A (Stevens et al., 2003), and SULT1A1, 1E1, and 2A1 (Duanmu et al., 2006). These previous studies used western blot and enzymatic activity analyses to demonstrate that xenobiotic-metabolizing enzymes display three basic patterns of developmental expression (Hines, 2013), and that enzymes belonging to the same subfamily can have markedly different expression profiles.
In the current investigation, we used targeted quantitative proteomics to measure SULT protein contents. Mass spectrometry–based approaches have been used to detect and quantify enzymes and transporters involved in drug disposition (Gröer et al., 2014; Cieślak et al., 2016; Bhatt et al., 2019). As confirmation of the approach, SULT1A1, 1E1, and 2A1 were found to exhibit the same expression profiles that we previously reported when the liver cytosols were analyzed by western blot (Duanmu et al., 2006).
In contrast to our observations, Nowell et al. (2005) did not detect SULT1A2 protein in human hepatic or extra-hepatic normal tissue or tumor samples that were analyzed by western blot. SULT1A2 mRNA was previously detected by conventional RT-PCR in some tissues including liver (Zhu et al., 1996; Dooley et al., 2000), and it was suggested that SULT1A2 mRNA could not be translated into protein because of a splicing defect. However, two later studies did detect low levels of SULT1A2 protein in adult human liver (Meinl et al., 2006; Teubner et al., 2007).
In agreement with our analyses, previous studies demonstrated that SULT1A3 mRNA, protein, and enzymatic activity were detectable in fetal liver, but protein and activity were very low or undetectable in adult liver (Cappiello et al., 1991; Richard et al., 2001; Stanley et al., 2005; Riches et al., 2009), although SULT1A3 mRNA was reported to be detectable in adult liver (Wood et al., 1994; Dooley et al., 2000) and was observed by RNA-seq in the current study.
SULT1B1 mRNA and protein have been reported to be expressed at relatively high levels in adult human liver (Wang et al., 1998; Stanley et al., 2005; Meinl et al., 2006; Riches et al., 2009), and Stanley et al. (2005) detected SULT1B1 mRNA, but not protein, in fetal liver. In the current analysis, we determined that SULT1B1 protein levels increased during development. These findings were consistent with the observed SULT1B1 mRNA expression pattern obtained by RT-qPCR, but not RNA-seq. Unlike SULT1B1, SULT1C2 mRNA and protein were previously detected in fetal but not adult liver (Her et al., 1997; Stanley et al., 2005), consistent with the findings of the current analysis. One study did report detectable but very low levels of SULT1C2 mRNA in adult liver (Dooley et al., 2000).
The discrepancy between the SULT1C4 mRNA and protein abundance in the prenatal liver appears to be at least partially attributable to the expression of multiple SULT1C4 transcript variants, some of which do not give rise to stable protein (S. Dubaisi, H. Fang, R. Gaedigk, C. A. Vyhlidal, J. A. Caruso, T. A. Kocarek, and M. Runge-Morris, manuscript in preparation).
We previously reported that SULT1E1 protein levels were higher in cytosols from prenatal male than female livers (Duanmu et al., 2006). We did not detect a significant sex difference in prenatal expression of SULT1E1 in the current study, which might be attributable to the fact that 36 fewer cytosolic samples were available for analysis in the current study than were previously available. We also did not detect significant sex differences in the expression of any of the other SULTs. Therefore, the few differences in the patterns of SULT expression that we observed in the three tissue sets were probably not attributable to differences in the numbers of male and female samples that were included in the tissue sets.
The abundant expression of several SULTs in prenatal liver suggests that these enzymes play important roles in the regulation of key physiologic processes during human development. By controlling the amounts and activities of bioactive endogenous substrates, SULTs would protect developing individuals against developmental errors that could occur if these substrates were present in excess. For example, the preferential expression of SULT1A3, 1C2, and 1E1 in fetal and infant liver suggests that these SULTs are required to control the activities of catecholamines, thyroid hormones, and estrogens during early development (Dajani et al., 1999; Li et al., 2000; Adjei and Weinshilboum, 2002). At the same time, these SULTs are available to metabolize xenobiotics that pass through the placenta, thereby providing a defense system against toxic assault, or in some cases increasing the toxicity of the exposure. Further studies are needed to clarify the roles of the SULTs as determinants of health and disease during gestation and throughout the human life course.
Acknowledgments
The authors thank the University of Maryland Brain and Tissue Bank, the Central Laboratory for Human Embryology at the University of Washington, the Liver Tissue Cell Distribution System, and Xenotech LLC for providing the tissue specimens that made this study possible.
Abbreviations
- Ct
threshold cycle
- RIN
RNA integrity number
- RNA-seq
RNA sequencing
- RQI
RNA quality indicator
- RT-qPCR
reverse transcription quantitative polymerase chain reaction
- SULT
cytosolic sulfotransferase
- TV
transcript variant
Authorship Contributions
Participated in research design: Dubaisi, Gaedigk, Vyhlidal, Smith, Kocarek, Runge-Morris.
Conducted experiments: Dubaisi, Caruso, Gaedigk, Vyhlidal.
Contributed new reagents or analytic tools: Smith, Hines.
Performed data analysis: Dubaisi, Caruso, Vyhlidal, Kocarek.
Wrote or contributed to the writing of the manuscript: Dubaisi, Caruso, Vyhlidal, Smith, Hines, Kocarek, Runge-Morris.
Footnotes
This research was supported by the National Institutes of Health National Institute of Environmental Health Sciences [Grant R01 ES022606 (to M.R.-M.) and Center Grant P30 ES020957], National Institutes of Health National Cancer Institute [Cancer Center Support Grant P30 CA022453], and the National Institutes of Health Office of the Director [Shared Instrumentation Grant S10 OD 010700].
 This article has supplemental material available at dmd.aspetjournals.org.
References
- Adjei AA, Weinshilboum RM. (2002) Catecholestrogen sulfation: possible role in carcinogenesis. Biochem Biophys Res Commun 292:402–408. [DOI] [PubMed] [Google Scholar]
- Antonov J, Goldstein DR, Oberli A, Baltzer A, Pirotta M, Fleischmann A, Altermatt HJ, Jaggi R. (2005) Reliable gene expression measurements from degraded RNA by quantitative real-time PCR depend on short amplicons and a proper normalization. Lab Invest 85:1040–1050. [DOI] [PubMed] [Google Scholar]
- Bhatt DK, Mehrotra A, Gaedigk A, Chapa R, Basit A, Zhang H, Choudhari P, Boberg M, Pearce RE, Gaedigk R, et al. (2019) Age- and genotype-dependent variability in the protein abundance and activity of six major uridine diphosphate-glucuronosyltransferases in human liver. Clin Pharmacol Ther 105:131–141. [DOI] [PMC free article] [PubMed] [Google Scholar]
- Cappiello M, Giuliani L, Rane A, Pacifici GM. (1991) Dopamine sulphotransferase is better developed than p-nitrophenol sulphotransferase in the human fetus. Dev Pharmacol Ther 16:83–88. [PubMed] [Google Scholar]
- Chou HC, Lang NP, Kadlubar FF. (1995) Metabolic activation of N-hydroxy arylamines and N-hydroxy heterocyclic amines by human sulfotransferase(s). Cancer Res 55:525–529. [PubMed] [Google Scholar]
- Cieślak A, Kelly I, Trottier J, Verreault M, Wunsch E, Milkiewicz P, Poirier G, Droit A, Barbier O. (2016) Selective and sensitive quantification of the cytochrome P450 3A4 protein in human liver homogenates through multiple reaction monitoring mass spectrometry. Proteomics 16:2827–2837. [DOI] [PubMed] [Google Scholar]
- Dajani R, Cleasby A, Neu M, Wonacott AJ, Jhoti H, Hood AM, Modi S, Hersey A, Taskinen J, Cooke RM, et al. (1999) X-ray crystal structure of human dopamine sulfotransferase, SULT1A3. Molecular modeling and quantitative structure-activity relationship analysis demonstrate a molecular basis for sulfotransferase substrate specificity. J Biol Chem 274:37862–37868. [DOI] [PubMed] [Google Scholar]
- DeKeyser J, Shou M. (2012) Species differences of drug‐metabolizing enzymes, in Encyclopedia of Drug Metabolism and Interactions (Lyubimov AV. ed) pp 1–38, John Wiley & Sons, Inc, Hoboken, NJ. [Google Scholar]
- Dooley TP, Haldeman-Cahill R, Joiner J, Wilborn TW. (2000) Expression profiling of human sulfotransferase and sulfatase gene superfamilies in epithelial tissues and cultured cells. Biochem Biophys Res Commun 277:236–245. [DOI] [PubMed] [Google Scholar]
- Drake AJ, Raubenheimer PJ, Kerrigan D, McInnes KJ, Seckl JR, Walker BR. (2010) Prenatal dexamethasone programs expression of genes in liver and adipose tissue and increased hepatic lipid accumulation but not obesity on a high-fat diet. Endocrinology 151:1581–1587. [DOI] [PubMed] [Google Scholar]
- Duanmu Z, Weckle A, Koukouritaki SB, Hines RN, Falany JL, Falany CN, Kocarek TA, Runge-Morris M. (2006) Developmental expression of aryl, estrogen, and hydroxysteroid sulfotransferases in pre- and postnatal human liver. J Pharmacol Exp Ther 316:1310–1317. [DOI] [PubMed] [Google Scholar]
- Dubaisi S, Barrett KG, Fang H, Guzman-Lepe J, Soto-Gutierrez A, Kocarek TA, Runge-Morris M. (2018) Regulation of cytosolic sulfotransferases in models of human hepatocyte development. Drug Metab Dispos 46:1146–1156. [DOI] [PMC free article] [PubMed] [Google Scholar]
- Falany CN, Kerl EA. (1990) Sulfation of minoxidil by human liver phenol sulfotransferase. Biochem Pharmacol 40:1027–1032. [DOI] [PubMed] [Google Scholar]
- Fang HL, Strom SC, Cai H, Falany CN, Kocarek TA, Runge-Morris M. (2005) Regulation of human hepatic hydroxysteroid sulfotransferase gene expression by the peroxisome proliferator-activated receptor alpha transcription factor. Mol Pharmacol 67:1257–1267. [DOI] [PubMed] [Google Scholar]
- Fang HL, Strom SC, Ellis E, Duanmu Z, Fu J, Duniec-Dmuchowski Z, Falany CN, Falany JL, Kocarek TA, Runge-Morris M. (2007) Positive and negative regulation of human hepatic hydroxysteroid sulfotransferase (SULT2A1) gene transcription by rifampicin: roles of hepatocyte nuclear factor 4α and pregnane X receptor. J Pharmacol Exp Ther 323:586–598. [DOI] [PubMed] [Google Scholar]
- Fleige S, Walf V, Huch S, Prgomet C, Sehm J, Pfaffl MW. (2006) Comparison of relative mRNA quantification models and the impact of RNA integrity in quantitative real-time RT-PCR. Biotechnol Lett 28:1601–1613. [DOI] [PubMed] [Google Scholar]
- González-Herrera L, Valenzuela A, Marchal JA, Lorente JA, Villanueva E. (2013) Studies on RNA integrity and gene expression in human myocardial tissue, pericardial fluid and blood, and its postmortem stability. Forensic Sci Int 232:218–228. [DOI] [PubMed] [Google Scholar]
- Gröer C, Busch D, Patrzyk M, Beyer K, Busemann A, Heidecke CD, Drozdzik M, Siegmund W, Oswald S. (2014) Absolute protein quantification of clinically relevant cytochrome P450 enzymes and UDP-glucuronosyltransferases by mass spectrometry-based targeted proteomics. J Pharm Biomed Anal 100:393–401. [DOI] [PubMed] [Google Scholar]
- Her C, Kaur GP, Athwal RS, Weinshilboum RM. (1997) Human sulfotransferase SULT1C1: cDNA cloning, tissue-specific expression, and chromosomal localization. Genomics 41:467–470. [DOI] [PubMed] [Google Scholar]
- Hines RN. (2013) Developmental expression of drug metabolizing enzymes: impact on disposition in neonates and young children. Int J Pharm 452:3–7. [DOI] [PubMed] [Google Scholar]
- Holland NT, Smith MT, Eskenazi B, Bastaki M. (2003) Biological sample collection and processing for molecular epidemiological studies. Mutat Res 543:217–234. [DOI] [PubMed] [Google Scholar]
- Honma W, Kamiyama Y, Yoshinari K, Sasano H, Shimada M, Nagata K, Yamazoe Y. (2001) Enzymatic characterization and interspecies difference of phenol sulfotransferases, ST1A forms. Drug Metab Dispos 29:274–281. [PubMed] [Google Scholar]
- Johnsrud EK, Koukouritaki SB, Divakaran K, Brunengraber LL, Hines RN, McCarver DG. (2003) Human hepatic CYP2E1 expression during development. J Pharmacol Exp Ther 307:402–407. [DOI] [PubMed] [Google Scholar]
- Kester MH, Kaptein E, Roest TJ, van Dijk CH, Tibboel D, Meinl W, Glatt H, Coughtrie MW, Visser TJ. (1999) Characterization of human iodothyronine sulfotransferases. J Clin Endocrinol Metab 84:1357–1364. [DOI] [PubMed] [Google Scholar]
- Koukouritaki SB, Manro JR, Marsh SA, Stevens JC, Rettie AE, McCarver DG, Hines RN. (2004) Developmental expression of human hepatic CYP2C9 and CYP2C19. J Pharmacol Exp Ther 308:965–974. [DOI] [PubMed] [Google Scholar]
- Koukouritaki SB, Simpson P, Yeung CK, Rettie AE, Hines RN. (2002) Human hepatic flavin-containing monooxygenases 1 (FMO1) and 3 (FMO3) developmental expression. Pediatr Res 51:236–243. [DOI] [PubMed] [Google Scholar]
- Lacroix D, Sonnier M, Moncion A, Cheron G, Cresteil T. (1997) Expression of CYP3A in the human liver—evidence that the shift between CYP3A7 and CYP3A4 occurs immediately after birth. Eur J Biochem 247:625–634. [DOI] [PubMed] [Google Scholar]
- La Merrill M, Cirillo PM, Terry MB, Krigbaum NY, Flom JD, Cohn BA. (2013) Prenatal exposure to the pesticide DDT and hypertension diagnosed in women before age 50: a longitudinal birth cohort study. Environ Health Perspect 121:594–599. [DOI] [PMC free article] [PubMed] [Google Scholar]
- Li X, Clemens DL, Anderson RJ. (2000) Sulfation of iodothyronines by human sulfotransferase 1C1 (SULT1C1). Biochem Pharmacol 60:1713–1716. [DOI] [PubMed] [Google Scholar]
- Livak KJ, Schmittgen TD. (2001) Analysis of relative gene expression data using real-time quantitative PCR and the 2−ΔΔCT method. Methods 25:402–408. [DOI] [PubMed] [Google Scholar]
- McCarver DG, Simpson PM, Kocarek TA, James MO, Runge-Morris M, Stevens JC, Yoon M, Hines RN. (2017) Data from: developmental expression of drug metabolizing enzymes: impact on disposition in neonates and young children, Dryad Digital Repository; DOI: 10.5061/dryad.71pp6. [DOI] [PubMed] [Google Scholar]
- Meinl W, Pabel U, Osterloh-Quiroz M, Hengstler JG, Glatt H. (2006) Human sulphotransferases are involved in the activation of aristolochic acids and are expressed in renal target tissue. Int J Cancer 118:1090–1097. [DOI] [PubMed] [Google Scholar]
- Merlo DF, Agramunt S, Anna L, Besselink H, Botsivali M, Brady NJ, Ceppi M, Chatzi L, Chen B, Decordier I, et al. NewGeneris Consortium (2014) Micronuclei in cord blood lymphocytes and associations with biomarkers of exposure to carcinogens and hormonally active factors, gene polymorphisms, and gene expression: the NewGeneris cohort. Environ Health Perspect 122:193–200. [DOI] [PMC free article] [PubMed] [Google Scholar]
- Murray TJ, Maffini MV, Ucci AA, Sonnenschein C, Soto AM. (2007) Induction of mammary gland ductal hyperplasias and carcinoma in situ following fetal bisphenol A exposure. Reprod Toxicol 23:383–390. [DOI] [PMC free article] [PubMed] [Google Scholar]
- Nowell S, Green B, Tang YM, Wiese R, Kadlubar FF. (2005) Examination of human tissue cytosols for expression of sulfotransferase isoform 1A2 (SULT1A2) using a SULT1A2-specific antibody. Mol Pharmacol 67:394–399. [DOI] [PubMed] [Google Scholar]
- Reiter C, Weinshilboum RM. (1982) Acetaminophen and phenol: substrates for both a thermostable and a thermolabile form of human platelet phenol sulfotransferase. J Pharmacol Exp Ther 221:43–51. [PubMed] [Google Scholar]
- Richard K, Hume R, Kaptein E, Stanley EL, Visser TJ, Coughtrie MW. (2001) Sulfation of thyroid hormone and dopamine during human development: ontogeny of phenol sulfotransferases and arylsulfatase in liver, lung, and brain. J Clin Endocrinol Metab 86:2734–2742. [DOI] [PubMed] [Google Scholar]
- Riches Z, Stanley EL, Bloomer JC, Coughtrie MW. (2009) Quantitative evaluation of the expression and activity of five major sulfotransferases (SULTs) in human tissues: the SULT “pie”. Drug Metab Dispos 37:2255–2261. [DOI] [PMC free article] [PubMed] [Google Scholar]
- Runge-Morris M, Kocarek TA. (2013) Expression of the sulfotransferase 1C family: implications for xenobiotic toxicity. Drug Metab Rev 45:450–459. [DOI] [PubMed] [Google Scholar]
- Sakakibara Y, Yanagisawa K, Katafuchi J, Ringer DP, Takami Y, Nakayama T, Suiko M, Liu MC. (1998) Molecular cloning, expression, and characterization of novel human SULT1C sulfotransferases that catalyze the sulfonation of N-hydroxy-2-acetylaminofluorene. J Biol Chem 273:33929–33935. [DOI] [PubMed] [Google Scholar]
- Shen L, Liu Z, Gong J, Zhang L, Wang L, Magdalou J, Chen L, Wang H. (2014) Prenatal ethanol exposure programs an increased susceptibility of non-alcoholic fatty liver disease in female adult offspring rats. Toxicol Appl Pharmacol 274:263–273. [DOI] [PubMed] [Google Scholar]
- Stanley EL, Hume R, Coughtrie MW. (2005) Expression profiling of human fetal cytosolic sulfotransferases involved in steroid and thyroid hormone metabolism and in detoxification. Mol Cell Endocrinol 240:32–42. [DOI] [PubMed] [Google Scholar]
- Stevens JC, Hines RN, Gu C, Koukouritaki SB, Manro JR, Tandler PJ, Zaya MJ. (2003) Developmental expression of the major human hepatic CYP3A enzymes. J Pharmacol Exp Ther 307:573–582. [DOI] [PubMed] [Google Scholar]
- Teubner W, Meinl W, Florian S, Kretzschmar M, Glatt H. (2007) Identification and localization of soluble sulfotransferases in the human gastrointestinal tract. Biochem J 404:207–215. [DOI] [PMC free article] [PubMed] [Google Scholar]
- Wang J, Falany JL, Falany CN. (1998) Expression and characterization of a novel thyroid hormone-sulfating form of cytosolic sulfotransferase from human liver. Mol Pharmacol 53:274–282. [DOI] [PubMed] [Google Scholar]
- Weis S, Llenos IC, Dulay JR, Elashoff M, Martínez-Murillo F, Miller CL. (2007) Quality control for microarray analysis of human brain samples: the impact of postmortem factors, RNA characteristics, and histopathology. J Neurosci Methods 165:198–209. [DOI] [PubMed] [Google Scholar]
- Williams K, Thomson D, Seto I, Contopoulos-Ioannidis DG, Ioannidis JP, Curtis S, Constantin E, Batmanabane G, Hartling L, Klassen T, StaR Child Health Group (2012) Standard 6: age groups for pediatric trials. Pediatrics 129 (Suppl 3):S153–S160. [DOI] [PubMed] [Google Scholar]
- Wood TC, Aksoy IA, Aksoy S, Weinshilboum RM. (1994) Human liver thermolabile phenol sulfotransferase: cDNA cloning, expression and characterization. Biochem Biophys Res Commun 198:1119–1127. [DOI] [PubMed] [Google Scholar]
- Yamamoto A, Liu MY, Kurogi K, Sakakibara Y, Saeki Y, Suiko M, Liu MC. (2015) Sulphation of acetaminophen by the human cytosolic sulfotransferases: a systematic analysis. J Biochem 158:497–504. [DOI] [PMC free article] [PubMed] [Google Scholar]
- Zhu X, Veronese ME, Iocco P, McManus ME. (1996) cDNA cloning and expression of a new form of human aryl sulfotransferase. Int J Biochem Cell Biol 28:565–571. [DOI] [PubMed] [Google Scholar]