 Diabetes mellitus is a clinically complex disease characterized by hyperglycaemia with disturbances in carbohydrate, fat and protein metabolism.
Abstract
Diabetes mellitus is a clinically complex disease characterized by hyperglycaemia with disturbances in carbohydrate, fat and protein metabolism. The aim of this study was to determine the therapeutic effect of ethanolic extract (EE) from the green cocoon sericin layer of silkworm Bombyx mori on mice with type 2 diabetes mellitus (T2DM) and its hypoglycaemic mechanisms. The results showed that oral EE for 7 weeks had significant ameliorative effects on all the biochemical parameters studied in vivo. The levels of oral glucose tolerance and insulin tolerance were significantly improved. The hypoglycaemic rate in the 350 mg kg–1 high dosage group was 39.38%. The levels of nuclear factor kappa B (NFκB), interleukin 6 (IL-6) and tumour necrosis factor alpha (TNF-α) in the high dosage EE-treated group were significantly reduced, while activities of antioxidant enzymes superoxide dismutase (SOD) and glutathione peroxidase (GSH-Px) were obviously increased. The islet area and the number of insulin-positive beta cells increased significantly in the high dose group. Furthermore, expression levels of insulin receptor (IR), insulin receptor substrate (IRS), phosphatidylinositide 3-kinase (PI3K), p-Akt and phospho-glycogen synthase kinase-3β (p-GSK3β) involved in insulin signalling were increased. Adenosine 5′-monophosphate-activated protein kinase (AMPK) and glucose transporter 4 (GLUT4) also were activated to regulate glucose metabolism in EE-treated groups. The levels of glucose 6-phosphatase (G6pase) and phosphoenolpyruvate carboxykinase (PEPCK) decreased, while the glucokinase (GK) level increased to promote glycolysis. The results clearly indicated that oral EE, especially at a high dose, could improve the glucose metabolism of T2DM by reducing inflammatory reactions, enhancing the antioxidant capacity and insulin sensitivity, and regulating the balance between glycolysis and gluconeogenesis, which means that EE has potential ameliorative effects on T2DM mice.
1. Introduction
Diabetes mellitus (DM), characterized by metabolic dysfunction, is defined as a state of abnormality of glucose, protein and lipid metabolism.1 It is a common chronic disease affecting more than 170 million individuals worldwide,2 among which ∼90% are classified as having type 2 diabetes mellitus (T2DM).3
Type 2 diabetes mellitus is a non-insulin-dependent diabetes that is characterized by abnormal insulin secretion and insulin resistance caused by pancreatic dysfunction.4 The long-term high glucose environment may cause oxidative stress in the body, and oxidative stress is now recognized as the driving force for the development of T2DM.5 The liver plays a central role in the maintenance of blood glucose by balancing gluconeogenesis and glycolysis.6 Phosphatidylinositide 3-kinase (PI3K)/protein kinase B (known as Akt) is one of the primary signalling pathways and is believed to be a major mechanism involved in the development of insulin resistance in the liver.7 Insulin binds to the insulin receptor on the surface of the cell membrane, activation of the insulin receptor leads to tyrosine phosphorylation of the insulin receptor substrate, and then the signal passes to the PI3K/Akt pathway to regulate glucose metabolism actions.8 Diabetes can cause some complications, including coronary artery disease, neuropathy, kidney disease and retinopathy.9 To control the blood sugar and reduce insulin resistance is key to the treatment of T2DM. At present, available therapies for diabetes that have achieved some success include insulin and multiple oral hypoglycaemic medicines.10 However, many drugs have some side effects; therefore, dietetic therapy or searching for a highly efficient and low toxic medicine is a new direction in the treatment of diabetes.
Silk, produced by the silkworm Bombyx mori, is a natural polymer that is primarily made up of sericin and fibroin proteins. Sericin is a kind of colloidal spherical protein that acts as an adhesive joining two fibroin filaments in order to form a solid ellipsoidal cocoon shell.11 In recent years, sericin has been proved to have many biological activities, such as whitening,12 antioxidant, antitumour,13 antidiabetic14 and anti-obesity.15 Sericin not only can reduce blood glucose levels in diabetic rats but also has significant therapeutic effects on a variety of complications caused by diabetes.16
There are small amounts of non-sericin components in the sericin layer, such as pigment, wax, carbohydrates and other ‘impurities’. The non-sericin components mainly contain flavonoids and free amino acids. Three kinds of flavonoids with quercetin as the glucoside have been found in the sericin layer.17 Kurioka et al. purified and identified seven flavonoids from the yellow-green cocoon shell of the Sasammayu silkworm: three quercetin glycosides, two kaempferol glycosides and their aglycones, quercetin and kaempferol, were isolated from the ethanolic extract of cocoon shells.18 Flavonoids have a wide range of biological activities, including anti-obesity,19 hypoglycaemic20 and antitumour,21 while also inhibiting atherosclerosis and anti-hypertensive activity.22 Rutin, a kind of flavonoid, can increase the antioxidant capacity and reduce fasting blood glucose of diabetic rats;23 it can also improve diabetic nephropathy.24 Roslan found that quercetin could reduce inflammatory response and oxidative stress.25 Our previous study indicated that the ethanolic extract of green cocoon shells (Daizo cocoon) contained more flavonoids than that of the other cocoons. In particular, the ethanolic extract of Daizo cocoons possessed a stronger antioxidant activity and inhibitory activity of glucosidase in vitro.26 Furthermore, our previous research found that a hydrolysis-assisted extraction method is specific to the cocoon and far superior to the colorimetric method.27 Flavonoids in the extracts of Daizo cocoons are present in quercetin and kaempferol glycosides; the average contents of these aglycones were 1.98 and 0.42 mg g–1 and their recoveries reached up to 99.56% and 99.17%, respectively.
In this paper, the ethanolic extract (EE) from sericin was obtained from a new green cocoon variety (Caoyuan × Shenyun) that combines the advantages of a Daizo cocoon and a normal white cocoon and contains abundant flavonoids. Here, the EE was extracted by a novel calcium hydroxide degumming method, and then its antioxidant and hypoglycaemic activities were measured.
2. Materials and methods
2.1. Drugs and reagents
High fat diet (HFD10141) was procured from Huafukang Biotechnology (Beijing, China), and streptozotocin (STZ) was bought from Sigma (USA). Total superoxide dismutase (T-SOD), glutathione peroxidase (GSH-Px) and malondialdehyde (MDA) test kits were purchased from the Nanjing Jiancheng Bioengineering Institute, Nanjing, China. Haematoxylin and eosin (H&E) and periodic acid–Schiff (PAS) staining kits were from Beijing Leagene Biotechnology (Beijing, China). All enzyme-linked immunosorbent assay (ELISA) kits were procured from Shanghai Yuanye Biotechnology (Shanghai, China). All other chemicals and solvents used were of analytical grade.
2.2. Preparation of EE from the sericin layer
Green cocoons were obtained from the Soochow University Sericulture Institute (Suzhou, China). Sericin was achieved after boiling twice in a 0.025% calcium hydroxide solution for 20 min. Alkaline degumming water containing sericin was neutralized by sulfuric acid. After neutralization, the crude sericin solution was obtained by centrifugation. Then, the resulting crude sericin solution was mixed with ethanol to give a final concentration of 70%. The precipitate was washed repeatedly with a 70% ethanol solution, and the supernatant was collected, evaporated and freeze-dried. The resulting powdered extract was then used for the following experiments.
2.3. Animals
ICR mice (4 weeks old) were purchased from the Animal Department of Soochow University and acclimatized for 1 week prior to the start of the experiments. They were maintained in a controlled environment under standard conditions of temperature and humidity with a light–dark cycle (12 h light/dark cycle). The mice were fed with a high fat diet (HFD10141) for 4 weeks. After HFD feeding, they were fasted for 12 h (with free access to water) and each mouse was injected once with low-dose streptozotocin at 100 mg kg–1 to induce partial insulin deficiency. Seven days after the injection, blood samples of mice were drawn from the tail vein and fasting blood glucose (FBG) was determined. Mice with more than 11.1 mmol L–1 FBG were considered to be diabetic and were used in the study. The diabetic mice were randomly divided into four groups, with ten mice in each group: (1) T2MD model group; (2) 150 mg per kg body weight (b.w.) EE-treated group (EE-L); (3) 250 mg kg–1 b.w. EE-treated group (EE-M); and (4) 350 mg kg–1 b.w. EE-treated group (EE-H). The EE was administered intragastrically (i.g.) daily for 7 weeks, and body weight was measured every week. The mice were sacrificed by cervical dislocation at the indicated time, and the tissues were sheared, washed with 1× phosphate-buffered saline (PBS), frozen with liquid nitrogen and stored in the freezer at –80 °C or fixed in 10% formaldehyde. Animal experiments are all conducted in accordance with the rules of the international animal welfare committee requirements and regulations. All animal experimental protocols used in this study were approved by the Animal Ethics Committee at Soochow University [number of animal license 201709A324]. The methods were carried out in accordance with the approved guidelines.
2.3.1. Fasting blood glucose detection
During the 7 weeks of EE treatment, FBG of mice fasted for 10 h was determined using a blood glucose meter (ONETOUCH, LifeScan, Milpitas, CA, USA) once a week. Hypoglycaemic rates of these groups were calculated by the following formula:
2.3.2. Glucose and insulin tolerance tests
In the sixth week, some of the mice in each group underwent an oral glucose tolerance test (OGTT). Blood samples were obtained from the lateral tail vein of overnight (12 h)-fasted experimental animals. Successive blood samples were taken at 0, 30, 60, 90 and 120 min after glucose administration (1.5 g kg–1 b.w., dissolved in water via gavage).
The remaining mice in each group underwent an insulin tolerance test (ITT). The animals were fasted for 6 h and intraperitoneally injected with regular insulin (0.75 U per kg b.w.). Blood glucose concentrations were determined from the tail vein at 0, 30, 60, 75 and 90 min.
2.3.3. Fasting serum insulin detection
The assay was performed using a mouse ELISA kit (Nanjing Jiancheng Bioengineering Institute, Nanjing, China). All protocols were carried out according to the manufacturer's instructions.
2.3.4. Homeostasis model assessment of insulin resistance and the insulin sensitivity index
The homeostasis model assessment of insulin resistance (HOMA-IR) was calculated using the following formula:28,29[FBG (mmol L–1) × fasting plasma insulin (mIU L–1)]/22.5.
This has been widely accepted to evaluate insulin resistance in patients with diabetes. The insulin sensitivity index (ISI) was computed according to the following formula:30ln[1/(FBG × fasting plasma insulin)].
2.3.5. Glycosylated haemoglobin concentration detection
The glycosylated haemoglobin concentration (HbA1c) was determined using a commercial kit purchased from Nanjing Jiancheng Bioengineering Institute (Nanjing, China) according to the manufacturer's instructions.
2.3.6. Measurement of T-SOD, GSH-Px, 8-hydroxy-2′-deoxyguanosine (8-OHdG) and MDA levels in hepatic tissue
Test kits evaluating T-SOD and GSH-Px activities and the MDA level in hepatic homogenates of mice were from the Nanjing Jiancheng Bioengineering Institute, Nanjing, China. The 8-OHdG level (a marker of oxidative stress) was evaluated using an ELISA kit (Shanghai Yuanye Biotechnology, Shanghai, China). All experimental methods were carried out according to the manuals for the kits.
2.3.7. Histopathological and immunohistochemical examination
Livers taken from sacrificed mice were fixed in formalin (10%) and paraffin embedded, and tissue slices of 4 μm were prepared. The morphology and the structure of the liver tissue were visualized using H&E staining.
Paraffin-embedded sections of the pancreas were dewaxed, rehydrated and rinsed in PBS. Antigen retrieval was conducted on deparaffinized liver sections by high-pressure repair for 15 min in 0.01 M sodium citrate buffer solution, after natural cooling and three 0.02 M PBS washes for 3 min each. Sections were incubated with primary antibodies overnight at 4 °C, followed by secondary antibodies for 1 h at 37 °C. Nuclei were visualized by staining with 4′,6-diamidino-2-phenylindole (DAPI, 1 : 500).
2.3.8. Western blot analysis
Total protein was extracted from samples of liver tissue, and the protein concentration was determined with a bicinchoninic acid (BCA) protein assay (Beyotime Biotechnology, Shanghai, China). Protein isolated from the hepatic tissues was separated by 10% sodium dodecylsulfate–polyacrylamide gels and then transferred to a polyvinylidene fluoride membrane (Millipore, Shanghai, China). The membrane was incubated overnight with the desired primary antibodies at 4 °C. After washing, the membrane was incubated for 1 h with horseradish peroxidase (HRP)-conjugated secondary antibodies. Protein was visualized with an enhanced chemiluminescence detection kit. Protein expression levels were normalized using glyceraldehyde 3-phosphate dehydrogenase (GAPDH) as the internal standard. All antibodies were provided by Jiangsu KeyGen Biotechnology Development (Nanjing, China).
2.4. Statistics
Areas under the curve versus time (AUCs) were calculated using Integrate (Origin 8.5 version). Experimental data were expressed as mean ± standard deviation (SD). Significant differences between two sets of data were assessed using one-way ANOVA (Origin 8.5 version). A value of P < 0.05 was considered to be statistically significant.
3. Results
3.1. Effects of EE on body weight
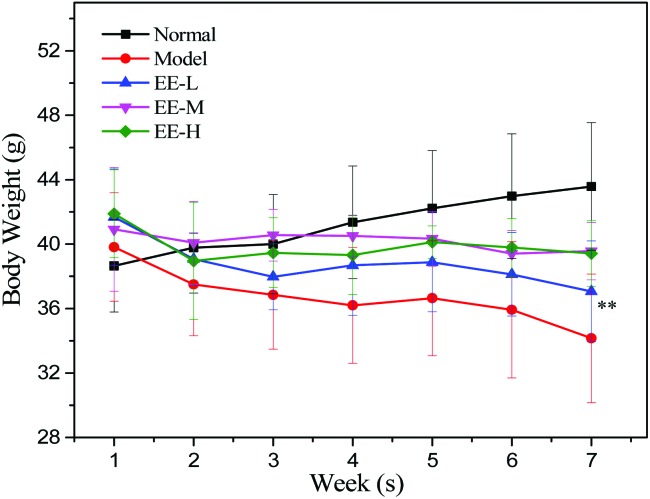
The body weights of the mice in the four different groups are presented in Fig. 1. The body weights of the normal group increased continuously and the trend was stable. In the seventh week, the weight of the normal group was 43.58 ± 2.05 g, which was significantly higher than that of the model group (34.16 ± 3.96 g). The body weights of the EE treatment groups were higher than those of the model group every week. In the 250 mg kg–1 medium dose group and the 350 mg kg–1 high dose group, the body weights of the mice tended to be stable after the first 2 weeks of decline.
Fig. 1. Effects of EE on the body weight of mice. Normal: normal group; Model: diabetic model group; EE-L: 150 mg kg–1 EE-treated diabetic group; EE-M: 250 mg kg–1 EE-treated diabetic group; EE-H: 350 mg kg–1 EE-treated diabetic group. **P < 0.01 vs. normal group.
3.2. Oral glucose and insulin tolerance tests after 6-week repeat administration
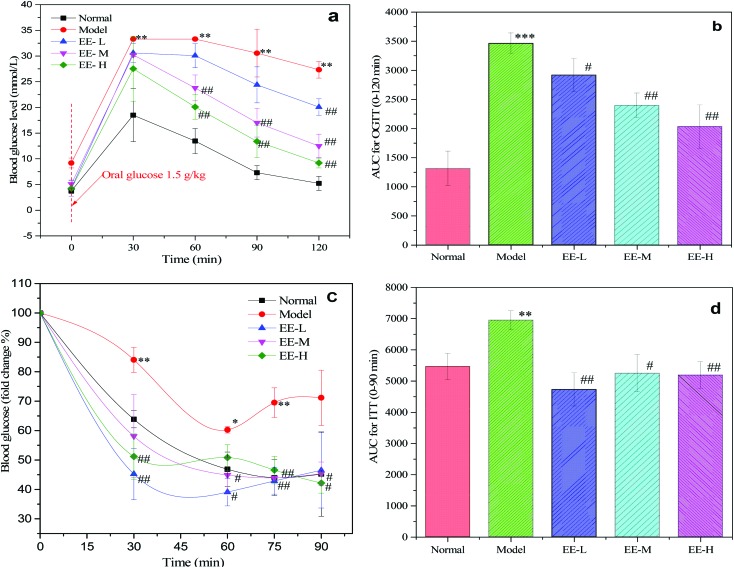
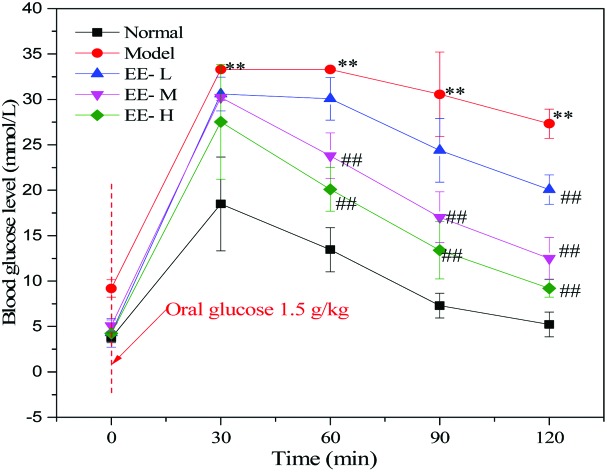
To investigate changes in glucose and insulin tolerance of diabetic mice after EE treatment, OGTT and ITT were performed at the final phase of the experimental period. As shown in Fig. 2a, glucose tolerance was impaired in the diabetic model group, as the blood glucose level was evidently higher than that of the normal group at 30 min (P < 0.01). In contrast, glucose tolerance of the EE-treated groups showed consistent improvement at three time points (60 min, 90 min and 120 min). At 120 min, the blood glucose reduction rates of the normal group, model group and three EE-treated groups were 71.73%, 18.02%, 34.41%, 58.65% and 66.34%, respectively. The blood glucose reduction rate in the EE-H group was 3.68 times as high as that of the model group, and there was a good dose-dependent effect among the three dose groups. Besides, EE treatment reduced the AUC values for OGTT by 15.75%, 30.82% and 49.48% in the EE-L, EE-M and EE-H groups, respectively, compared to the model group (Fig. 2b). Mice in the model group exhibited severe insulin resistance, as assessed by the ITT (Fig. 2c). The normal group had a significantly greater reduction in blood glucose after insulin injection than the model group. In the three EE-treated groups, blood glucose dropped sharply after the injection of insulin, and the change in the blood glucose rate was obviously higher than that of the model group. Accordingly, EE-treatment also reduced the AUC values for ITT compared to the model group (Fig. 2d). Overall, the results indicated that EE could improve the glucose and insulin tolerance of diabetic mice.
Fig. 2. Effects of EE on glucose and insulin tolerance tests in mice: (a) OGTT; (b) AUC for OGTT; (c) ITT (results are presented as fold change, compared to fasting glucose); (d) AUC for ITT. Normal: normal group; Model: diabetic model group; EE-L: 150 mg kg–1 EE-treated diabetic group; EE-M: 250 mg kg–1 EE-treated diabetic group; EE-H: 350 mg kg–1 EE-treated diabetic group. *P < 0.05, **P < 0.01 and ***P < 0.001 vs. normal group; #P < 0.05 and ##P < 0.01 vs. model group.
3.3. Fasting blood glucose, insulin, HbA1c, HOMA-IR and ISI levels
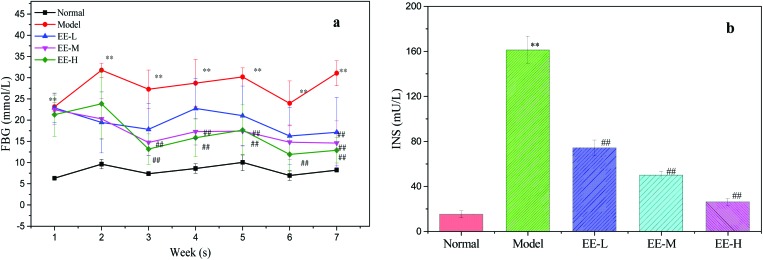
High fasting blood glucose and insulin are major characteristics of T2DM. After 7 weeks, the blood glucose level of the model group was significantly higher than that of the normal group (P < 0.01, Fig. 3a), whereas treatment with EE led to a significant reduction in blood glucose level.
Fig. 3. Effects of EE on FBG and fasting serum insulin of mice: (a) effects of EE on FBG of mice; (b) effects of EE on fasting serum insulin of mice. Normal: normal group; Model: diabetic model group; EE-L: 150 mg kg–1 EE-treated diabetic group; EE-M: 250 mg kg–1 EE-treated diabetic group; EE-H: 350 mg kg–1 EE-treated diabetic group. **P < 0.01 vs. normal group; ##P < 0.01 vs. model group.
The hypoglycaemic rates after EE treatment were 25.16%, 34.97% and 39.38% in the EE-L, EE-M and EE-H groups, respectively.
Type 2 diabetes mellitus is a non-insulin-dependent diabetes characterized by insulin resistance, and this will lead to a high level of serum insulin. From Fig. 3b, we can see that the insulin level (161.2 ± 12.08 mU L–1) in the model group was significantly higher than that in the normal group (P < 0.01), whereas EE treatment significantly decreased the insulin level (P < 0.01) in a dose-dependent manner. The results indicated that EE could effectively control the abnormal level of serum insulin and had the potential to improve insulin resistance.
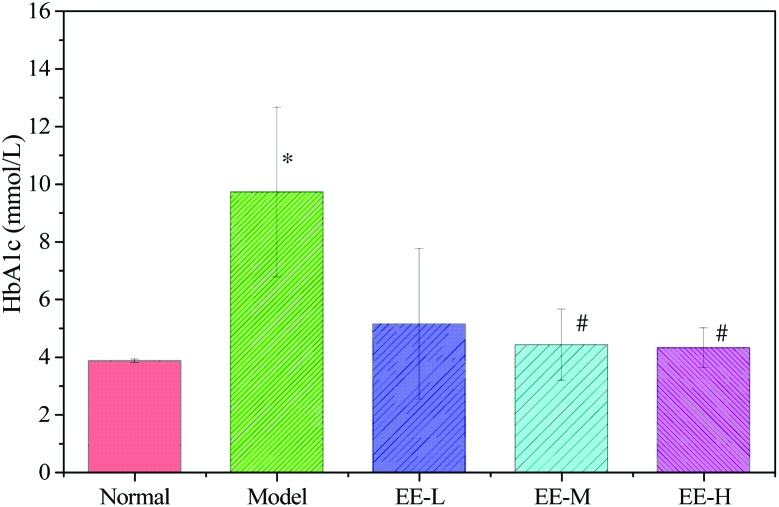
The HbA1c level is the most valuable index for judging the state of glycaemic control. As Fig. 4 shows, the level of HbA1c in the model group was 9.72 ± 2.95 mmol L–1, which was significantly higher than that in the normal group (3.86 ± 0.06 mmol L–1). HbA1c levels in the EE-M and EE-H groups decreased to 4.42 ± 1.24 mmol L–1 and 4.32 ± 0.69 mmol L–1, respectively, which were significantly different from that in the model group. These results indicated that EE could effectively decrease the level of HbA1c in diabetic mice.
Fig. 4. Effects of EE on HbA1c of T2DM mice. Normal: normal group; Model: diabetic model group; EE-L: 150 mg kg–1 EE-treated diabetic group; EE-M: 250 mg kg–1 EE-treated diabetic group; EE-H: 350 mg kg–1 EE-treated diabetic group. *P < 0.05 vs. normal group; #P < 0.05 vs. model group.
For now, HOMA-IR is widely used to assess insulin resistance. As shown in Table 1, compared to the normal group, the diabetic model group was observed to have an obvious decrease in ISI (P < 0.01) and a significant increase in HOMA-IR (P < 0.01). Importantly, administration of EE led to a prominent reduction in HOMA-IR, which in turn progressively increased ISI. The results indicated that after 7 weeks of EE treatment, the insulin resistance of diabetic mice was significantly mitigated, which means that EE could improve the insulin sensitivity of T2DM mice effectively.
Table 1. Effects of EE on HOMA-IR and ISI of mice.
| Group | HOMA-IR | ISI |
| Normal | 5.48 ± 1.39 | –4.79 ± 0.27 |
| Model | 228.33 ± 31.82** | –8.54 ± 1.45** |
| EE-L | 51.75 ± 17.73## | –7.03 ± 0.33## |
| EE-M | 25.56 ± 7.49## | –6.33 ± 0.28## |
| EE-H | 11.73 ± 2.53## | –5.56 ± 0.21## |
3.4. Effects of EE on blood lipids
To study the effect of EE on blood lipids, total glucose (TG), total cholesterol (TC), high-density lipoprotein cholesterol (HDL-C) and low-density lipoprotein cholesterol (LDL-C) levels of serum were tested. As Table 2 shows, the level of TG in the model group was 2.35 ± 0.13 mmol L–1, which was obviously higher than that in the normal group (P < 0.01). Furthermore, the levels of HDL-C and LDL-C in the model group were significantly different from the levels in the normal group (P < 0.05). After EE treatment, the levels of the four indexes of serum approached normal. In particular, after the high-dose EE treatment, the levels of TG and LDL-C were significantly different from the levels in the model group (P < 0.05). The results indicated that EE treatment improved the levels of TG and LDL-C in diabetic mice to some extent.
Table 2. Effects of EE on blood lipids of mice.
| Group | TG (mmol L–1) | TC (mmol L–1) | HDL-C (mmol L–1) | LDL-C (mmol L–1) |
| Normal | 1.63 ± 0.18 | 2.03 ± 0.74 | 3.00 ± 0.09 | 0.26 ± 0.01 |
| Model | 2.35 ± 0.13** | 2.45 ± 0.18 | 2.75 ± 0.10* | 0.35 ± 0.04* |
| EE-L | 1.93 ± 0.38 | 2.23 ± 0.51 | 2.25 ± 0.19 | 0.24 ± 0.02# |
| EE-M | 2.25 ± 0.42 | 2.35 ± 0.33 | 2.97 ± 0.40 | 0.30 ± 0.07 |
| EE-H | 1.94 ± 0.20# | 2.39 ± 0.39 | 2.96 ± 0.41 | 0.28 ± 0.01# |
3.5. Effects of EE on the pancreas
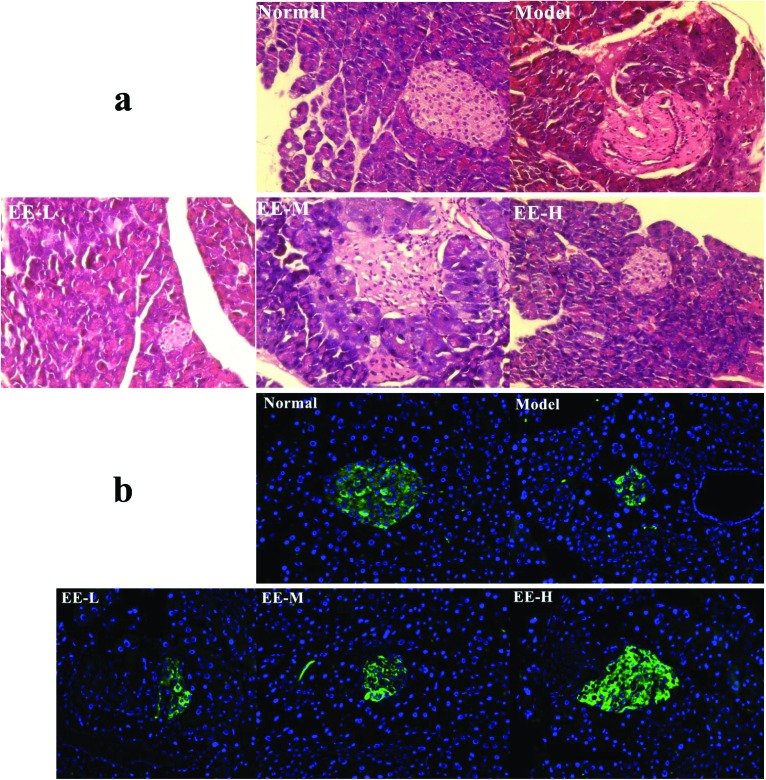
Type 2 diabetes is defined by insulin resistance and islet beta cell loss. Fig. 5a shows the H&E-stained section of the mouse pancreas in each group. A complete pancreatic islet structure, uniform arrangement and abundant pancreatic beta cells were observed in the normal group. In contrast, islet cells of the model group appeared to be loose or deformed. Furthermore, pancreatic beta cells were markedly reduced, apoptotic or necrotic, and the pancreas had irregular margins. After EE treatment, the structures of islets from the low dose group to the high dose group were improved and the number of pancreatic beta cells also increased. The effect of EE on insulin expression in the pancreatic islets of diabetic mice was detected by immunofluorescence staining, and insulin was tagged to appear green (Fig. 5b). The amount of insulin secreted in the pancreatic islets was markedly reduced in the model group compared to the normal group. After EE treatment, especially the high dose treatment, the green fluorescence intensity increased significantly, the islet area increased, and its structure tended to be complete. The results indicated that the number of insulin-positive beta cells that could normally secrete insulin increased after EE treatment. In other words, EE may have the potential to restore the structure and function of the damaged pancreatic islets.
Fig. 5. Effects of EE on morphological changes and insulin expression in the pancreas: (a) effects of EE on morphological changes of the pancreas ×400; (b) immunofluorescence analysis of insulin expression in the pancreatic islets ×200. Normal: normal group; Model: diabetic model group; EE-L, EE-M and EE-H: 150 mg kg–1, 250 mg kg–1 EE and 350 mg kg–1 EE-treated diabetic groups, respectively.
3.6. Effects of EE on the level of hepatic function enzymes
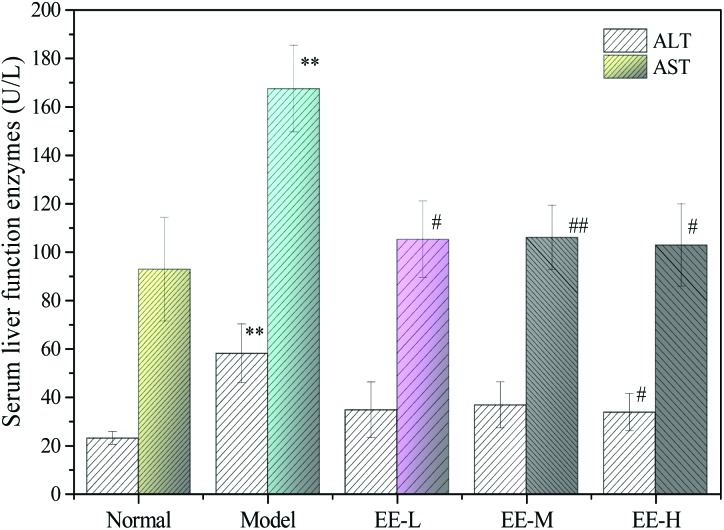
Alanine transaminase (ALT) and aspartate transaminase (AST) are two important indicators for evaluating liver function. As shown in Fig. 6, the serum levels of ALT and AST in the mice of the model group were 58.00 ± 12.17 U L–1 and 167.47 ± 17.91 U L–1, respectively, which were significantly different from those of the normal group (P < 0.01), indicating that diabetes could damage the liver. After 7 weeks of treatment, ALT in the high dose group decreased significantly compared with the model group (P < 0.05). Although the levels of AST in the three EE treatment groups decreased significantly compared with the model group (P < 0.05 vs. <0.01) and the level in the high dose group was even close to the level in the normal group, there was no dose dependence in each group. The results indicated that EE treatment could reduce liver damage to some extent.
Fig. 6. Effects of EE on serum liver function enzymes of T2DM mice. Normal: normal group; Model: diabetic model group; EE-L: 150 mg kg–1 EE-treated diabetic group; EE-M: 250 mg kg–1 EE-treated diabetic group; EE-H: 350 mg kg–1 EE-treated diabetic group. **P < 0.01 vs. normal group; #P < 0.05 and ##P < 0.01 vs. model group.
3.7. Antioxidant abilities in the liver
Hyperglycaemia could increase advanced glycation end products, oxidation and oxidative phosphorylation of glucose and lead to oxidative stress. Both GSH-Px and T-SOD are important antioxidants that scavenge free radicals, while MDA is a lipid peroxidation product. To evaluate the effect of EE on antioxidant abilities in the liver, the levels of GSH-Px, T-SOD and MDA were tested. As expected (Table 3), the activities of GSH-Px and T-SOD in the liver of the diabetic model group were dramatically reduced and MDA content was significantly increased when compared to the normal group (P < 0.01). Remarkably, EE treatment of diabetic mice significantly restored the decreased activities of enzymes to near normal levels and reduced MDA content in a dose-dependent manner. Being a sensitive DNA damage marker, 8-OHdG can be used to evaluate the degree of oxidative damage of DNA in vivo. The level of 8-OHdG in the liver of the model group was higher than that of the normal group, indicating that the degree of oxidative damage of DNA in the liver of the model group was serious. After EE treatment, the level of 8-OHdG in the liver decreased and the levels in the medium and high dose groups were significantly lower than that in the model group (P < 0.01). The results indicated that EE could improve antioxidant ability and decrease the oxidative damage of DNA in the liver of diabetic mice.
Table 3. Effects of EE on GSH-Px, T-SOD, MDA and 8-OHdG in the liver of mice.
| Group | GSH-Px (U mg–1 protein) | T-SOD (U mg–1 protein) | MDA (nmol mg–1 protein) | 8-OHdG (ng mg–1 protein) |
| Normal | 1468.81 ± 139.39 | 93.79 ± 2.43 | 2.12 ± 0.20 | 1.13 ± 0.27 |
| Model | 656.71 ± 6.15** | 55.81 ± 0.55** | 3.04 ± 0.25** | 1.55 ± 0.19 |
| EE-L | 1107.01 ± 103.55## | 87.15 ± 13.06# | 2.37 ± 0.59 | 1.24 ± 0.22 |
| EE-M | 1243.85 ± 150.41## | 83.61 ± 10.05## | 1.76 ± 0.13## | 0.86 ± 0.12## |
| EE-H | 1477.15 ± 49.69## | 89.40 ± 16.33# | 1.75 ± 0.27## | 0.62 ± 0.17## |
3.8. Effects of EE on inflammatory factors in the liver
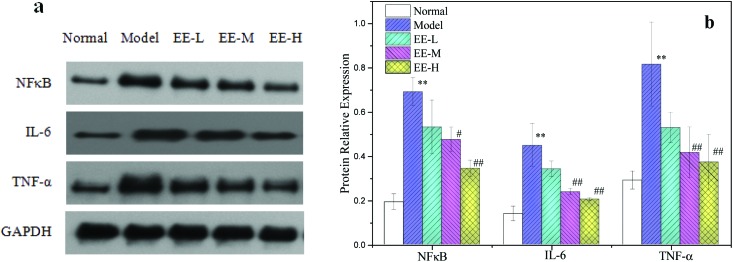
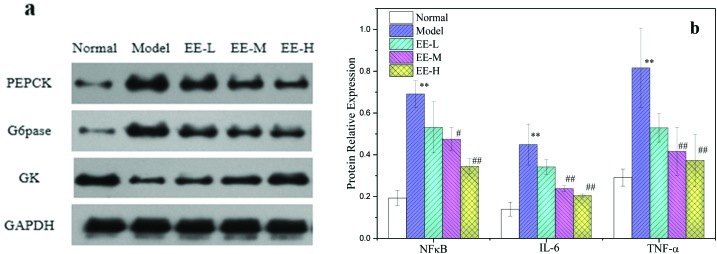
A long-term high glucose environment and disturbance of glucose and lipid metabolism may cause oxidative stress in the liver of T2DM mice and then cause inflammatory changes in vivo. As described in Fig. 7, the expression levels of nuclear factor kappa B (NFκB), interleukin 6 (IL-6) and tumour necrosis factor alpha (TNF-α) in the liver of diabetic model mice were significantly higher than those in the normal group (P < 0.01): 3.58, 3.21 and 3.12 times the normal group, respectively. This indicated that there was a serious inflammatory reaction in the liver of diabetic mice. After EE treatment, the levels of NFκB, IL-6 and TNF-α in the 250 mg kg–1 treatment group decreased to 68.82%, 53.12% and 51.01% of the model group, respectively, and in the 350 mg kg–1 treatment group, the levels decreased to 49.90%, 45.74% and 45.75%, respectively (Fig. 7b). The results indicated that EE could reduce the inflammatory reaction in the liver of diabetic mice.
Fig. 7. Effects of EE on NFκB, IL-6 and TNF-α protein expressions in liver tissue of mice: (a) western blot analysis of NFκB, IL-6 and TNF-α protein expressions; (b) quantitative analysis of NFκB, IL-6 and TNF-α protein expressions. Normal: normal group; Model: diabetic model group; EE-L: 150 mg kg–1 EE-treated diabetic group; EE-M: 250 mg kg–1 EE-treated diabetic group; EE-H: 350 mg kg–1 EE-treated diabetic group. **P < 0.01 vs. normal group; #P < 0.05 and ##P < 0.01 vs. model group.
3.9. Histopathological changes in the liver
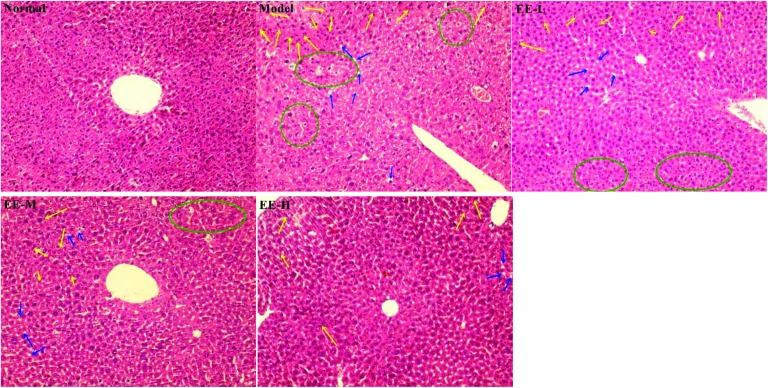
The liver is an important organ for maintaining the stability of blood glucose and also for regulating lipid and protein metabolism. As shown in Fig. 8, the hepatic cells in the normal group had a complete structure, an orderly arrangement and uniform distribution; no abnormal pathological changes were found in the normal group. In contrast, the liver cells in the diabetic model group had serious pathological damage and a disordered arrangement: a large number of lipid droplets (marked by blue arrows) were vacuolated, and inflammatory infiltration (marked by yellow arrows) and oedema (marked by green circles) were also found. The hepatic morphology of EE-treated groups was markedly improved: the 350 mg kg–1 high dose group had the most obvious treatment effect, with cells arranged evenly and levels of fat accumulation, inflammatory infiltration and oedema area significantly decreased. These results indicate that EE could effectively reduce liver injury caused by diabetes.
Fig. 8. Effects of EE on liver histomorphology of mice (H&E stain, ×200). Normal: normal group; Model: diabetic model group; EE-L: 150 mg kg–1 EE-treated diabetic group; EE-M: 250 mg kg–1 EE-treated diabetic group; EE-H: 350 mg kg–1 EE-treated diabetic group. The yellow arrows show inflammatory cell infiltration, the blue arrows show fatty deposits, and the green circles show oedema.
3.10. Effect of EE on the insulin signalling pathway
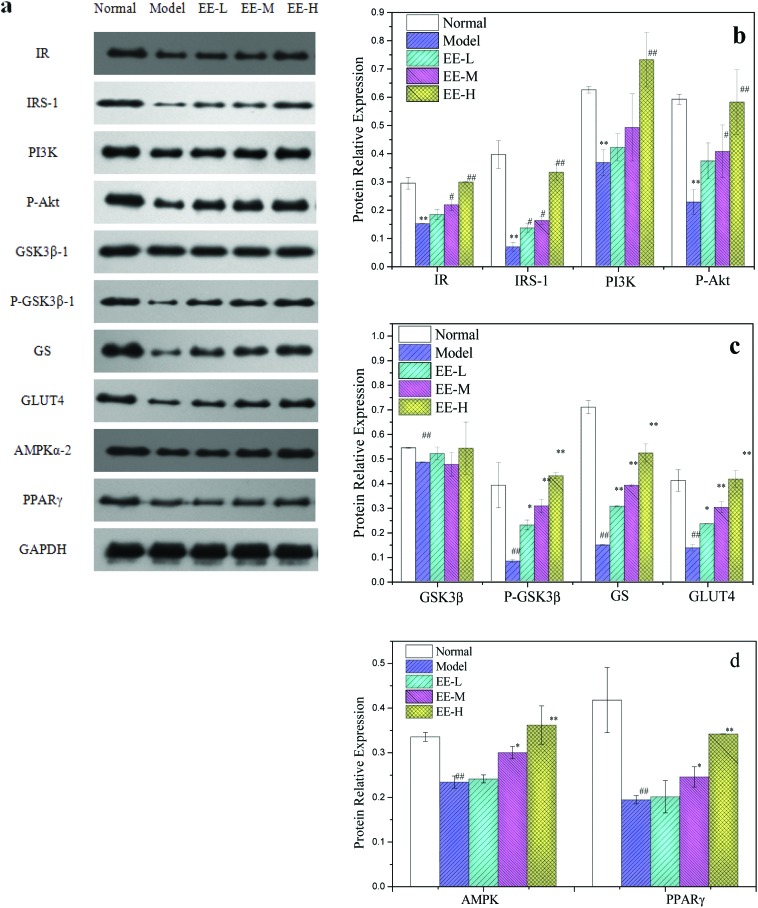
Insulin is the major regulating hormone for the metabolism of sugar and fat. Insulin resistance is a major feature of T2DM, and the phosphatidylinositide 3-kinase (PI3K)/p-Akt signalling pathway is the key pathway for regulating glucose uptake, the transport system and insulin metabolism. In this experiment, expressions of the key proteins in the insulin signalling pathway in the liver of diabetic mice were investigated.
The levels of insulin receptor (IR) and insulin receptor substrate (IRS) protein in the model group were significantly lower than those in the normal group (P < 0.01): 50.00% and 16.95% of the normal group, respectively. However, after treatment with different doses of EE, the expressions of IR and IRS were significantly higher than those in the model group in a dose-dependent manner. The levels of IR and IRS protein in the 350 mg kg–1 high dose group were close to the normal level. Phosphorylation of IRS activates PI3K, and activated PI3K activates Akt through a series of signal molecules. The level of p-Akt protein in the liver of diabetic mice was also significantly lower than that in the normal group (P < 0.01). The EE treatment could increase the p-Akt level (Fig. 9a and b), and protein expression in the high dose group was 2.57 times that in the model group. The Akt downstream enzyme glycogen synthase kinase-3β (GSK3β) can inhibit glycogen synthesis, promote gluconeogenesis and hinder insulin signal transduction. Activated Akt can deactivate GSK3β by phosphorylation (phosphorylation at the Ser9 site), increase the activity of glycogen synthetase (GS), inhibit gluconeogenesis and increase the production of glycogen. The p-GSK3β : GSK3β ratios for the normal control group, the model group and different EE treatment groups were 0.72, 0.17, 0.44, 0.64 and 0.79, respectively.
Fig. 9. Effects of EE on key protein expressions of liver insulin signalling pathway of mice: (a) western blot analysis of IR, IRS, PI3K, p-Akt, p-GSK3β, GSK3β, GS and glucose transporter 4 (GLUT4) protein expressions; (b) quantitative analysis of IR, IRS, PI3K and p-Akt protein expressions; (c) quantitative analysis of p-GSK3β, GSK3β, GS and GLUT4 protein expressions; (d) quantitative analysis of adenosine 5′-monophosphate-activated protein kinase (AMPKα-2) and peroxisome proliferator-activated receptor (PPARγ) protein expressions. Normal: normal group; Model: diabetic model group; EE-L, EE-M and EE-H: 150 mg kg–1, 250 mg kg–1 and 350 mg kg–1 EE-treated diabetic groups, respectively. *P < 0.05 and **P < 0.01 vs. normal group; #P < 0.05 and ##P < 0.01 vs. model group.
The GSK3β phosphorylation level in the model group was the lowest, and EE treatment could increase the phosphorylation of GSK3β. Similarly, the level of GS protein in the EE treatment group was significantly higher than that in the model group (P < 0.01). Glucose transporter 4 (GLUT4) is a transmembrane transporter that promotes glucose transport to cells to be utilized. The expression level of GLUT4 protein in the model group was reduced by 67% compared to the normal group, and expression levels of GLUT4 protein in the EE treatment groups were 1.73-, 2.22- and 3.07-fold, respectively, compared with the model group. Adenosine 5′-monophosphate-activated protein kinase (AMPK) can promote GLUT4 translocation and increase glucose uptake. The level of AMPK in the liver of model mice was significantly lower than that of normal mice (P < 0.01); 350 mg kg–1 EE treatment significantly increased the level of AMPK, leading to 56.52% upregulation compared with the model group (Fig. 9b and c).
Peroxisome proliferator-activated receptor (PPARγ) plays a crucial role in regulating lipid metabolism. As shown in Fig. 9d, the level of PPARγ protein in the model group was 46.56% that of the normal group (P < 0.01). EE treatment could significantly increase the expression of PPARγ (P < 0.05 vs. <0.01), with the levels of PPARγ in the 250 mg kg–1 and 350 mg kg–1 groups being 1.26 and 1.76 times that in the model group, respectively. This indicated that EE could significantly improve the PPARγ level in the liver of diabetic mice.
Gluconeogenesis and glycolysis are the two main directions of carbohydrate metabolism in the body. The high level of sugar in diabetic mice is related to the imbalance of gluconeogenesis and glycolysis. As shown in Fig. 10, the levels of phosphoenolpyruvate carboxykinase (PEPCK) and glucose 6-phosphatase (G6pase) in the model group were significantly higher than those in the normal group (P < 0.01) and could reach 5.77 and 5.71 times that of the normal group, respectively, whereas the level of glucokinase (GK) was 66.07% lower than that in the normal group. In contrast, the levels of PEPCK and G6pase in the three EE-treated groups were significantly lower than those in the model group (P < 0.01); the level of PEPCK in the 250 mg kg–1 and 350 mg kg–1 EE-treated groups decreased to 48.09% and 53.85% of the model group, respectively, and had good dose dependence. The levels of GK in the liver of the 250 mg kg–1 and 350 mg kg–1 treatment groups were significantly increased (P < 0.01), reaching 1.85- and 2.79-fold, respectively, compared with the model group.
Fig. 10. Effects of EE on key protein expressions of hepatic glucose metabolism of mice: (a) western blot analysis of PEPCK, G6pase and GK protein expressions; (b) quantitative analysis of PEPCK, G6pase and GK protein expressions. Normal: normal group; Model: diabetic model group; EE-L: 150 mg kg–1 EE-treated diabetic group; EE-M: 250 mg kg–1 EE-treated diabetic group; EE-H: 350 mg kg–1 EE-treated diabetic group. *P < 0.05 and **P < 0.01 vs. normal group; #P < 0.05 and ##P < 0.01 vs. model group.
4. Discussion
In this study, we examined the hypoglycaemic mechanisms underlying EE-mediated amelioration of glucose metabolism and insulin sensitivity in T2DM mice induced by STZ and a high fat diet. Our results provide further explanation for the therapeutic effects of EE on diabetes mellitus in addition to reduced oxidative stress and improved glucose metabolism.
Injection of STZ in conjunction with a high fat diet is used to develop a T2DM animal model whereby animals exhibit metabolic characteristics of T2DM patients.31 In our study, the results of OGTT and ITT showed that EE could improve the level of glucose metabolism and enhance the biological function of insulin in diabetic mice. Insulin sensitivity in EE-treated diabetic mice was significantly improved, as assessed from HOMA-IR and ISI data. After 7 weeks of EE treatment, the hypoglycaemic rates of the three treatment groups were 25.16%, 34.97% and 39.38%, respectively, and the fasting blood glucose of the high dose group reached 12.9 ± 2.98 mmol L–1. The HbA1c level in the EE-treated medium and high dose groups decreased to 4.42 ± 1.24 mmol L–1 and 4.32 ± 0.69 mmol L–1, respectively. This indicates that EE has a good hypoglycaemic effect and a certain dose effect. In addition, EE also effectively reduced the abnormal elevated serum insulin level in diabetic mice.
The liver is the most important organ for the metabolism of sugar, fat and protein and also plays a major role in insulin action and insulin catabolism. Diabetes can cause both liver damage and metabolic disorders. In this paper, the hepatocytes of the diabetic model group had severe pathological injury, inflammatory infiltration and fat accumulation, and the levels of serum ALT and AST, two important indicators for evaluating liver function, increased significantly. The results indicated that treatment with EE could reduce the pathological damage of the liver and was effective in liver protection.
The liver is the main target of insulin and the key organ of glucose metabolism; it is also the main organ which is prone to injury by oxidative stress.32 Oxidative stress is increased in T2DM and may be the common pathway for insulin resistance and metabolic syndrome in T2DM.33 Sericin has been demonstrated to increase the level of antioxidant enzymes in diabetic rats.34 Besides, EE contains abundant flavonoids which also have good antioxidant activities.35 Our results show that treatment with EE can improve the levels of SOD and GSH-Px in the liver and also reduce the levels of MDA and 8-OHdG. This indicates that EE can reduce the level of lipid peroxidation by reducing the expression of antioxidant enzymes and reducing the damage to the liver caused by oxidative stress.
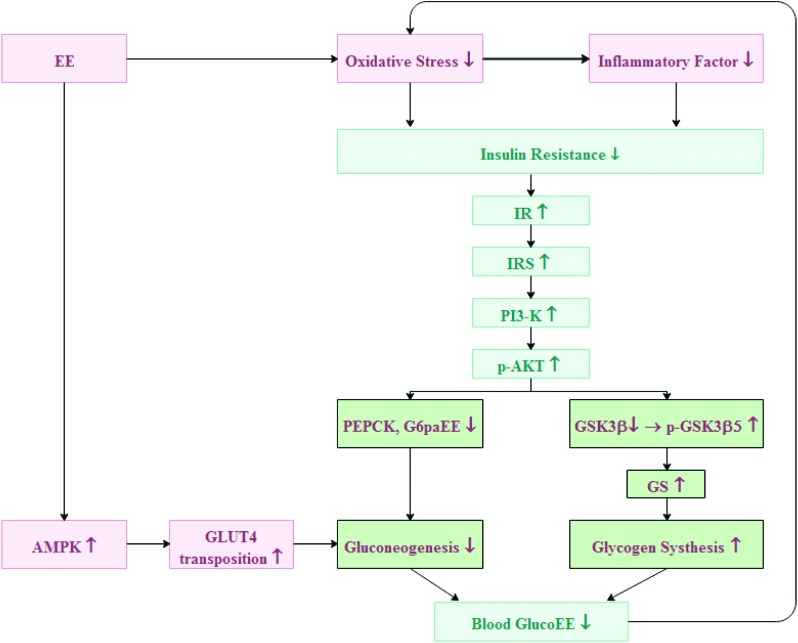
Oxidative stress also triggers other cascade reactions, leading to changes in inflammation in vivo. Inflammation can produce inflammatory mediators, including cell adhesion molecules and cytokines,36 and plays a key role in the development of diabetic liver injury. In various inflammatory reactions, the production of proinflammatory cytokines is closely related to diabetes, such as liver injury induced by proinflammatory cytokines, low chronic inflammation and increased phosphorylation of insulin receptor substrates.37 When reactive oxygen species are overproduced, NFκB is activated. Activated NFκB can activate transcription of its downstream genes, leading to overexpression of a series of inflammatory factors, including IL-6 and TNF-α.38 Excessive production of proinflammatory cytokines may increase phosphorylation of insulin receptor substrates in diabetic patients, leading to insulin resistance. The TNF-α increases serine/threonine phosphorylation of insulin receptor substrate, thereby affecting insulin signalling. A large amount of IL-6 in a high glucose environment can reduce tyrosine phosphorylation and ultimately reduce insulin sensitivity.39 In this experiment, the expression levels of NFκB, IL-6 and TNF-α in the liver of T2DM mice reached 3.58, 3.21 and 3.12 times those of the normal group, respectively, which indicated that there was a serious inflammatory reaction in the liver. After treatment with EE, the levels of NFκB, IL-6 and TNF-α in the 250 mg kg–1 dose group decreased to 68.82%, 53.12% and 51.01% of the model group, respectively, and in the 350 mg kg–1 dose group, the levels decreased to 49.90%, 45.74% and 45.75% of the model group, respectively. This indicates that EE can effectively reduce the inflammatory reaction in the liver of diabetic mice (Fig. 11).
Fig. 11. Schematic diagram showing the downstream signal mechanism of EE in modulating glucose metabolism in hepatocytes.
Insulin resistance is mainly caused by an impaired insulin signalling pathway. The PI3K/p-Akt signalling pathway is a key pathway for insulin metabolism and for regulating glucose uptake and transport systems; it is also closely related to insulin resistance associated with T2DM.40 Binding of insulin to the IR changes the conformation of the IR. Then IRS is phosphorylated, which activates PI3K, and activated PI3K activates Akt through a series of signal molecules.41 Insulin activates the PI3K/Akt signalling pathway, which inactivates GSK3β by phosphorylation, and then activates GS, a key speed-limiting enzyme for insulin-mediated glycogen synthesis, which in turn speeds up glycogen synthesis.42–44 To investigate the effects of EE on insulin sensitivity, expression of transfer proteins in the insulin signalling pathway in the liver was determined. After 7 weeks of treatment with different doses of EE, the levels of IR, IRS, PI3K, P-Akt and p-GSK3β all increased in the liver of diabetic mice. Activated AMPK can promote glycolysis and lactic acid production and also promote GLUT4 translocation.45 GLUT4 is an insulin-sensitive glucose transporter that contributes to glucose transport and increases glucose utilization.46 Expression of GLUT4 and AMPK in the EE-treated group increased significantly compared with that in the model group. Both PEPCK and G6pase are speed-limiting enzymes of sugar isogenesis.47 The PI3K/Akt signalling pathway regulates the balance between gluconeogenesis and glycolysis by regulating the expression of both PEPCK and G6pase.48 We found that EE could inhibit gluconeogenesis by downregulating the expression of PEPCK and G6pase through the PI3K/Akt signalling pathway. Glucokinase is a rate-limiting enzyme for catalysing glucose phosphorylation in hepatocytes and plays a role in maintaining glucose homeostasis.49 The expression of GK in T2DM mice was significantly lower than that in the normal group, which, due to insulin resistance, could not stimulate GK production. EE treatment can significantly increase the level of GK and accelerate glucose utilization (Fig. 11).
5. Conclusion
In summary, the findings of this study indicate that EE, an ethanol extract from green cocoon, may ameliorate glucose metabolism and regulate the balance between glycolysis and gluconeogenesis of T2DM by reducing inflammatory reaction and enhancing the body's antioxidant capacity and insulin sensitivity. These findings provide evidence supporting the application of EE as a potential preventive and therapeutic measure for T2DM and insulin resistance.
Conflicts of interest
There are no conflicts of interest to declare.
Acknowledgments
The authors gratefully acknowledge the earmarked fund (CARS-18-ZJ0502) for the China Agriculture Research System (CARS), a project funded by the Priority Academic Program Development of Jiangsu Higher Education Institutions and the China Postdoctoral Science Foundation (7131705518), People's Republic of China.
References
- Banerjee M., Vats P. Redox Biol. 2014;2(1):170–177. doi: 10.1016/j.redox.2013.12.001. [DOI] [PMC free article] [PubMed] [Google Scholar]
- Brem H., Tomiccanic M. J. Clin. Invest. 2007;117(5):1219–1222. doi: 10.1172/JCI32169. [DOI] [PMC free article] [PubMed] [Google Scholar]
- Liu M., Wu K. X., Wu Y. J. Ethnopharmacol. 2010;127(1):32–37. doi: 10.1016/j.jep.2009.09.055. [DOI] [PubMed] [Google Scholar]
- Sharma A. K., Bharti S., Goyal S. Phytother. Res. 2011;25(10):1457–1465. doi: 10.1002/ptr.3442. [DOI] [PubMed] [Google Scholar]
- Tangvarasittichai S. World J. Diabetes. 2015;6(3):456–480. doi: 10.4239/wjd.v6.i3.456. [DOI] [PMC free article] [PubMed] [Google Scholar]
- Nordlie R. C., Foster J. D., Lange A. J. Annu. Rev. Nutr. 1999;19:379–406. doi: 10.1146/annurev.nutr.19.1.379. [DOI] [PubMed] [Google Scholar]
- Gao Y. F., Zhang M. N., Wang T. X. Mol. Cell. Endocrinol. 2016;433(C):26–34. doi: 10.1016/j.mce.2016.05.013. [DOI] [PubMed] [Google Scholar]
- Taniguchi C. M., Emanuelli B., Kahn C. R. Nat. Rev. Mol. Cell Biol. 2006;7(2):85–96. doi: 10.1038/nrm1837. [DOI] [PubMed] [Google Scholar]
- Phillips M., Cataneo R. N., Cheema T. Clin. Chim. Acta. 2004;344(1–2):189–194. doi: 10.1016/j.cccn.2004.02.025. [DOI] [PubMed] [Google Scholar]
- Scheen A. J. Drug Saf. 2005;28(7):601–631. doi: 10.2165/00002018-200528070-00004. [DOI] [PubMed] [Google Scholar]
- Mondal M., Trivedy K., Kumar S. N. Caspian J. Environ. Sci. 2007;5:63–76. [Google Scholar]
- Singh M. K., Varun V. K., Behera B. K. Fibres Text. East. Eur. 2011;87(4):27–33. [Google Scholar]
- Zhao J. G., Zhang Y. Q. Toxicol. Res. 2015;4(4):1016–1024. [Google Scholar]
- Okazaki Y., Kakehi S., Xu Y. Biosci., Biotechnol., Biochem. 2010;74(8):1534–1538. doi: 10.1271/bbb.100065. [DOI] [PubMed] [Google Scholar]
- Seo C. W., Um I. C., Rico C. W., Kang M. Y. J. Agric. Food Chem. 2011;59(8):4192–4197. doi: 10.1021/jf104812g. [DOI] [PubMed] [Google Scholar]
- Song C., Yang Z., Zhong M., Chen Z. Neural Regener. Res. 2013;8(6):506–513. doi: 10.3969/j.issn.1673-5374.2013.06.003. [DOI] [PMC free article] [PubMed] [Google Scholar]
- Tamura Y., Nakajima K. I., Nagayasu K. I. Phytochemistry. 2002;59(3):275–278. doi: 10.1016/s0031-9422(01)00477-0. [DOI] [PubMed] [Google Scholar]
- Kurioka A., Yamazaki M. Biosci., Biotechnol., Biochem. 2002;66(6):1396–1399. doi: 10.1271/bbb.66.1396. [DOI] [PubMed] [Google Scholar]
- Liu R., Zheng Y., Cai Z. Front. Pharmacol. 2017;8:687. doi: 10.3389/fphar.2017.00687. [DOI] [PMC free article] [PubMed] [Google Scholar]
- Min Q., Bai Y., Zhang Y. J. Evidence-Based Complementary Altern. Med. 2017;(2):1–8. [Google Scholar]
- Gang W., Wang J. J., Rui G. Nutr. Cancer. 2017;69(4):534. doi: 10.1080/01635581.2017.1295090. [DOI] [PubMed] [Google Scholar]
- Lee Y. J., Choi D. H., Kim E. J. Am. J. Chin. Med. 2011;39(1):39–52. doi: 10.1142/S0192415X11008634. [DOI] [PubMed] [Google Scholar]
- Kamalakkannan N., Prince P. S. M. Basic Clin. Pharmacol. Toxicol. 2006;98(1):97–103. doi: 10.1111/j.1742-7843.2006.pto_241.x. [DOI] [PubMed] [Google Scholar]
- Hao H., Shao Z., Tang D. Life Sci. 2012;91(19–20):959–967. doi: 10.1016/j.lfs.2012.09.003. [DOI] [PubMed] [Google Scholar]
- Roslan J., Giribabu N., Karim K. Biomed. Pharmacother. 2016;86:570–582. doi: 10.1016/j.biopha.2016.12.044. [DOI] [PubMed] [Google Scholar]
- Wang H. Y., Wang Y. J., Zhou L. X., Zhu L., Zhang Y. Q. Food Funct. 2012;3:150–158. doi: 10.1039/c1fo10148j. [DOI] [PubMed] [Google Scholar]
- Zhao J. G., Zhang Y. Q. Food Nutr. Res. 2016;60:30932. doi: 10.3402/fnr.v60.30932. [DOI] [PMC free article] [PubMed] [Google Scholar]
- Matthews D. R., Hosker J. P., Rudenski A. S., Naylor B. A., Treacher D. F., Turner R. C. Diabetologia. 1985;28(7):412–419. doi: 10.1007/BF00280883. [DOI] [PubMed] [Google Scholar]
- Hanley A. J., Williams K., Stern M. P., Haffner S. M. Diabetes Care. 2002;25(7):1177–1184. doi: 10.2337/diacare.25.7.1177. [DOI] [PubMed] [Google Scholar]
- Li R., Liang T., Xu L., Li Y., Zhang S., Duan X. Food Chem. Toxicol. 2013;51:419–425. doi: 10.1016/j.fct.2012.10.024. [DOI] [PubMed] [Google Scholar]
- Srinivasan S., Pari L. Chem.-Biol. Interact. 2012;195(1):43–51. doi: 10.1016/j.cbi.2011.10.003. [DOI] [PubMed] [Google Scholar]
- Naso D., Cangeri F., Simões Dias A. Exp. Diabetes Res. 2011;(2011):1–6. [Google Scholar]
- Meigs J. B., Larson M. G., Fox C. S. Diabetes Care. 2007;30(10):2529–2535. doi: 10.2337/dc07-0817. [DOI] [PubMed] [Google Scholar]
- Seo C. W., Um I. C., Rico C. W., Kang M. Y. J. Agric. Food Chem. 2011;59(8):4192–4197. doi: 10.1021/jf104812g. [DOI] [PubMed] [Google Scholar]
- Wu C. H., Yen G. C. J. Agric. Food Chem. 2005;53(8):3167–3173. doi: 10.1021/jf048550u. [DOI] [PubMed] [Google Scholar]
- Roebuck K. A. Int. J. Mol. Med. 1999;4:223–230. doi: 10.3892/ijmm.4.3.223. [DOI] [PubMed] [Google Scholar]
- Visek J., Lacigova S., Cechurova D. Biomed. Pap. 2014;158(1):112–116. doi: 10.5507/bp.2012.103. [DOI] [PubMed] [Google Scholar]
- Aragno M., Mastrocola R., Medana C. Endocrinology. 2006;147(12):5967–5974. doi: 10.1210/en.2006-0728. [DOI] [PubMed] [Google Scholar]
- Arya A., Cheah S. C., Looi C. Y., Taha H., Mustafa M. R., Mohd M. A. Food Chem. Toxicol. 2012;50(11):4209–4220. doi: 10.1016/j.fct.2012.08.012. [DOI] [PubMed] [Google Scholar]
- Li S., Chen H., Wang J. Int. J. Biol. Macromol. 2015;81:967–974. doi: 10.1016/j.ijbiomac.2015.09.037. [DOI] [PubMed] [Google Scholar]
- Bevan P. J. Cell Sci. 2001;114:1429–1430. doi: 10.1242/jcs.114.8.1429. [DOI] [PubMed] [Google Scholar]
- Lee J., Kim M. S. Diabetes Res. Clin. Pract. 2007;77(3):S49–S57. doi: 10.1016/j.diabres.2007.01.033. [DOI] [PubMed] [Google Scholar]
- Srivastava A. K., Pandey S. K. Mol. Cell. Biochem. 1998;182(1–2):135–141. [PubMed] [Google Scholar]
- Cohen P., Frame S. Nat. Rev. Mol. Cell Biol. 2001;2(10):769–776. doi: 10.1038/35096075. [DOI] [PubMed] [Google Scholar]
- Hardie D. G. Endocrinology. 2003;144(12):5179–5183. doi: 10.1210/en.2003-0982. [DOI] [PubMed] [Google Scholar]
- Holman G. D., Kasuga M. J. Diabetol. 1997;40(9):991–1003. doi: 10.1007/s001250050780. [DOI] [PubMed] [Google Scholar]
- Nakae J., Biggs W. H., Kitamura T. Nat. Genet. 2002;32(2):245–253. doi: 10.1038/ng890. [DOI] [PubMed] [Google Scholar]
- Wang Q., Wang N., Dong M., Chen F., Li Z., Chen Y. Clin. Sci. 2014;127(2):91–100. doi: 10.1042/CS20130670. [DOI] [PubMed] [Google Scholar]
- Tiedge M., Richter T., Lenzen S. Arch. Biochem. Biophys. 2000;375(2):251–260. doi: 10.1006/abbi.1999.1666. [DOI] [PubMed] [Google Scholar]


