

Abstract
Objective
To evaluate Minnesota's Return to Community Initiative's (RTCI) impact on community discharges from nursing homes.
Data Sources
Secondary data were from the Minimum Data Set and RTCI staff (April 2014 – December 2016). The sample consisted of 18 444 non‐Medicaid nursing home admissions in Minnesota remaining for at least 45 days, with high predicted probability of community discharge.
Study Design
The RTCI facilitates community discharge for non‐Medicaid nursing home residents by assisting with discharge planning, transitioning to the community, and postdischarge follow‐up. A key evaluation question is how many of those transitions were directly attributable to the program. Return to Community Initiative was implemented statewide without a control group. Program impact was measured using regression discontinuity, a quasi‐experimental design approach that leverages the programs targeting model.
Principal Findings
Return to Community Initiative increased community discharge rates by an estimated 11 percent (P < 0.05) for the targeted population. The program effect was robust to time and increased with level of facility participation in RTCI.
Conclusions
The RTCI had a modest yet significant impact on the community discharge rates for its targeted population. Findings have been applied in strengthening the RTCI's targeting approach and transitioning process.
Keywords: nursing home to community transitions, program evaluation, regression discontinuity
1. INTRODUCTION
Programs promoting resident transitions from nursing homes to the community are increasingly seen as an essential component of a balanced system of long‐term services and support. Operating in 43 states, the largest and most established of these programs is the federally sponsored Money Follows the Person (MFP).1 Smaller scale transition programs have been implemented in various states including Alaska, Connecticut, Maryland, New Jersey,2, 3 and Minnesota's Return to Community Initiative (RTCI). These transition programs have common goals of promoting consumer choice, delivering care in the most appropriate setting, and achieving Medicaid cost savings. Disabled older persons often prefer living in private residences4, 5, 6, 7 and experience higher quality of life in the community.1, 5 Furthermore, home‐ and community‐based services are less expensive than institutional services on a per‐person basis.8
Despite widespread implementation of nursing home transition programs, scant evidence exists regarding their effectiveness. The research literature although diverse is insufficiently robust to answer the most pressing research questions.9 A primary focus of prior research has been the effectiveness of the program in keeping individuals in the community after nursing home discharge, and in examining outcomes such as hospitalization, readmission, and mortality.10, 11, 12, 13, 14 Less attention has been given to the question further upstream that influences the interpretation of postdischarge outcomes. Would transitioned residents have left the nursing home without the program? This question was addressed in the recent report to the President from the MFP demonstration.15 Program impact was estimated using the difference between a regression model's predicted transition rates and the realized transition rates during MFP.16 Preliminary results for MFP attribute between 25 percent and 50 percent of community transitions to the program. However, due to data reporting problems and a lack of robustness across estimation methodology, these estimates of program impact are not well supported.15
Estimating the impact of these transition programs on successful community discharge is of interest beyond MFP, for purposes such as cost savings estimation or program continuance, but it is very difficult due to the typical data structure and study design. Only one study, the evaluation of the PACT program in California, adopted a randomized control design.17 This study did not find a statistically significant program effect, but it may have been underpowered due to a small sample size.
Our objective in this study was to evaluate the impact of RTCI on community discharges for non‐Medicaid nursing home residents in Minnesota. Did it transition individuals who would not have been discharged to the community in the absence of the RTCI? Answering this question informs the evaluation of other RTCI objectives, including improved postdischarge outcomes and Medicaid cost savings. In the absence of a valid control group, we employed a regression discontinuity design to approximate experimental conditions while leveraging the existing program structure. Regression discontinuity is a powerful, but under‐utilized method in health care research.18 This paper describes our regression discontinuity design and our findings about RTCI's impact on community discharge rates.
2. MINNESOTA'S RTCI
Minnesota's RTCI is a statewide program with goals to promote consumer choice, provide care in the most appropriate setting, and achieve Medicaid cost savings. However, unlike MFP and other Medicaid‐focused transition programs, RTCI is directed to non‐Medicaid nursing home residents. It attempts to achieve cost savings indirectly by delaying or avoiding consumer spend down to Medicaid. The RTCI transitions residents earlier in their stays, many who leave the facility within 90 days of admission, before MFP's 90‐day intervention point. Although RTCI is open to all non‐Medicaid residents requesting assistance, it targets a subset of residents with low care needs and other characteristics suggesting that the community may be a more appropriate setting for care,19 but who nonetheless are at risk of a permanent nursing home stay. RTCI's targeting criteria take into account resident length of stay, expressed preference for community discharge, and a targeting score representing the resident's predicted probability of community discharge (RTCI Score). Since RTCI's inception in 2010, the number of transitions has grown steadily to approximately 1200 transitions in 2017.
The RTCI complements Moving Home Minnesota, the state's Money Follows the Person program, which serves the Medicaid population.20 Whereas the Medicaid population has access to care managers and a rich set of community services, the non‐Medicaid population has few public resources for transitioning to the community. The RTCI is designed to fill that gap. The RTCI's staff of Community Living Specialists (CLS) assists residents and family caregivers with discharge planning, transitioning to the community, and postdischarge follow‐up. Each CLS is assigned nursing homes in different regions of the state. They receive a list of targeted residents each week. The CLSs contact all targeted residents, usually 60‐90 days after admission, and they offer transition assistance if desired by the resident or family. The level of RTCI assistance varies by case. In some instances, residents required little to no assistance for discharge; they enrolled in the program in order to receive follow‐up from the RTCI staff after transitioning to the community. At other times, the CLS staff helped consumers to overcome numerous barriers to discharge. In case studies undertaken in the qualitative arm of our evaluation, consumers and CLS staff expressed the belief that they would not have returned to the community without the RTCI.21 Such variability in experience makes it clear that not all program discharges are attributable to the program.
3. EVALUATION OF RTCI
We could not rely on an experimental design in the evaluation because RTCI was launched statewide and made available to all non‐Medicaid nursing home residents. We were also limited in the choice of quasi‐experimental evaluation methods. An interrupted time series analysis proved difficult because RTCI began with a small number of discharges and slowly grew over time leaving no clear interruption time point. Moreover, other changes over this time period in state Medicaid long‐term care policy could confound the pre‐ to postevaluation of the RTCI. When we examined trends in community discharge rates between program inception in 2010 and mid‐2017, we found no discernable downward trend that could be attributed to the RTCI. Overall community discharge rates increased while mean length of stay decreased over the period, yet this change could be attributed to an increase in postacute admissions with short lengths of stay (<30 days). Community discharge rates among non‐Medicaid residents with LOS >60 days remained flat for both targeted and non‐targeted residents. We suspected that an RTCI effect on community discharges, if it occurred, would have been too small to detect with a time series analysis.
Therefore, we chose a regression discontinuity design as the best means for detecting an RTCI effect. Regression discontinuity is an established method for testing hypotheses when random assignment to experimental and control groups is not possible.22, 23, 24 Although not yet widely used in health care research, it is suitable for many studies in this setting.18 In a regression discontinuity design, the probability of assignment to a treatment increases discontinuously when a continuous “rating variable” exceeds a threshold value (known as a cut point). A regression model is fit, controlling for the rating variable, with a binary indicator for being beyond the cut point. This indicator is of primary interest as it measures the jump at the cut point or the difference between those included or not included in the experimental group. The validity of the model rests largely in the ability to view individuals near the cut point as having been randomly assigned to either side. Both parametric and nonparametric techniques can be used to fit the regression model.25 Modeling extensions also allow for some cross over between the two groups contrary to the rating variable assignment, this is known as a fuzzy design.25, 26
Our regression discontinuity analysis took advantage of RTCI's scoring system in which every nursing home admission was scored on the probability of community discharge.27 The input for the model is various health, functioning, demographic, and preference data from the Minimum Data Set (MDS) admission assessment. The output of the model is a score ranging from 0 to 98 with higher values indicating a greater propensity for community discharge. Residents with a RTCI score of 70 or greater, who also remain in the nursing home for at least 45 days, are targeted for intervention from the RTCI. Two key elements for regression discontinuity are present, the rating variable and cut point used for assignment to the intervention group.
4. METHODS
Data are from the MDS admission assessment and RTCI records. The sample consists of 18 488 Minnesota nursing home residents admitted between April 2014 and December 2016, who were non‐Medicaid at admission, and remained in the nursing home for at least 45 days. The MDS is a federally mandated assessment instrument that must be collected for all nursing home admissions regardless of payer source and is often used for reimbursement. Admission data are typically collected within the first 14 days of a stay by nursing home staff (unrelated to the RTCI). Given the length of stay requirement of the sample, there was no systematic missingness in the data. From the MDS, we obtain detailed information on residents’ health, functioning, demographics, preference for community discharge, and whether the resident discharged to the community within 120 days of admission. The RTCI data contain a unique identifier for each nursing home, resident's RTCI score (calculated solely from the MDS data), an indicator if the score was greater than or equal to 70 (targeted residents), and whether the resident was contacted by the program (see Tables 1 and S3). Of targeted residents, 14 percent were assisted by RTCI, 37 percent left the nursing home on their own, and 49 percent remained in the nursing home despite being offered RTCI assistance.
Table 1.
Checking assumption that data just above and just below the cut point are similar
| Data just below cut point | Data just above cut point | Difference P‐value | |
|---|---|---|---|
| Return to community score range | 67‐69 | 70‐72 | |
| Sample size | 838 | 1114 | |
| Age | 81 | 81 | 0.6119 |
| Female | 47% | 48% | 0.6146 |
| Unmarried | 52% | 51% | 0.8191 |
| No nursing home admissions in previous 2 y | 94% | 95% | 0.3691 |
| Admitted from acute care | 82% | 85% | 0.0533 |
| Prefers community discharge | 97% | 100% | 0.0000 |
| Medicare | 67% | 73% | 0.0059 |
| Cognitive Performance Scale Score (0‐6) | 2.4 | 2.2 | 0.0776 |
| Mental health diagnosis | 21% | 20% | 0.7766 |
| Alzheimer's/dementia diagnosis | 28% | 31% | 0.1482 |
| Chronic heart failure | 20% | 19% | 0.6387 |
| Chronic obstructive pulmonary disease | 15% | 15% | 0.7957 |
| Pneumonia | 6% | 9% | 0.0189 |
| Tube fed | 13% | 9% | 0.0172 |
| Catheter | 15% | 14% | 0.5584 |
| Pressure sore | 12% | 10% | 0.2727 |
| Diabetes | 30% | 30% | 0.7272 |
| Depressed | 28% | 29% | 0.4781 |
| Weekly behavior problems | 23% | 19% | 0.0275 |
| Incontinence | 68% | 67% | 0.6975 |
| Cancer | 16% | 17% | 0.7572 |
| End stage of disease | 1% | 1% | 0.2932 |
| Activities of Daily Living Rug IV (0‐16) | 9.8 | 9.8 | 0.8979 |
| Rehab Rug IV | 80% | 91% | 0.0000 |
P‐values from a Fisher's exact test for binary variables and a two sample t test for continuous variables testing for differences between the sample halves. Lack of differences supports the assumption of random assignment for program participation. RUG stands for Resource Utilization Group.
Analysis was performed using R version 3.3.3.28 Data were visualized using scatterplots with percentage of community discharges at each discharge score. Relationships were smoothed using the loess function with a span of two.29 Manipulation of the rating variable was checked using a histogram and the McCrary test.30 Integrity of the RDD design was checked using a scatterplot of the probability of contact from the program (treatment) and the RTCI score (rating variable). Parametric regression discontinuity models were fit using the systemfit package and ivreg package, while nonparametric models were fit using the rdd package.31, 32, 33 Regression standard errors were adjusted using the methods of Lee and Card to account for the discrete rating variable.34 Optimal discharge score bandwidth for parametric models was calculated using Mahalanobis distance between the two samples halves based on health and functioning characteristics.
Typically, regression discontinuity uses a continuous variable as the outcome. Discharge to the community is a binary outcome. Although some work has been done to adapt regression discontinuity to the binary setting, we are not aware of work extending this approach to the fuzzy design setting.35 Therefore, the use of existing software requires the adoption of a linear probability model. The linear probability model is generally considered inferior to one that uses a link function, such as logistic or probit regression, because it allows for probabilities greater than one and less than zero. However, by restricting the modeling to local data around the cut point, where regression discontinuity is most valid, problems with tail probabilities are avoided.22
The treatment is conceptualized as receiving contact from the RTCI staff to solicit participation. Some individuals with a RTCI score below the cut point were contacted due to referrals to the program, and some individuals with an eligible score were not contacted (i.e, had already discharged to the community or died). Referrals account for 2 percent of those contacted by the RTCI. To account for the non‐compliance, an instrumental variable approach was adopted using the probability of contact based on the RDD as the instrument and the actual program contact as the exposure variable. This means that the program effect estimate is the Local Average Treatment Effects (LATE).36 Estimation was done using two‐stage least squares. Models also controlled for the rating variable (RTCI score) and a facility fixed effect.
Sensitivity analyses were performed with respect to time interval, RTCI score interval, local regression kernel bandwidth for nonparametric models, the inclusion of facility intercepts, functional relationship for parametric models, and by facility program participation levels. All equal width score intervals from 41‐98 to 69‐70 were considered in the choice of local data. The inclusion of facility intercepts was examined to assess the impact of controlling for correlation of resident outcomes within facilities. Both linear and quadratic functional forms were examined for parametric models. Facility participation was calculated as the number of residents discharged to the community through RTCI divided by the number of eligible residents (RTCI score ≥70 and length of stay ≥45 days) in a facility. Participation is a proxy for the strength of relationship between a facility and the program. Results include all facilities regardless of participation. Sensitivity analysis includes some subsetting by facility participation in order to estimate if program impact changes by level of facility involvement.
5. RESULTS
The first step in our regression discontinuity analysis was to validate the design and check the rating variable for manipulation. Figure 1 displays the relationship between contact from the program (treatment) and RTCI score (rating variable). The 48 percent increase in probability of contact at the cut point indicates that the rating variable was used by the RTCI staff to seek out residents for contact from the program (albeit in a fuzzy manner). Supplemental Figure S1 displays the histogram of the RTCI score. There appears to be no heaping or concentration of values just past the cut point and, thus, no evidence of discontinuity in the density. The McCrary test failed to reject the null of no manipulation (P = 0.1191). This is not surprising because the MDS data are collected by nursing home staff who have no need to manipulate the data on discharge preferences. The nursing home staff can refer individuals to the program directly regardless of RTCI score.
Figure 1.
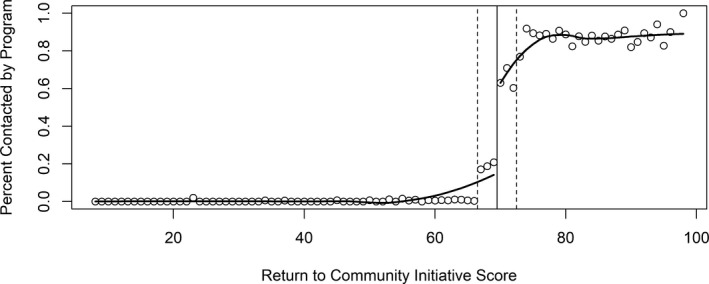
Validating regression discontinuity design—probability treatment increases above cut point
The next step was to visualize the relationship between the rating variable and the outcome about the cut point (Figure 2). The x‐axis gives the RTCI score or rating variable with a dashed vertical line near the cut point. The scatter points on the plot give the percentage of residents in the sample who discharged to the community for each RTCI score. The two solid lines are local regression smoothers (loess) and are included to clarify trend. The small jump near the cut point indicates the possibility of a positive program effect. However, not all facilities in the state participate to the same degree. It is hypothesized that if a program effect is present, it is not equal across all facilities. Figure 3 displays the same relationship for subsets of the data by facility participation. This figure indicates the potential for a larger program effect for facilities working more closely with RTCI, as might be expected.
Figure 2.
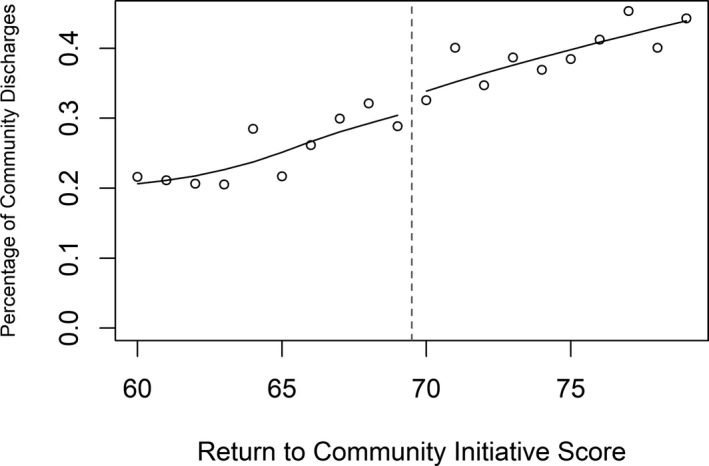
Small jump in probability of community discharge above cut point
Figure 3.
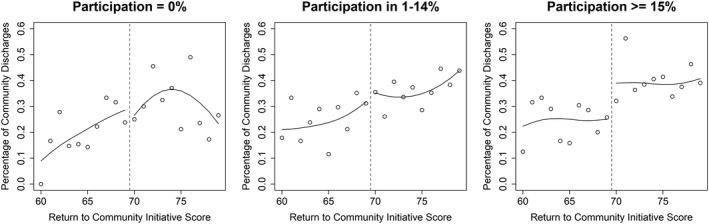
Jump in probability of community discharge for facilities who discharge a relatively high number of eligible residents through program
Before fitting any models, it is necessary to decide what local range of the rating variable is likely to give the most reliable estimate of the program effect. The estimate is most reliable when the residents included in either sample half are similar. In which case their assignment to treatment or not can be viewed as random. Supplemental Figure S2 shows the Mahalanobis distance between the sample halves’ characteristics for various ranges of RTCI scores. Differences between health, functioning, and demographic characteristics are collectively minimized at a range of 67‐72. Table 1 displays the average characteristics for each sample half and P‐values from either a Fisher's exact test or t test for mean differences. Although the characteristics are similar, some significant differences persist. Individuals in the 70‐72 range for RTCI score were more likely to be admitted from acute care, prefer community discharge at admission, qualify for Medicare, have a pneumonia diagnosis, and have a RUG IV rehab code. They were less likely to be tube fed or have weekly behavior problems. Nonetheless, inclusion of these variables in subsequent models did not change statistical significance and marginally impacted program effect estimates (0.7 percent change).
Table 2 compares parametric and nonparametric model estimates for the program effect. In both cases, given the use of instrumental variables to accommodate the fuzzy design (or non‐compliance), these are the LATE of the program. For the parametric models, we assume a linear relationship between the RTCI score and the probability of community discharge. Additionally, facility fixed effects are included to account for the disparity in community discharge rates among facilities or clustering that occurs among residents within a facility. Equations are given in the supplemental material. The estimate in bold is the chosen estimate of the program's impact on community discharge rates, an increase of 11.2 percent for the targeted population. This estimate was chosen as the data used best support the assumption of random assignment about the cut point.
Table 2.
Estimates of program impact on community discharge rates
| Parametric model | Nonparametric model | ||||
|---|---|---|---|---|---|
| Return to community initiative score range | Program effect | P‐value | Kernel bandwidth | Program effect | P‐value |
| 69‐70 | 0.113 | 0.0043 | 1 | 0.088 | 0.0000 |
| 68‐71 | 0.088 | 0.0160 | 2a | 0.168 | 0.0000 |
| 67‐72b | 0.112b | 0.0000b | 3 | 0.178 | 0.0000 |
| 66‐73 | 0.106 | 0.0000 | 4 | 0.128 | 0.0003 |
| 65‐74 | 0.105 | 0.0000 | 5 | 0.108 | 0.0412 |
| 64‐75 | 0.096 | 0.0000 | 6 | 0.086 | 0.1988 |
| 63‐76 | 0.082 | 0.0000 | 7 | 0.086 | 0.1688 |
| 62‐77 | 0.083 | 0.0000 | 8 | 0.066 | 0.2719 |
| 61‐78 | 0.078 | 0.0000 | 9 | 0.059 | 0.2969 |
| 60‐79 | 0.081 | 0.0000 | 10 | 0.056 | 0.2798 |
| 59‐80 | 0.087 | 0.0000 | 11 | 0.057 | 0.2181 |
| 58‐81 | 0.089 | 0.0000 | 12 | 0.056 | 0.1909 |
| 57‐82 | 0.085 | 0.0000 | 13 | 0.057 | 0.1450 |
| 56‐83 | 0.079 | 0.0000 | 14 | 0.054 | 0.1241 |
| 55‐84 | 0.080 | 0.0000 | 15 | 0.052 | 0.1089 |
| 54‐85 | 0.074 | 0.0000 | 16 | 0.048 | 0.1158 |
| 53‐86 | 0.068 | 0.0000 | 17 | 0.042 | 0.1451 |
| 52‐87 | 0.066 | 0.0000 | 18 | 0.038 | 0.1647 |
| 51‐88 | 0.064 | 0.0000 | 19 | 0.035 | 0.1931 |
| 50‐89 | 0.062 | 0.0000 | 20 | 0.031 | 0.2236 |
| 49‐90 | 0.063 | 0.0000 | 21 | 0.029 | 0.2471 |
| 48‐91 | 0.063 | 0.0000 | 22 | 0.027 | 0.2652 |
| 47‐92 | 0.064 | 0.0000 | 23 | 0.026 | 0.2712 |
| 46‐93 | 0.064 | 0.0000 | 24 | 0.026 | 0.2624 |
Parametric models fit with facility effects and assuming a linear relationship between Return to Community Initiative (RTCI) Score and probability of community discharge. All facilities are included in the analysis.
Optimal kernel bandwidth.
Chosen model result. Nonparametric models fit without facility effects using RTCI data range of 46‐93.
In order to examine the stability of this estimate, several sensitivity tests were run. The choice of data range about the cut point, although made systematically, is likely to have an impact. Models for a variety of ranges were fit and estimates given in Table 2. Increasing the data range does not impact the statistical significance of the estimate, but does decrease the size of the estimate. The wider data ranges, however, are less likely to support the assumption of random assignment about the cut point.
The second half of Table 2 gives estimates for the program effect using a nonparametric model which utilizes local regression. A key decision impacting this model is the selection of the smoothing kernel bandwidth. Larger values are less sensitive to random fluctuations in the data providing a smoother estimate for the trend. Models were fit for a range of kernel bandwidths with the optimal model (bandwidth of 2) selected according to the method of Imbens and Kalyanaraman.37 The optimal nonparametric model has a noticeably higher program effect estimate of a 16.8 percent increase in the community discharge rate for the targeted population. Upon visualizing this fit, however, the higher estimate is likely due to the nonparametric model's sensitivity to the final point prior to the cut point making it less credible than the parametric estimates. This visualization is given in Figure S3 in the supplemental material.
Additional sensitivity analyses were run for both models with results in Table S1 for the parametric model and Table S2 for the nonparametric model, both given in the supplemental material. For the parametric model, excluding the facility effect and assuming a quadratic relationship between the RTCI score and probability of community discharge had minimal effect on the modeling results. Estimates of program impact varied from 9.0 percent in 2014, 15.8 percent in 2015, and 11.5 percent in 2016, but were statistically significant in all three periods. Also, we found differences in impact estimates by level of facility participation (15.1 vs. 10.1 percent), which is consistent with our hypothesis that RTCI would have a greater impact in high participation facilities. Sensitivity results were similar for the nonparametric model, although variation across time and participation were much higher, likely due to the model's susceptibility to being over influenced by the data just prior to the cut point.
6. DISCUSSION
The best estimate from our analysis is that RTCI increased by 11.2 percent the community discharge rate for the targeted population of non‐Medicaid nursing home residents in Minnesota. Our parametric models yielded consistent results. Estimates of RTCI impact were statistically significant and reasonably stable for data ranges most valid for inference. The nonparametric models tended to be overly optimistic at optimal data ranges due to the disproportionate influence of the data at the RTCI score just prior to the cut point.
The use of a fuzzy design was necessary because referrals to the RTCI who were below the cut point and because of targeted residents who left prior to RTCI intervention. The fuzzy design has less statistical power than a sharp design in detecting an effect, which in turn has less statistical power than an experimental design. Nonetheless, the program's impact on community discharge was sufficiently large to produce a statistically significant effect.
Variation in program impact between years could be due to random fluctuation. The estimates for 2014 and 2015 were during a period of program expansion and maturation. Of the annual models, the estimate of 11.5 percent in 2016 is probably most representative of a stable program effect.
Our evaluation was limited in several ways. First, the estimated effect is the local average treatment effect which may not represent the entire population of interest.38 The effect of the program may vary for residents further away from the cut point such that the true overall program effect differs from our estimate. Second, the generalizability of results is restricted because RTCI takes place in Minnesota and it deals with a population of non‐Medicaid residents. Minnesota is a unique context for studying transitions to the community. For example, Minnesota is a rate equalization state (i.e, nursing homes cannot charge private pay prices above the Medicaid rate), has a relatively high number of qualified social workers on staff in nursing homes, and has a highly rated long‐term services and supports system.21
Our findings have practical value. A credible estimate of the RTCI's impact on nursing home use is helpful to justify program continuance and to inform its improvement. Additionally, our findings can be used in evaluating the program's impact on overall Medicaid expenditures, which is left for future work. Importantly, the results of the study can be applied to program improvement. Observed differences in level of participation and effectiveness across facilities represent learning opportunities. Facilities where the highest impact is being generated may help inform best practices. In particular, these facilities may shed light on the type of nursing homes and communities in which the program is most effective, and how the RTCI‐facility relationship is best cultivated. Second, facilities with low participation are likely to contain some untapped potential for program expansion. The subset of low impact facilities that are similar to high impact facilities in every respect aside from participation may indicate low hanging fruit for program expansion. It is worth noting that there are facilities in which increased participation is unlikely. For example, several nursing homes focusing on postacute short stays appear very adept at discharging most of their residents to the community. These facilities tend to use RTCI sparingly, presumably for more difficult or atypical cases.
A third recommendation concerns more refined targeting by considering variables unmeasured in the current scoring system. A large information gap exists in areas such as social and economic resources, family and caregiver relationships, and capabilities of the nursing home staff to effectively discharge the resident without RTCI assistance. Because these data are not routinely collected for residents at admission, we recommended a secondary screening of targeted residents, as well as non‐targeted resident referred by the facility or seeking assistance on their own. The screen performed by the CLS in conjunction with nursing home staff would further document the need for RTCI assistance. It would identify individuals who had a high propensity for community discharge because of their health conditions and functional status, yet lacked the social resources or economic resources to achieve a successful transition on their own.
Finally, we should point out that our evaluation appears to be the first to show a significant impact on community transitions of nursing home residents at the state level. Similar to the Minnesota program, other programs may lack a readily identifiable comparison group. The regression discontinuity design can be particularly useful in cases such as ours where an experimental or another quasi‐experimental design is not feasible. The idea of improving effectiveness of a discharge program through targeting is not unique to RTCI.20, 39, 40 This approach may also be used for any nursing home discharge program that utilizes a targeting model similar to the RTCI score and desires to assess impact.
In this paper, we have demonstrated a robust and significant estimate of the impact of RTCI on transitioning non‐Medicaid residents to the community. Using our findings, we give recommendations for program improvement. We hope this work serves as an accessible example of using regression discontinuity to evaluate nursing home discharge programs.
Supporting information
ACKNOWLEDGMENTS
Joint Acknowledgment/Disclosure Statement: This project was supported by grant number R18HS020224 from the Agency for Healthcare Research and Quality and in collaboration with the Minnesota Department of Human Services. The content is solely the responsibility of the authors and does not necessarily represent the official views of the Agency for Healthcare Research and Quality or the Minnesota Department of Human Services. David Grabowski serves as a paid consultant to Precision Health Economics, Vivacitas, and CareLinx. Dr Grabowski also serves on the Scientific Advisory Committee for NaviHealth. Zachary Hass serves as a paid consultant to Intuitive Surgical. No Other Disclosures.
Hass Z, Woodhouse M, Grabowski DC, Arling G. Assessing the impact of Minnesota's return to community initiative for newly admitted nursing home residents. Health Serv Res. 2019;54:555–563. 10.1111/1475-6773.13118
REFERENCES
- 1. Coughlin R, Ward J, Denny‐Brown N, et al. Money Follows the Person Demonstration: Overview of State Grantee Progress, January to December 2016. Cambridge, MA: Mathematica Policy Research; 2017. [Google Scholar]
- 2. Morley LA. Nursing Facility Transition Program. http://dhss.alaska.gov/dsds/Pages/nursing/default.aspx. Accessed May 2, 2018.
- 3. Dube N. Long‐Term Care Rebalancing in Other States. Connecticut General Assembly; February 2, 2009. 2009‐R‐0042.
- 4. Harrell R, Lynott J, Guzman S, Lampkin C. What is Livable? Community Preferences of Older Adults. Washington, D.C.: AARP Public Policy Institute; 2014. [Google Scholar]
- 5. Robison J, Porter M, Shugrue N, Kleppinger A, Lambert D. Connecticut's ‘money follows the person’ yields positive results for transitioning people out of institutions. Health Affair. 2015;34(10):1628‐1636. [DOI] [PubMed] [Google Scholar]
- 6. Wiles JL, Leibing A, Guberman N, Reeve J, Allen RES. The meaning of “aging in place” to older people. Gerontologist. 2012;52(3):357‐366. [DOI] [PubMed] [Google Scholar]
- 7. Robison J, Shugrue N, Fortinsky RH, Gruman C. Long‐term supports and services planning for the future: implications from a statewide survey of Baby Boomers and older adults. Gerontologist. 2014;54(2):297‐313. [DOI] [PubMed] [Google Scholar]
- 8. Kaye HS, LaPlante MP, Harrington C. Do noninstitutional long‐term care services reduce medicaid spending? Health Affair. 2009;28(1):262‐272. [DOI] [PubMed] [Google Scholar]
- 9. Freeman S, Bishop K, Spirgiene L, et al. Factors affecting residents transition from long term care facilities to the community: a scoping review. Bmc Health Serv Res. 2017;17:689. [DOI] [PMC free article] [PubMed] [Google Scholar]
- 10. Bardo AR, Applebaum RA, Kunkel SR, Carpio EA. Everyone's talking about it, but does it work? Nursing home diversion and transition. J Appl Gerontol. 2014;33(2):207‐226. [DOI] [PubMed] [Google Scholar]
- 11. Delate T, Chester EA, Stubbings TW, Barnes CA. Clinical outcomes of a home‐based medication reconciliation program after discharge from a skilled nursing facility. Pharmacotherapy. 2008;28(4):444‐452. [DOI] [PubMed] [Google Scholar]
- 12. Howell S, Silberberg M, Quinn WV, Lucas JA. Determinants of remaining in the community after discharge: results from New Jersey's Nursing Home Transition Program. Gerontologist. 2007;47(4):535‐547. [DOI] [PubMed] [Google Scholar]
- 13. Toles M, Anderson RA, Massing M, et al. Restarting the cycle: incidence and predictors of first acute care use after nursing home discharge. J Am Geriatr Soc. 2014;62(1):79‐85. [DOI] [PMC free article] [PubMed] [Google Scholar]
- 14. Wysocki A, Kane RL, Dowd B, Golberstein E, Lum T, Shippee T. Hospitalization of elderly Medicaid long‐term care users who transition from nursing homes. J Am Geriatr Soc. 2014;62(1):71‐78. [DOI] [PubMed] [Google Scholar]
- 15. Hargan ED. Report to the President and Congress: The Money Follows the Person (MFP) Rebalancing Demonstration. Services HaH, ed2017.
- 16. Irvin CV, Alex B, Stewart K, et al. Money Follows the Person 2015 Annual Evaluation Report. Cambridge, MA: Mathematic Policy Research; 2017. [Google Scholar]
- 17. Newcomer R, Kang T, Graham C. Outcomes in a nursing home transition case‐management program targeting new admissions. Gerontologist. 2006;46(3):385‐390. [DOI] [PubMed] [Google Scholar]
- 18. Venkataramani AS, Bor J, Jena AB. Regression discontinuity designs in healthcare research. BMJ. 2016;352:i1216. [DOI] [PMC free article] [PubMed] [Google Scholar]
- 19. Mor V, Zinn J, Gozalo P, Feng Z, Intrator O, Grabowski DC. Prospects for transferring nursing home residents to the community. Health Aff (Millwood). 2007;26(6):1762‐1771. [DOI] [PubMed] [Google Scholar]
- 20. Hass Z, Woodhouse M, Kane R, Arling G. Modeling community discharge of medicaid nursing home residents: implications for money follows the person. Health Serv Res. 2018;53:2787‐2802. [DOI] [PMC free article] [PubMed] [Google Scholar]
- 21. Kane RA, Davila H, Shippee T, Abrahamson K. Housing and assisted living issues for non‐Medicaid nursing home residents returning to the community. Seniors Hous Care J. 2016;24(1):106‐120. [Google Scholar]
- 22. McCall BP, Bielby RM. Regression discontinuity design: recent developments and a guide to practice for researchers in higher education In: Smart J, Paulsen M, eds. Higher Education: Handbook of Theory and Research. Vol 27. Dordrecht: Springer; 2012. [Google Scholar]
- 23. Jacob R, Zhu P, Somers M, Bloom H. A Practical Guide to Regression Discontinuity. New York, NY: MDRC; 2012. [Google Scholar]
- 24. Thistlethwaite DL, Campbell DT. Regression‐discontinuity analysis ‐ an alternative to the ex‐post‐facto experiment. J Educ Psychol. 1960;51(6):309‐317. [Google Scholar]
- 25. Hahn JY, Todd P, Van der Klaauw W. Identification and estimation of treatment effects with a regression‐discontinuity design. Econometrica. 2001;69(1):201‐209. [Google Scholar]
- 26. Clark D, Martorell P. The signaling value of a high school diploma. J Polit Econ. 2014;122(2):282‐318. [Google Scholar]
- 27. Arling G, Kane RL, Cooke V, Lewis T. Targeting residents for transitions from nursing home to community. Health Serv Res. 2010;45(3):691‐711. [DOI] [PMC free article] [PubMed] [Google Scholar]
- 28. R Foundation for Statistical Computing . R: A Language and Environment for Statistical Computing [Computer Program]. Vienna, Austria: R Foundation for Statistical Computing; 2017. [Google Scholar]
- 29. Cleveland WS, Grosse E, Shyu WM. Local regression models. Stat Models S. 1992;2:309‐376. [Google Scholar]
- 30. McCrary J. Manipulation of the running variable in the regression discontinuity design: a density test. J Econometrics. 2008;142(2):698‐714. [Google Scholar]
- 31. RDD: Regression Discontinuity Estimation [computer program]. Version 0.57: R; 2016.
- 32. Henningsen A, Hamann JD. Systemfit: a package for estimating systems of simultaneous equations in R. J Stat Softw. 2007;23(4):555‐40. [Google Scholar]
- 33. Kleiber C, Zeileis A. Applied Econometrics with R. 2008.
- 34. Lee DS, Card D. Regression discontinuity inference with specification error. J Econometrics. 2008;142(2):655‐674. [Google Scholar]
- 35. Xu KL. Regression discontinuity with categorical outcomes. J Econometrics. 2017;201(1):555‐18. [Google Scholar]
- 36. Bor J, Fox MP, Rosen S, et al. Treatment eligibility and retention in clinical HIV care: a regression discontinuity study in South Africa. PLoS Med. 2017;14(11):e1002463. [DOI] [PMC free article] [PubMed] [Google Scholar]
- 37. Imbens G, Kalyanaraman K. Optimal bandwidth choice for the regression discontinuity estimator. Rev Econ Stud. 2012;79(3):933‐959. [Google Scholar]
- 38. Imbens GW, Lemieux T. Regression discontinuity designs: a guide to practice. J Econometrics. 2008;142(2):615‐635. [Google Scholar]
- 39. Fries BE, James ML. Beyond section Q: prioritizing nursing home residents for transition to the community. Bmc Health Serv Res. 2012;12:186‐197. [DOI] [PMC free article] [PubMed] [Google Scholar]
- 40. Gassoumis ZD, Fike KT, Rahman AN, Enguidanos SM, Wilber KH. Who transitions to the community from nursing homes? Comparing patterns and predictors for short‐stay and long‐stay residents. Home Health Care Serv Q. 2013;32(2):75‐91. [DOI] [PMC free article] [PubMed] [Google Scholar]
Associated Data
This section collects any data citations, data availability statements, or supplementary materials included in this article.
Supplementary Materials