

Abstract
Please cite this paper as: Greene et al. (2012) Patterns in influenza antiviral medication use before and during the 2009 H1N1 pandemic, Vaccine Safety Datalink Project, 2000‐2010. Influenza and Other Respiratory Viruses 6(601), e143–e151.
Background U.S. recommendations for using influenza antiviral medications changed in response to viral resistance (to reduce adamantane use) and during the 2009 H1N1 pandemic (to focus on protecting high‐risk patients). Little information is available on clinician adherence to these recommendations. We characterized population‐based outpatient antiviral medication usage, including diagnosis and testing practices, before and during the pandemic.
Methods Eight medical care organizations in the Vaccine Safety Datalink Project provided data on influenza antiviral medication dispensings from January 2000 through June 2010. Dispensing rates were explored in relation to changes in recommendations and influenza diagnosis and laboratory testing frequencies. Factors associated with oseltamivir dispensings in pandemic versus pre‐pandemic periods were identified using multivariable logistic regression.
Results Antiviral use changed coincident with recommendations to avoid adamantanes in 2006, to use alternatives to oseltamivir in 2008, and to use oseltamivir during the pandemic. Of 38,019 oseltamivir dispensings during the pandemic, 31% were to patients not assigned an influenza diagnosis, and 97% were to patients not tested for influenza. Oseltamivir was more likely to be dispensed in pandemic versus pre‐pandemic periods to patients <25 years old and to those with underlying conditions, including chronic pulmonary disease or pregnancy (P < 0·0001 for each factor in multivariable analysis).
Conclusions Antiviral medication usage patterns suggest that clinicians followed recommendations to change antiviral prescribing based on resistance and to focus on high‐risk patients during the pandemic. Medications were commonly dispensed to patients without influenza diagnoses and tests, suggesting that antiviral dispensings may offer useful supplemental data for monitoring influenza incidence.
Keywords: antiviral agents, human, influenza, oseltamivir, pandemics, physician’s practice patterns
Introduction
Antiviral medications are important tools for influenza control. 1 They complement annual vaccination, which remains the primary strategy to prevent influenza infection. Licensed influenza antiviral medications include neuraminidase inhibitors, specifically oseltamivir and zanamivir. The adamantanes (i.e., amantadine and rimantadine) were also used historically, before widespread resistance to these antivirals emerged, beginning in 2006, 2 , 3 and may remain useful for certain clades of the influenza A (H5N1) virus. 4
National recommendations for the use of antiviral agents have changed during the past decade in response to viral resistance 2 , 3 and the 2009 emergence of a novel influenza A (H1N1) virus. 5 Few data are available on the extent to which antiviral use has changed in association with these events. Examining patterns of antiviral use can reveal how closely clinicians have followed recommendations to reduce the use of adamantanes and to focus on protecting high‐risk patient groups. The aims of this study were to determine population‐based outpatient usage rates of influenza antiviral medications from January 2000 through June 2010 and to characterize diagnosis and testing practices for treated patients. For insight into how clinicians modified treatment practices during the pandemic, a period when new risk factors for severe influenza‐associated disease were identified and recommendations evolved, we also aimed to identify factors associated with oseltamivir dispensings during the 2009 H1N1 pandemic compared with pre‐pandemic influenza seasons.
Methods
Study population
The Vaccine Safety Datalink (VSD) Project is a collaboration between the U.S. Centers for Disease Control and Prevention (CDC), America’s Health Insurance Plans, and participating medical care organizations (MCOs). 6 VSD routinely collects vaccination and medical care data on enrollees, including age, sex, dates and types of vaccines administered, dates of medical encounters occurring in clinic, emergency department (ED), and hospital settings, and International Classification of Diseases, Ninth Revision, Clinical Modification (ICD‐9‐CM) diagnosis codes assigned to these medical encounters.
Ancillary data files were created to support VSD influenza surveillance activities. A pharmacy file captured claims filled in the outpatient setting for influenza antiviral medications. Medications were identified using National Drug Codes, and for each dispensing, the date, the number of days supplied, and number of units were recorded. Only those influenza antiviral dispensings to patients enrolled in their MCO for the 7 days prior through the 42 days following the dispensing were retained for analysis. A testing file captured influenza laboratory test orders. For each laboratory test, the date, test type [i.e., rapid antigen detection test, reverse transcription polymerase chain reaction (RT‐PCR) assay, direct immunofluorescence assay (DFA) or immunofluorescence assay (IFA), or viral tissue culture], and test result were recorded. One MCO was excluded from analyses of influenza testing because it prospectively tested patients by RT‐PCR for influenza vaccine effectiveness studies, 7 and study test results were unavailable for the VSD testing file.
Eight MCOs, covering over 9 million members, provided data on outpatient influenza antiviral dispensings with varying start times through June 30, 2010: from January 1, 2000, HealthPartners Research Foundation (Minnesota), Marshfield Clinic Research Foundation (Wisconsin), and Kaiser Permanente of Northern California; from January 1, 2001, Group Health Cooperative (Washington); from January 1, 2006, Kaiser Permanente of Southern California; and from January 1, 2007, Harvard Vanguard Medical Associates and Harvard Pilgrim Health Care (Massachusetts), Kaiser Permanente of Colorado, and Kaiser Permanente Northwest (Oregon). Institutional review boards at each MCO approved the study.
Medications
Neuraminidase inhibitors are administered twice daily for 5 days for treatment and once daily for 7 8 or 10 days 9 , 10 for prophylaxis. Oseltamivir dispensings for ≥12‐year‐olds were classified as for treatment if they met the following three criteria: (1) 5‐day supply; (2) 10 units dispensed, and (3) a medical care visit 0–2 days prior to dispensing (to exclude stockpiled medications). Oseltamivir dispensings for <12‐year‐olds were classified as for treatment if they met criteria (1) and (3). Criterion (2) was not applied for the oral suspension used by children because the number of units dispensed (in milliliters, milligrams, or capsules) can be difficult to interpret; weight‐based dosing was further complicated by a shortage of several oseltamivir formulations in the autumn of 2009, 11 prompting pharmacies to compound their capsule dosages into syrup formulations. Zanamivir dispensings were classified as for treatment if they met the same criteria as those for oseltamivir dispensings for ≥12‐year‐olds, except criterion (2) was modified to: 20 units dispensed, because one zanamivir dose consists of two blister inhalations.
Oseltamivir dispensings for ≥12‐year‐olds were classified as for prophylaxis if they met the following two criteria: (a) 6–10 day supply, and (b) 1 unit dispensed per day. Oseltamivir dispensings for <12‐year‐olds were classified as for prophylaxis if they met criterion (a). Zanamivir dispensings were classified as for prophylaxis if they met the same criteria as those for oseltamivir dispensings for ≥12‐year‐olds, except criterion (b) was modified to: 2 units dispensed per day.
Adamantane dispensings were classified as for treatment if they were a 5–7‐day supply, and the patient had a medical care visit 0–2 days prior to dispensing. Adamantane dispensings were classified as for prophylaxis if they were an 8–14‐day supply.
In a secondary analysis, the treatment classification was broadened to include “telephone/stockpiling” dispensings to patients without a recent medical care visit. Although some of these dispensings may reflect personal stockpiling, 12 other dispensings were at two MCOs that had established formal telephone dispensing protocols for antiviral treatment. Dispensings that did not meet the criteria for treatment or prophylaxis were excluded.
Descriptive analyses
Dispensings for treatment purposes of each of the four medications were plotted over time in relation to changes in national treatment guidelines. The unit of analysis was dispensing, and instances of more than one dispensing of any medication on different days to the same patient were treated independently. To compare with local influenza activity, trends in dispensing rates at each MCO were compared with the percentage of positive influenza tests from the National Respiratory and Enteric Virus Surveillance System (NREVSS). NREVSS data were used at two geographic resolutions: local (from laboratories located within 200 miles of each MCO) and regional (for states grouped into the 10 U.S. Department of Health and Human Services regions 13 ). Pearson correlation coefficients were calculated to assess the correspondence in timing between weekly antiviral dispensings for treatment and positive influenza tests.
Further analyses were restricted to oseltamivir dispensings for treatment purposes, as this was the most commonly used medication. Dispensings from April 26, 2009 14 through June 30, 2010 were considered to be related to the 2009 H1N1 pandemic. Dispensings from January 1, 2000 through April 25, 2009 were considered pre‐pandemic treatment. Clinical practices related to these dispensings were assessed, including the setting of the medical visit prior to the dispensing, the frequency of influenza diagnosis (ICD‐9‐CM 487‐488) and influenza laboratory testing in the 0–7 days prior to the dispensing, and the results of these laboratory tests. During the pandemic, to describe the frequency of oseltamivir treatment in patients during the usual period after which an immunologic response to inactivated vaccine is first measured, we also assessed the frequency of monovalent inactivated influenza H1N1 vaccine receipt >14 days prior to the dispensing.
Factors associated with oseltamivir treatment during versus before the 2009 H1N1 pandemic
Factors associated with oseltamivir dispensings in the pandemic versus pre‐pandemic periods were identified using unconditional multivariable logistic regression (SAS, version 9.2, SAS Institute Inc., Cary, NC, USA). For these analyses, we considered the pre‐pandemic period to be January 1, 2007 through April 25, 2009, defining a period when all MCOs contributed data and when oseltamivir was more commonly used than the adamantanes. Population demographics and prevalence of underlying conditions in VSD did not meaningfully change during the pre‐pandemic and pandemic periods, so only oseltamivir dispensings, not population denominators, were included for efficiency.
Sixteen covariates were included in logistic regression models: MCO, sex, age (0–4, 5–9, 10–14, 15–19, 20–24, 25–49, 50–64, and ≥65 years), 12 underlying conditions reflecting possible risk factors for influenza complications 1 with ICD‐9‐CM diagnoses in the prior year (chronic pulmonary disease, diabetes, other metabolic disease, chronic cardiovascular disease, immunosuppressive disorder, neurological/musculoskeletal disease, chronic renal disease, malignancy, liver disease, cerebrovascular disease, hemoglobinopathy, and Kawasaki’s disease), and pregnancy (defined as ICD‐9‐CM codes for delivery in the 40 weeks following the dispensing, for preterm delivery in the following 35 weeks, for stillbirth in the following 30 weeks, or for spontaneous or therapeutic abortion in the following 15 weeks). To explore a possible interaction effect suggested by preliminary analyses, a second regression model was constructed with an interaction term for age and chronic pulmonary disease.
Results
Purpose of dispensings
During the study period, 66 698 courses of antiviral medications for treatment purposes were dispensed within VSD MCOs, most commonly oseltamivir (Table 1). Of 83 239 oseltamivir dispensings, 59·4% were considered to be for treatment, 20·4% for telephone/stockpiling, and 8·1% for prophylaxis (Table 1).
Table 1.
Influenza antiviral dispensings by medication and purpose, Vaccine Safety Datalink Project, January 1, 2000 through June 30, 2010
| Treatment n (%) | Telephone‐Stockpile n (%) | Prophylaxis n (%) | Other n (%)* | Total n | |
|---|---|---|---|---|---|
| Oseltamivir | 49 470 (59·4) | 16 981 (20·4) | 6776 (8·1) | 10 012 (12·0) | 83 239 |
| Zanamivir | 908 (54·1) | 397 (23·7) | 181 (10·8) | 191 (11·4) | 1677 |
| Rimantadine | 1168 (27·2) | 908 (21·2) | 1839 (42·9)** | 373 (8·7) | 4288 |
| Amantadine | 15 152 (16·4) | 5205 (5·6) | 5370 (5·8) | 66 746 (72·2) | 92 473 |
| Total | 66 698 | 23 491 | 14 166 | 77 322 | 181 677 |
*Analyses of the “other” amantadine dispensings suggested that they were for non‐influenza purposes, with 52% given to patients with Parkinson’s disease 26 (ICD‐9‐CM 332), 27% to patients with multiple sclerosis 27 (340), 2% to patients with attention deficit disorder 28 (314·0), and 0·5% to patients with Huntington’s chorea 29 (333·4). Review of characteristics of “other” dispensings for oseltamivir, zanamivir, and rimantadine did not suggest a predominant pattern or clinical indication.
**This high percentage of rimantadine dispensings for prophylaxis was mainly due to one medical care organization that recommended rimantadine prophylaxis during the 2004–2005 influenza season, a period with intense influenza circulation as well as an influenza vaccine shortage.
Trends over time
Dispensing rates of antiviral medications for treatment purposes were consistent with changes in national treatment guidelines (Figure 1). Amantadine was the most commonly used antiviral from 2000 until January 2006, at which time CDC reported that 91% of influenza A (H3N2) virus strains tested during the 2005–2006 season were resistant to amantadine and rimantadine and that neither medication should be used. 2 Oseltamivir then became the most commonly used antiviral until December 2008. At that time, CDC reported that 98% of influenza A (H1N1) virus strains tested during the 2008–2009 season were resistant to oseltamivir and that treatment for influenza type A virus infections, or if virus type was unknown, should include zanamivir or a combination of oseltamivir and an adamantane. 3 Antiviral use then remained low until the emergence of the pandemic influenza A (H1N1) virus in 2009. The pandemic strain was oseltamivir‐susceptible, oseltamivir was again recommended for use for influenza type A, 5 and usage rates peaked in October 2009 at 164 oseltamivir dispensings per 100 000 enrollees.
Figure 1.
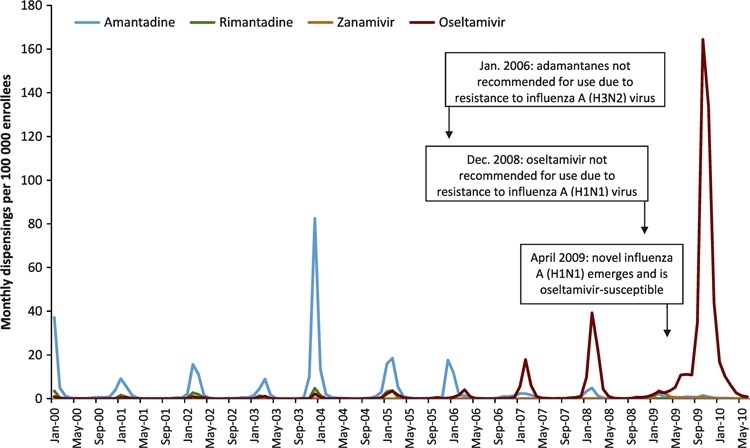
Monthly influenza antiviral dispensing rates for treatment purposes, by medication, Vaccine Safety Datalink Project, January 2000 through June 2010. The type and timing of changes in national treatment guidelines are indicated.
Dispensing rates varied by MCO, with rates consistently highest at two of the MCOs (see Appendix S1). Seasonal trends in weekly dispensing rates were strongly correlated with the percentage of positive influenza tests, both at the local and broader regional levels. During the 2009 H1N1 pandemic, an increase in the percentage of positive influenza tests was apparent by mid‐2009 at every MCO. The peak in antiviral dispensings occurred later in 2009, more consistent with the peak of national outpatient visits for influenza‐like illness. 15 Patterns at two sample MCOs are shown in Figure 2, and for all MCOs in the Appendix S1.
Figure 2.
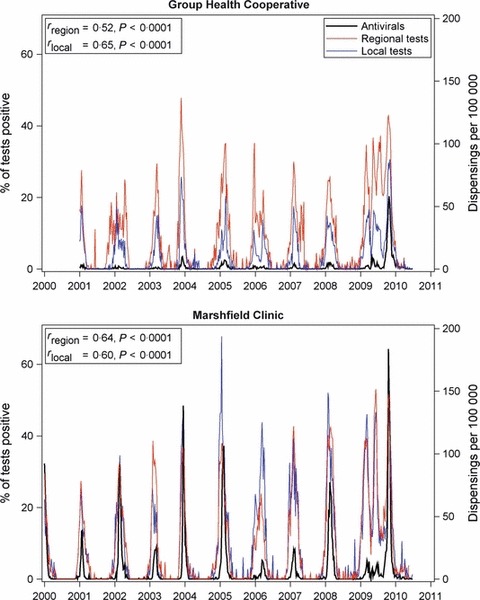
Weekly regional and local percentages of positive influenza tests and influenza antiviral dispensing rates, for two medical care organizations (MCOs), Vaccine Safety Datalink Project, January 1, 2000 through June 30, 2010. Testing data are from the National Respiratory and Enteric Virus Surveillance System; regional tests are from a multi‐state area, and local tests are restricted to laboratories within 200 miles of each MCO (left y‐axis). Antiviral dispensing rates are for treatment purposes (right y‐axis). The Pearson correlation coefficients between antiviral dispensings and, respectively, regional test data (rregion) and local test data (rlocal) are inset.
Courses of combination therapies (more than one influenza antiviral medication dispensed on the same day) were uncommon, relative to the monotherapy frequencies in Table 1. From January to April 2009, following the December 2008 report of oseltamivir resistance, 3 there were 363 oseltamivir–amantadine dispensings and 117 oseltamivir–rimantadine dispensings, consistent with recommendations. 3 Then, from May 2009 to June 2010 during the 2009 H1N1 pandemic, there were 254 oseltamivir–amantadine dispensings and 42 oseltamivir–rimantadine dispensings.
Clinical practice
Further analyses were restricted to dispensings of oseltamivir for treatment purposes. For the 11 451 oseltamivir treatment courses dispensed during the pre‐pandemic period, 10 448 (91%) were preceded in the prior 0–2 days by a patient visit in the clinic setting, 933 (8%) were preceded by an ED visit, and 70 (0·6%) were preceded by a hospitalization. However, during the 2009 H1N1 pandemic, there were proportionally more ED visits and fewer clinic visits preceding dispensings: of the 38 019 dispensings, 30 513 (80%) were preceded by a clinic visit, 6705 (18%) by an ED visit, and 801 (2%) by a hospitalization. Of note, 976 oseltamivir treatments were dispensed throughout the pandemic period to infants; the peak was 363 dispensings to <1‐year‐olds in November 2009, reflecting a rate of 410 dispensings per 100 000 infants enrolled.
Although all patients receiving oseltamivir for treatment purposes by definition had a medically attended visit prior to the dispensing, 3908 (34%) of pre‐pandemic dispensings and 11 946 (31%) of pandemic dispensings were to patients who were not assigned an influenza diagnosis.
The great majority of dispensings were to patients who were not tested for influenza prior to their dispensing. In the pre‐pandemic period, 94% of dispensings were to untested patients, 5% were to patients who tested positive for influenza, and 1% were to patients who tested negative for influenza. Similarly in the pandemic period, these percentages, respectively, were 97%, 2%, and 1%. Of the 1233 oseltamivir dispensings to patients who were tested for influenza during the pandemic, 799 (65%) were tested by RT‐PCR, 378 (31%) by rapid test, 47 (4%) by viral tissue culture, and 9 (0·7%) by DFA or IFA. Of the oseltamivir‐treated patients tested by rapid test, 167 (44%) tested negative for influenza.
Uptake of monovalent inactivated influenza H1N1 vaccine within VSD began mid‐October 2009, 16 and 31% of oseltamivir dispensings during the pandemic occurred before initial vaccine availability. Only 758 (2%) of dispensings were to patients who had received monovalent inactivated influenza H1N1 vaccine ≥14 days prior to the dispensing.
Treatment during 2009 H1N1 pandemic
Oseltamivir treatment courses during the pandemic (n = 38 019) versus pre‐pandemic periods (n = 10 118) were significantly more likely to be dispensed to females, <25‐year‐olds, patients with chronic pulmonary disease, diabetes, other metabolic disease, chronic cardiovascular disease, immunosuppressive disorder, neurological/musculoskeletal disease, chronic renal disease, malignancy, and liver disease, and pregnant patients (Table 2). During the pandemic period, 46% of dispensings were to patients with diagnosed underlying conditions, including pregnancy. Results (data not shown) were similar when dispensings without a recent medical care visit were also included (total pandemic dispensings: n = 51 496; total pre‐pandemic dispensings: n = 12 956).
Table 2.
Factors associated with pandemic versus pre‐pandemic oseltamivir receipt for the purpose of treatment
| Independent variable | Level | Pre‐pandemic (n = 10 118) (%) | Pandemic (n = 38 019) (%) | Adjusted Odds Ratio* (95% confidence interval) | P‐value** |
|---|---|---|---|---|---|
| Sex | Female | 5349 (53) | 20 947 (55) | 1·18 (1·13, 1·24) | <.0001 |
| Male | 4769 (47) | 17 071 (45) | Reference | ||
| Age (years) | 0–4 | 343 (3) | 5237 (14) | 11·89 (10·15, 13·92) | <.0001 |
| 5–9 | 517 (5) | 4066 (11) | 5·30 (4·58, 6·13) | <.0001 | |
| 10–14 | 479 (5) | 4174 (11) | 5·07 (4·37, 5·87) | <.0001 | |
| 15–19 | 642 (6) | 3790 (10) | 3·06 (2·66, 3·51) | <.0001 | |
| 20–24 | 775 (8) | 2629 (7) | 1·58 (1·38, 1·82) | <.0001 | |
| 25–49 | 4884 (48) | 11 696 (31) | 1·10 (0·98, 1·23) | 0·09 | |
| 50–64 | 1880 (19) | 4661 (12) | 1·03 (0·91, 1·16) | 0·65 | |
| ≥65 | 598 (6) | 1766 (5) | Reference | ||
| Chronic pulmonary disease | 1585 (16) | 11 325 (30) | 2·14 (2·01, 2·28) | <.0001 | |
| Diabetes | 779 (8) | 2769 (7) | 1·19 (1·09, 1·31) | 0·0002 | |
| Chronic cardiovascular disease | 578 (6) | 2238 (6) | 1·15 (1·03, 1·28) | 0·015 | |
| Immunosuppressive disorder | 397 (4) | 1810 (5) | 1·41 (1·25, 1·59) | <.0001 | |
| Pregnancy | 44 (0·4) | 1576 (4) | 14·29 (10·55, 19·37) | <.0001 | |
| Other metabolic disease | 279 (2·8) | 1206 (3·2) | 1·37 (1·19, 1·59) | <.0001 | |
| Neurological/musculoskeletal disease | 242 (2·4) | 1183 (3·1) | 1·21 (1·04, 1·41) | 0·01 | |
| Chronic renal disease | 196 (1·9) | 981 (2·6) | 1·35 (1·14, 1·61) | 0·0005 | |
| Malignancy | 229 (2·3) | 846 (2·2) | 1·18 (1·01, 1·39) | 0·04 | |
| Liver disease | 72 (0·7) | 438 (1·2) | 1·83 (1·41, 2·37) | <.0001 | |
| Cerebrovascular disease | 85 (0·8) | 279 (0·7) | 0·94 (0·72, 1·23) | 0·64 | |
| Hemoglobinopathy | 44 (0·4) | 252 (0·7) | 0·99 (0·70, 1·40) | 0·96 | |
| Kawasaki’s disease | 2 (0·02) | 8 (0·02) | 0·29 (0·05, 1·69) | 0·17 | |
*Odds ratios adjusted for all other variables in this table and for medical care organization, through multivariable logistic regression.
**Associations with P < 0·05 are in boldface.
Chronic pulmonary disease, including asthma, was particularly notable because 30% of dispensings during the pandemic were to patients with this condition, and the association between having the condition and receiving treatment during the pandemic versus pre‐pandemic periods was elevated (odds ratio: 2·1; 95% confidence interval: 2·0, 2·3, Table 2). There was an interaction effect (P < 0·0001) between age and chronic pulmonary disease, such that 5–19‐year‐olds with chronic pulmonary disease had even greater odds of being treated, after adjustment for the other 14 covariates (Figure 3).
Figure 3.
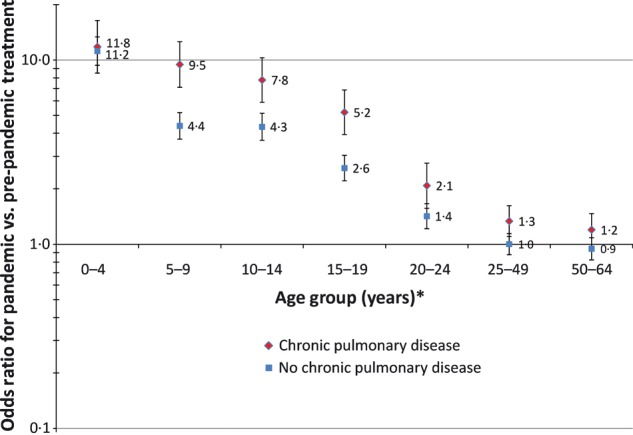
Age‐specific odds ratios and 95% confidence intervals for pandemic versus pre‐pandemic oseltamivir dispensings, stratified by patient chronic pulmonary disease status, adjusted for medical care organization, sex, 11 other underlying conditions (diabetes, other metabolic disease, chronic cardiovascular disease, immunosuppressive disorder, neurological/musculoskeletal disease, chronic renal disease, malignancy, liver disease, cerebrovascular disease, hemoglobinopathy, and Kawasaki’s disease), and pregnancy. *Reference: ≥65‐year‐olds.
Discussion
Influenza antiviral medication use in VSD was consistent both with CDC guidelines to adapt to drug resistance, as well as with another marker of influenza activity, the weekly percentage of influenza tests that were positive in the local community or region. One‐third of oseltamivir dispensings for treatment during the pandemic were to patients who did not receive an ICD‐9‐CM‐coded influenza diagnosis, suggesting that monitoring antiviral drug dispensings may be a useful tool to supplement influenza diagnoses and tests for surveillance. 17
The dispensing patterns we observed during the 2009 H1N1 pandemic showed that a higher proportion of dispensings were to patients from high‐risk subgroups, suggesting that clinicians in these MCOs were acting in accordance with CDC recommendations. A large proportion of dispensings were to patients with underlying conditions, such as chronic pulmonary disease. This was consistent with risk factors for severe complications of H1N1 infection identified during the pandemic, 18 , 19 although one study determined that 66% of patients admitted to intensive care for 2009 H1N1 pandemic infections in six countries had no major comorbid conditions. 20 A much higher proportion of dispensings were to pregnant women during the pandemic compared with pre‐pandemic periods. 21 Antivirals were more likely to be dispensed to females during the pandemic, consistent with prior observations for 2004 and 2005. 12 Furthermore, treatments were disproportionally dispensed to younger patients during the pandemic. The U.S. Food and Drug Administration issued an amendment to the Emergency Use Authorization (EUA) for oseltamivir that permitted treatment of <1‐year‐olds between October 30, 2009 and June 23, 2010, 22 and the highest usage rate among VSD infants was in November 2009, immediately after the EUA became effective.
Most oseltamivir dispensings to outpatients during the 2009 H1N1 pandemic were not preceded by influenza testing. Rapid test kits were known to have suboptimal sensitivity for the novel 2009 H1N1 virus 23 and were generally unavailable for outpatients. Clinicians were urged to use clinical judgment (considering patient characteristics, disease severity, and local influenza circulation rates) in deciding whether to treat. This advice appears to have been followed, as only a small proportion of dispensings were to patients who received a rapid test, and of those, 44% tested negative yet treatment was dispensed anyway.
This descriptive study has at least five limitations. First, the measured dispensing rates may be an underestimate, as some insurance plans offered by participating MCOs had minimal pharmacy coverage. If a claim was not submitted for payment, then the dispensing would not be captured for this study. Second, the electronic data sources available (e.g., outpatient diagnoses and pharmacy dispensings) did not allow assessment of consistency with certain aspects of CDC guidelines, such as the recommendation to initiate treatment within 48 hours of illness onset. 1 Third, for efficiency of data collection and analysis, the unit of analysis was dispensing, not patient. We were thus unable to directly assess how changes in antiviral treatment related to changes in the population presenting for care across influenza seasons. For instance, although we were able to determine that the proportion of antivirals that were dispensed to patients with chronic pulmonary disease increased during the pandemic, we were unable to directly measure changes in the proportion of patients with chronic pulmonary disease presenting with acute respiratory illness who were treated with antivirals. Fourth, patients enrolled in MCOs participating in VSD may not be representative of the average U.S. population, and clinical practice patterns within these large group practices may not be fully generalizable to other settings. Variation in dispensing rates was observed across MCOs (Appendix S1), and it is unknown how these patterns compare to those for patients seen by solo and small group practitioners. Fifth, in identifying oseltamivir dispensings for treatment purposes, we required a medical care visit in the prior 2 days. This criterion excluded dispensings both to ill patients who were legitimately prescribed oseltamivir for treatment using telephone dispensing protocols as well as to high‐risk contacts of influenza patients who did not themselves seek medical care, and probably included dispensings to some patients who were not actually ill during their office visit but were prescribed oseltamivir to have “on hand.” 24 Nevertheless, a sensitivity analysis including dispensings to patients without a recent medical care visit did not substantively change the results.
In the current post‐pandemic period, influenza antiviral treatment should be guided by patient characteristics, reliable influenza test results, and local surveillance data on circulating strains. 1 These recommendations should be re‐evaluated as additional data regarding patients at‐risk for severe complications of influenza 20 and regarding antiviral effectiveness become available. The trends we observed in influenza antiviral treatment reflect the severity of influenza seasons and media‐influenced patient treatment‐seeking behavior, 25 and they suggest that clinicians adopted CDC recommendations to focus on high‐risk patient groups during the 2009 H1N1 pandemic. The fact that antiviral agents were commonly dispensed to patients with negative influenza tests, without influenza tests, or without influenza diagnoses suggests that antiviral dispensings may offer useful supplemental information for influenza surveillance.
Conflict of interest
R. B. reports receiving research grants from GlaxoSmithKline, Sanofi Pasteur, Novartis, and MedImmune. S. J. J. reports receiving research funding from and serving as an unpaid consultant to Merck Research Labs. The remaining authors declare that they have no competing interests.
Author contributions
Dr. Sharon K. Greenea: lead investigator, designed and oversaw study, analyzed data, drafted and revised paper; Dr. David K. Shayb: study conception and design, results interpretation, critical revision of paper; Ms. Ruihua Yina: programmer‐analyst; Ms. Natalie L. McCarthyc: data management and acquisition, programming; Dr. Roger Baxterd: data acquisition, results interpretation, critical revision of paper; Dr. Michael L. Jacksone: data acquisition, results interpretation, critical revision of paper; Dr. Steven J. Jacobsenf: data acquisition, results interpretation, critical revision of paper; Dr. James D. Nording: data acquisition, results interpretation, critical revision of paper; Ms. Stephanie A. Irvingh: data acquisition, results interpretation, critical revision of paper; Dr. Allison L. Nalewayi: data acquisition, results interpretation, critical revision of paper; Dr. Jason M. Glanzj: data acquisition, results interpretation, critical revision of paper; Dr. Tracy A. Lieua,k: study conception and design, data acquisition, results interpretation, critical revision of paper.
Supporting Information
Additional Supporting Information may be found in the online version of this article:
Appendix S1. Expansion of Figure 2 to include all participating medical care organizations.
Please note: Wiley‐Blackwell are not responsible for the content or functionality of any supporting materials supplied by the authors. Any queries (other than missing material) should be directed to the corresponding author for the article.
Supporting information
Appendix S1. Expansion of Figure 2 to include all participating medical care organizations.
Supporting info item
Acknowledgements
We thank Jeffry Mutuc (Centers for Disease Control and Prevention [CDC]) for providing National Respiratory and Enteric Virus Surveillance System data at local geographic resolution. For scientific, data management, and project management support, we also thank Jufu Chen, Paul Gargiullo, and Alicia Fry (CDC); Melisa Rett and Rich Fox (Harvard Medical School and Harvard Pilgrim Health Care Institute); Berwick Chan and Ajit DeSilva (Kaiser Permanente Vaccine Study Center); Lawrence Madziwa (Group Health Research Institute); Avalow Olsen (HealthPartners Research Foundation); Edward Belongia and Vidhu Choudhary (Marshfield Clinic Research Foundation); Brad Crane and Mark Schmidt (Kaiser Permanente Northwest Center for Health Research); and Timothy Johnson (Kaiser Permanente Colorado). This work was supported by a subcontract with America’s Health Insurance Plans (contract 200‐2002‐00732) from the Centers for Disease Control and Prevention.
The findings and conclusions in this report are those of the authors and do not necessarily represent the official position of the Centers for Disease Control and Prevention.
References
- 1. Fiore AE, Fry A, Shay D, Gubareva L, Bresee JS, Uyeki TM. Antiviral agents for the treatment and chemoprophylaxis of influenza ‐‐‐ recommendations of the Advisory Committee on Immunization Practices (ACIP). MMWR Recomm Rep 2011; 60:1–24. [PubMed] [Google Scholar]
- 2. WHO Collaborating Center for Surveillance, Epidemiology, and Control of Influenza , Bright R, Shay D et al. High levels of adamantane resistance among influenza A (H3N2) viruses and interim guidelines for use of antiviral agents‐‐United States, 2005–06 influenza season. MMWR Morb Mortal Wkly Rep 2006; 55:44–46. [PubMed] [Google Scholar]
- 3. U.S. Centers for Disease Control and Prevention (CDC) . CDC Health Advisory: CDC issues interim recommendations for the use of influenza antiviral medications in the setting of oseltamivir resistance among circulating influenza A (H1N1) viruses, 2008–09 influenza season. Available at http://emergency.cdc.gov/HAN/han00279.asp (Accessed 22 September 2011).
- 4. Le MT, Wertheim HF, Nguyen HD et al. Influenza A H5N1 clade 2.3.4 virus with a different antiviral susceptibility profile replaced clade 1 virus in humans in northern Vietnam. PLoS ONE 2008; 3:e3339. [DOI] [PMC free article] [PubMed] [Google Scholar]
- 5. U.S. Centers for Disease Control and Prevention (CDC) . Updated interim recommendations for the use of antiviral medications in the treatment and prevention of influenza for the 2009–2010 season. Available at http://www.cdc.gov/h1n1flu/recommendations.htm (Accessed 22 September 2011).
- 6. Baggs J, Gee J, Lewis E et al. The Vaccine Safety Datalink: a model for monitoring immunization safety. Pediatrics 2011; 127(Suppl 1):S45–S53. [DOI] [PubMed] [Google Scholar]
- 7. Coleman LA, Kieke B, Irving S et al. Comparison of influenza vaccine effectiveness using different methods of case detection: clinician‐ordered rapid antigen tests vs. active surveillance and testing with real‐time reverse‐transcriptase polymerase chain reaction (rRT‐PCR). Vaccine 2011; 29:387–390. [DOI] [PubMed] [Google Scholar]
- 8. U.S. Centers for Disease Control and Prevention (CDC) . 2011–2012 influenza antiviral medications: summary for clinicians. Available at http://www.cdc.gov/flu/professionals/antivirals/summary‐clinicians.htm (Accessed 22 September 2011).
- 9. Genentech . Tamiflu (oseltamivir phosphate) Capsules and for Oral Suspension [Package insert]. South San Francisco, CA: Genentech USA, Inc, 2011. Available at http://www.gene.com/gene/products/information/tamiflu/pdf/pi.pdf (Accessed 7 March 2012). [Google Scholar]
- 10. GlaxoSmithKline . Relenza (Zanamivir for Inhalation) [Package insert]. Research Triangle Park, NC: GlaxoSmithKline, 2011, Available at http://us.gsk.com/products/assets/us_relenza.pdf (Accessed 7 March 2012). [Google Scholar]
- 11. Roche Laboratories, Inc . Roche Prioritizes Production of Tamiflu® 75 mg Capsules (oseltamivir phosphate) to Provide Alternative to Limited Supplies of Tamiflu® for Oral Suspension (Oseltamivir Phosphate) and Tamiflu® 30 mg and 45 mg Capsules. Nutley, NJ: Roche Laboratories, Inc, 2009. Available at http://www.gene.com/gene/products/information/tamiflu/pdf/TAMIFLU_Supply_letter_09_04_2009.pdf (Accessed 22 September 2011) [Google Scholar]
- 12. Ortiz JR, Kamimoto L, Aubert RE et al. Oseltamivir prescribing in pharmacy‐benefits database, United States, 2004–2005. Emerg Infect Dis 2008; 14:1280–1283. [DOI] [PMC free article] [PubMed] [Google Scholar]
- 13. U.S. Department of Health and Human Services (HHS) . HHS region map. Available at http://www.hhs.gov/about/regionmap.html. (Accessed 6 September 2011).
- 14. US Centers for Disease Control and Prevention (CDC) . Swine influenza A (H1N1) infection in two children‐‐Southern California, March–April 2009. MMWR Morb Mortal Wkly Rep 2009; 58:400–402. [PubMed] [Google Scholar]
- 15. U.S. Centers for Disease Control and Prevention (CDC) . Update: influenza activity – United States, August 30, 2009‐March 27, 2010, and composition of the 2010–11 influenza vaccine. MMWR Morb Mortal Wkly Rep 2010; 59:423–430. [PubMed] [Google Scholar]
- 16. Lee GM, Greene SK, Weintraub ES et al. H1N1 and seasonal influenza vaccine safety in the Vaccine Safety Datalink Project. Am J Prev Med 2011; 41:121–128. [DOI] [PubMed] [Google Scholar]
- 17. Marsden‐Haug N, Foster VB, Gould PL, Elbert E, Wang H, Pavlin JA. Code‐based syndromic surveillance for influenzalike illness by International Classification of Diseases, Ninth Revision. Emerg Infect Dis 2007; 13:207–216. [DOI] [PMC free article] [PubMed] [Google Scholar]
- 18. Jain S, Kamimoto L, Bramley AM et al. Hospitalized patients with 2009 H1N1 influenza in the United States, April–June 2009. N Engl J Med 2009; 361:1935–1944. [DOI] [PubMed] [Google Scholar]
- 19. Louie JK, Acosta M, Winter K et al. Factors associated with death or hospitalization due to pandemic 2009 influenza A (H1N1) infection in California. JAMA 2009; 302:1896–1902. [DOI] [PubMed] [Google Scholar]
- 20. Rothberg MB, Haessler SD. Complications of seasonal and pandemic influenza. Crit Care Med 2010; 4(Suppl):e91–e97. [DOI] [PubMed] [Google Scholar]
- 21. Siston AM, Rasmussen SA, Honein MA et al. Pandemic 2009 influenza A(H1N1) virus illness among pregnant women in the United States. JAMA 2010; 303:1517–1525. [DOI] [PMC free article] [PubMed] [Google Scholar]
- 22. U.S. Food and Drug Administration (FDA) . Emergency use of Tamiflu in infants less than 1 year of age. Available at http://www.fda.gov/Drugs/DrugSafety/PostmarketDrugSafetyInformationforPatientsandProviders/ucm183870.htm (Accessed 21 September 2011).
- 23. Jernigan DB, Lindstrom SL, Johnson JR et al. Detecting 2009 pandemic influenza A (H1N1) virus infection: availability of diagnostic testing led to rapid pandemic response. Clin Infect Dis 2011; 52(Suppl 1):S36–S43. [DOI] [PubMed] [Google Scholar]
- 24. Schatz M, Chambers CD, Jones KL, Louik C, Mitchell AA. Safety of influenza immunizations and treatment during pregnancy: the Vaccines and Medications in Pregnancy Surveillance System. Am J Obstet Gynecol 2011; 204:S64–S68. [DOI] [PubMed] [Google Scholar]
- 25. Baxter R. Surveillance lessons from first‐wave pandemic (H1N1) 2009, Northern California, USA. Emerg Infect Dis 2010; 16:504–506. [DOI] [PMC free article] [PubMed] [Google Scholar]
- 26. Schwab RS, England AC Jr, Poskanzer DC, Young RR. Amantadine in the treatment of Parkinson’s disease. JAMA 1969; 208:1168–1170. [PubMed] [Google Scholar]
- 27. Schapira M. Treating multiple sclerosis with amantadine hydrochloride. J R Coll Gen Pract 1974; 24:411–412. [PMC free article] [PubMed] [Google Scholar]
- 28. Donfrancesco R, Calderoni D, Vitiello B. Open‐label amantadine in children with attention‐deficit/hyperactivity disorder. J Child Adolesc Psychopharmacol 2007; 17:657–664. [DOI] [PubMed] [Google Scholar]
- 29. Lucetti C, Gambaccini G, Bernardini S et al. Amantadine in Huntington’s disease: open‐label video‐blinded study. Neurol Sci 2002; 23(Suppl 2):S83–S84. [DOI] [PubMed] [Google Scholar]
Associated Data
This section collects any data citations, data availability statements, or supplementary materials included in this article.
Supplementary Materials
Appendix S1. Expansion of Figure 2 to include all participating medical care organizations.
Supporting info item