Abstract
While horizontal gradients of biodiversity have been examined extensively in the past, vertical diversity gradients (elevation, water depth) are attracting increasing attention. We compiled data from 443 elevational gradients involving diverse organisms worldwide to investigate how elevational diversity patterns may vary between the Northern and Southern hemispheres and across latitudes. Our results show that most elevational diversity curves are positively skewed (maximum diversity below the middle of the gradient) and the elevation of the peak in diversity increases with the elevation of lower sampling limits and to a lesser extent with upper limit. Mountains with greater elevational extents, and taxonomic groups that are more inclusive, show proportionally more unimodal patterns whereas other ranges and taxa show highly variable gradients. The two hemispheres share some interesting similarities but also remarkable differences, likely reflecting differences in landmass and mountain configurations. Different taxonomic groups exhibit diversity peaks at different elevations, probably reflecting both physical and physiological constraints.
Montane regions harbor more than half of the world's biodiversity hotspots and recent research on biodiversity patterns has been notable for an increase in research on elevational patterns on mountains1. Mountains provide unique opportunities as ‘natural experiments’ for testing ecological theories and in particular for studying the effects of climate change because they present gradients in key abiotic features such as temperature and available moisture. Recent efforts have generated interesting and sometimes conflicting results, and debates on the generality of the frequently observed unimodal (“hump-shaped”2) curves and the underlying mechanisms have not been fully resolved. Indeed, despite increased research in this area in recent years, employing markedly improved techniques and greater sampling intensity, much inconsistency and debate remains both in pattern description and interpretation. For example, surprisingly little effort has targeted how elevational diversity patterns might vary in the Northern and Southern hemispheres and across latitudinal zones3,4,5,6,7. To tackle these problems, detailed comparisons are needed over distinct (replicate) elevational gradients across the globe.
The upper elevational limit for phanerogams varies as a function of latitude and generally reflects limits to physiologic tolerance1. Moreover, similar elevational ranges in different regions are likely to exhibit different underlying gradients8, reflecting regional climate and geography; cold-temperate mountains lack the warm climate characteristic of lower elevations at lower latitudes, and temperatures at a tropical treeline might reflect those at the base of cold-temperate mountains. Additionally, the effect of aspect is greatly reduced on tropical mountains relative to temperate ones. As a result of these latitudinal differences, structurally identical mountains located in different latitudinal zones would be expected to show different diversity patterns.
Sampling issues have rightly been a major focus in biogeographical research2,9,10,11,12,13. Relatively few studies span the full extent of available elevational gradients10, and many studies on latitudinal gradients are constrained to cover only a portion of the full gradient (e.g., a subset of 0–90° N or S). Constraints include habitat alteration at lower elevations (e.g., agriculture, urbanization), challenges of accessing higher elevations, and the uneven distribution of landmass across latitude (and across the equator). Resulting constraints on the latitudinal or elevational extent sampled may influence ecological insights; additionally, patterns of elevational diversity gradients also depend on the specific hierarchical species groups (e.g., all seed plants vs. subsets such as trees) and their sizes (number of species). Finally, geographic comparisons assume comparable sampling intensity across all sites; this is rarely achievable due to different research objectives and funding constraints, but it is incumbent on geographers to assure that spatial interpretations are biologically real and not inconsequential results of spatially varying sampling effort.
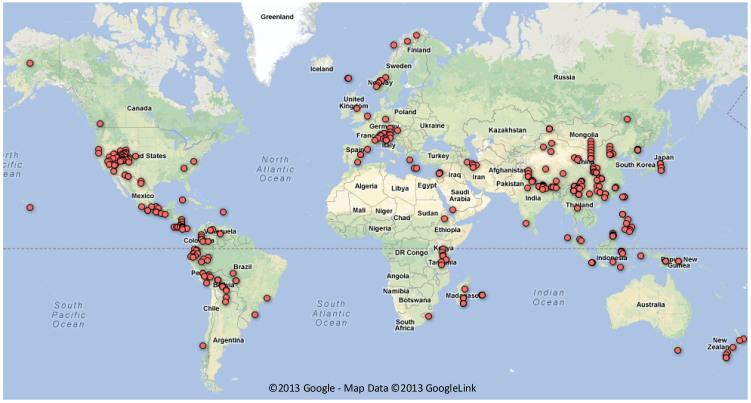
We compiled a comprehensive dataset on biota across elevational gradients on many of the major global mountain ranges (Fig. 1), and we use this to advance understanding of two fundamental questions. First, how do elevational diversity gradients/patterns vary across the globe, especially between the two hemispheres and across latitudes and among taxonomic groups? Second, in addition to climate and human impacts, what regional factors and sampling issues might explain variation among elevational patterns studied to date? We emphasize recent studies as these incorporate improved sampling procedures (e.g., intensive as well as extensive sampling) thereby minimizing concerns over differential effort, but we emphasize that further progress in this field calls for attention to standardization of sampling efforts. Our ultimate goal is to improve understanding of how elevational patterns vary across the globe; more refined evaluations to identify and discuss specific mechanisms will require high-resolution climate data and geospatial analyses to accurately account for unique features of each mountain/region involved.
Figure 1. The distribution of mountains/regions for which diversity data from 443 elevational gradients are examined in this study (made using Google Maps).
Results
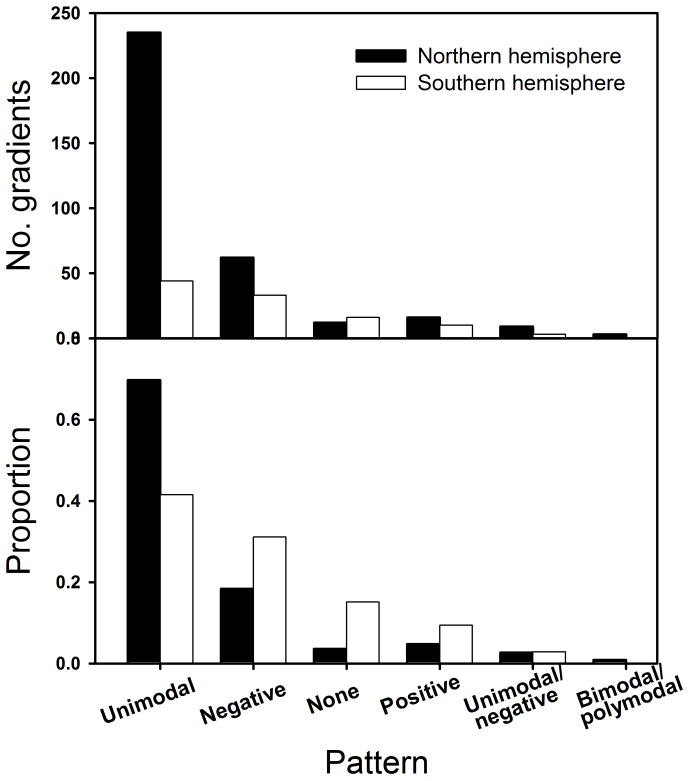
Globally, 279 of 443 elevational diversity gradients examined (63%) were unimodal. This was followed in the Northern Hemisphere by negative, positive, none, either unimodal or negative (“unimodal/negative” hereafter), and bimodal or polymodal (“bimodal/polymodal” hereafter), and in the Southern Hemisphere by negative, none, positive, and unimodal/negative (Fig. 2). The proportions of the gradients corresponding to distinct patterns was similar between plants and animals (X2 = 3.76, P = 0.71), and the proportion of gradients exhibiting unimodal patterns was similar for plant functional groups (shrubs, 9/12; herbs, 13/22; ferns, 29/48; trees, 13/25; X2 = 0.43, P = 0.93). Among animals, 42 of 76 (55%) invertebrates and 73 of 115 (64%) vertebrates showed unimodal patterns (X2 = 0.97, P = 0.57). Among vertebrates, non-flying mammals had the highest proportion of unimodal pattern (76%), followed by bats (50%) and birds (40%).
Figure 2.
Top: Number of gradients (out of 443) in each pattern category in Northern and Southern hemispheres. Bottom: Proportion (0–1) of each of the six patterns among the studies gradients in Northern vs. Southern hemisphere. See Methods for detailed pattern classification and descriptions (symbols).
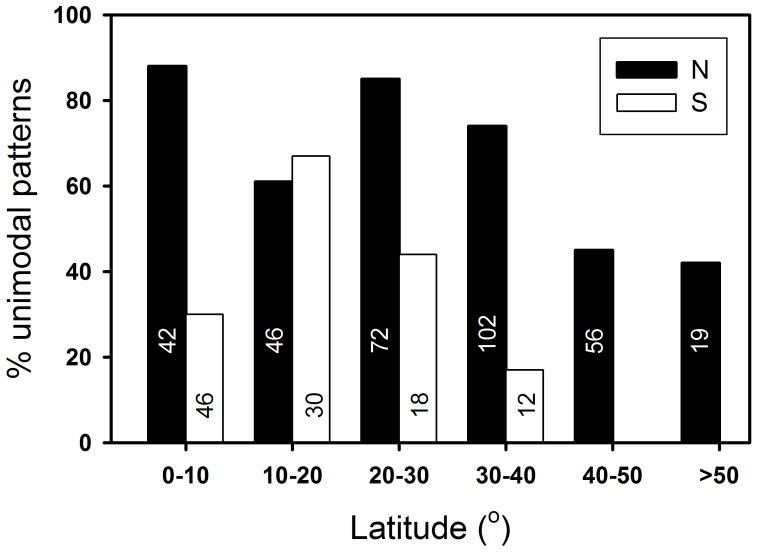
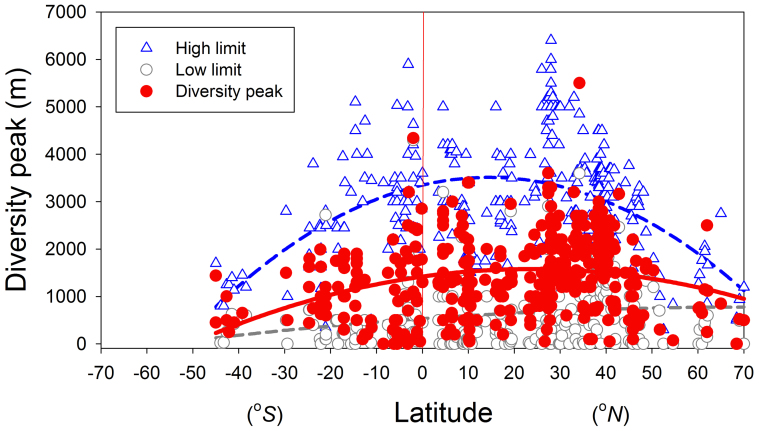
While some general trends were similar between the two hemispheres (e.g., elevational peaks of diversity declined with latitude), there was also remarkable hemispheric asymmetry in certain other aspects. For example, there were proportionally more unimodal patterns among studies in the Northern Hemisphere relative to the Southern Hemisphere (235/337 or 70% vs. 44/106 or 42%; X2 = 35.56, P < 0.0001; this excludes mountains > 45° since these are not available in any Southern Hemisphere data; Fig. 3). Also, the diversity peaks were positioned at significantly higher elevations in the Northern than in the Southern Hemisphere ( = 1508 m vs. 1141 m; t = 3.9, P < 0.001). With the exception of the lowest latitude bracket (0–10°N) in the Northern Hemisphere, mid-latitudes (20–40°N and 20–30°S) had more gradients with unimodal pattern than either lower or higher latitudes (Fig. 3). On average, the highest elevations of species diversity peaks occurred at a much higher latitude in the Northern hemisphere (30°N) than in the Southern hemisphere (5°S). In the Northern Hemisphere, the lowest and highest sampling limits occurred around 25–30° and the greatest elevational extents of the studied mountains at about 30°. In contrast, the corresponding values were lower (around 5–15°) in the Southern Hemisphere. The low, mid, and high elevations were 668, 1911, and 3154 m in the Northern Hemisphere vs. 469, 1623, and 2778 m in the Southern Hemisphere; and all three were significantly different between the two hemispheres (t = 2.68, 2.96, and 3.81, P = 0.008, 0.003, and 0.0002, respectively; see also Figs. 4, 6, S1); in contrast, the elevational extents sampled do not differ (2505 vs. 2353 m; t = 1.09, P > 0.05; Fig. 4, Fig. S1).
Figure 3. Distribution of examined diversity gradients with unimodal pattern across latitudes in both Northern and Southern hemispheres.
The number in each bar represents the no. of gradients in each category. Except for the “1–10°N” category in Northern Hemisphere, mid-latitudes had more gradients with unimodal pattern.
Figure 4. The relationships among latitude, elevations of diversity peaks, and related sampling limits based on the 443 gradients.
All relationships are significant (p < 0.0001) but the ones for Northern Hemisphere are better described by second-order regression and those for the Southern Hemisphere are described by a linear regression.
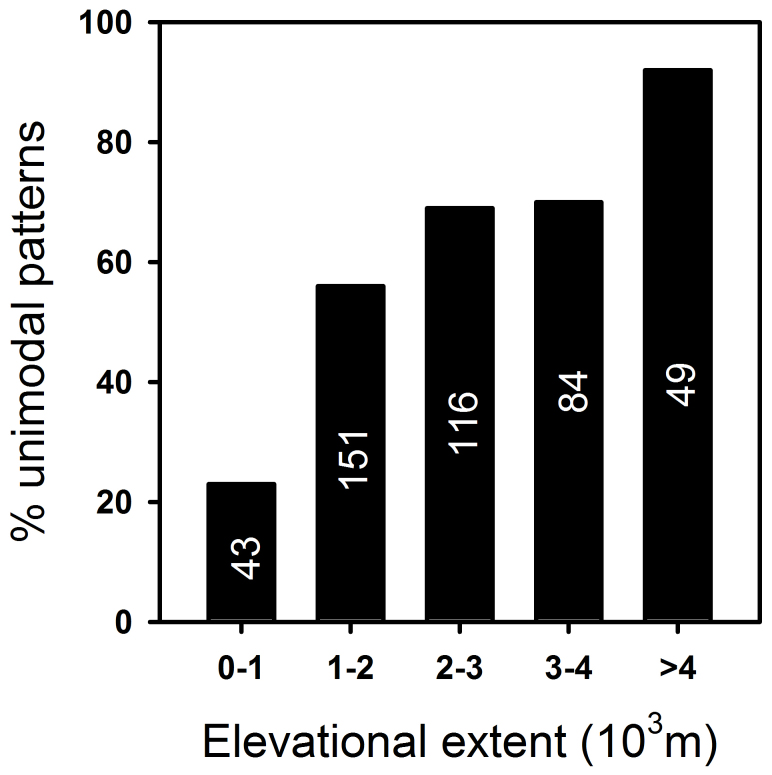
Figure 5. Distribution of unimodal diversity gradients in relation to elevational extents measured from low to high sampling limits based on the 443 gradients in both Northern and Southern hemispheres.
The number in each bar represents the no. of gradients in each category. Relationships examined separately for Northern and Southern hemispheres yield similar results (not shown).
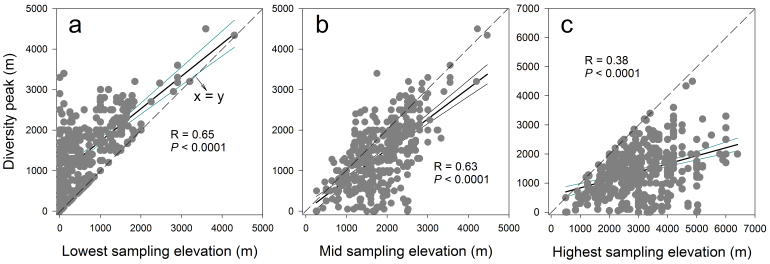
Figure 6. Effects of the lowest, mid, and highest sampling limits (green) on the elevational positions of diversity peaks (linear regressions with 95 confidence intervals).
Most of the diversity peaks are located lower than the mid-elevation of the sampled gradients (i.e., closer to the lowest limits than to the highest limits or a < b), leading to the positive skews in diversity curves. The lowest sampling limits show stronger relationships with the elevations of diversity peaks than highest limits (R = 0.65 vs. 0.38).
In general, mountains presenting greater elevational extent were more likely to display unimodal patterns. All elevational-extent categories > 1000 m had a high percentage of unimodal patterns; ranges exceeding 4000 m in extent presented the greatest proportion of unimodal patterns, while all lesser extents (e.g., 1000–2000, 2000–3000, or 3000–4000 m extent) had very similar proportions of unimodal patterns (Fig. 5, S1).
About 75% (208 out of 279) of the unimodal gradients in our data set were positively skewed (e.g., peak diversity below the elevational midpoint; Fig. 6). The elevations of diversity peaks increased with the elevations of both lowest and highest sampled limits although the effects of the latter were weaker (Fig. 6).
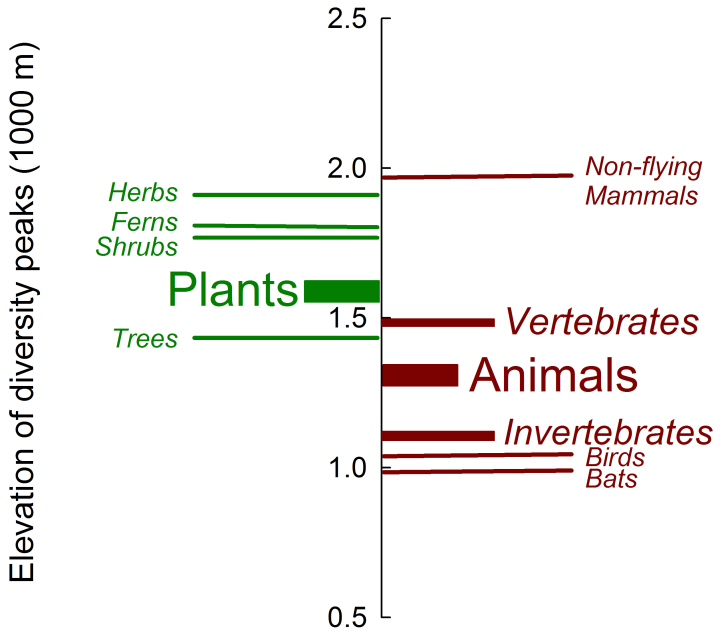
Elevational diversity patterns varied by taxonomic group. The elevations of diversity peaks for plants were higher than those for animals ( = 1530 vs. 1274 m; t = −3.27, P < 0.001), although these two groups did not differ in the lowest sampling limits (634 vs. 577 m for plants vs. animals; t = 0.91, P = 0.36), the highest sampling limits (3135 vs. 3007 m; t = 1.16, P = 0.25), and the sampled elevational extents (2508 vs. 2427 m; t = 0.68, P = 0.5). Among animals, the diversity peaks for vertebrates were at significantly higher elevations than those for invertebrates (
 = 1422 vs. 1047 m; t = −3.36, P < 0.001) although there was no difference in either the sampled elevational extents or the lowest/highest sampled elevations between the two groups. The elevation of diversity peaks for non-flying mammals (
 = 1906 m) was much higher than that for either bats (
 = 924 m) or birds (
 = 980 m; t = −5.96 and −4.52, respectively; P < 0.0001) but there was no difference between the latter two groups (Fig. 7). Among plants, the diversity peaks of herbs were higher than those for trees (
 = 1880 vs. 1413 m; t = 2.41, P < 0.05) but there was no difference between trees and shrubs (1730 m) or between shrubs and herbs (sample sizes for epiphytes precluded analysis here). There was no difference in the low/high sampling limits and extents among these three groups (F = 0.03, P = 0.97; F = 0.03, P = 0.97, and F = 0.01, P = 0.99, respectively). Also, there was no difference between ferns and seed plants, although the diversity peaks for ferns tended to be higher in elevation than trees (t = −1.45, P = 0.08) (Fig. 7).
Figure 7. Comparison of mean elevations of diversity peaks among hierarchical taxonomic groups.
Qualitative description of elevational diversity patterns is partly a function of the diversity of the groups assessed, and within our dataset the probability of a hump-shaped pattern increased with the richness of a taxonomic group, while patterns for constituent sub-groups were highly variable. For example, the proportion of unimodal patterns across all seed plants was higher (70%) than for constituent groups (trees, shrubs, herbaceous species, or ferns alone; see corresponding values above). For all mammals, the proportion of ranges that were unimodal was 22/24 = 92% but the average for immediate subgroups (e.g., bats, birds, rodents, and small mammals) was 34/63 = 54%. For insects, the proportion of unimodal patterns was 3/4 = 75%, but the average for its immediate subgroups (e.g., ants, bees, butterflies, beetles, termites) was only 26/47 = 55%. When these three major groups and their subgroups are pooled, the larger groups were more likely to display unimodal patterns than were their subgroups (t = 3.33, P = 0.039).
Fisher's exact test showed that the sampling using both mixed sources of data (type-D; see Methods) and regional floras/faunas (type-C) revealed proportionally more unimodal elevational patterns than sampling using field transects (type-A; note that samples based on specimens, or type-B, was not included in this analysis due to small sample size, n = 6); but there was no difference between types C and D in this regard (Fig. S2). However, we failed to detect significant association between the proportions of type-C sampling and the unimodal pattern across latitudes (Northern Hemisphere: F = 2.49, P = 0.19; Southern Hemisphere: F = 0.01, P = 0.92). Similarly, we detected no difference in sampled taxonomic group size among the four sampling categories. For example, when we evaluated “all” plants, mammals, and insects, respectively, type-C sampling (based on regional floras/faunas) yielded very similar proportions of unimodal gradients (16/52 or 31%, 9/16 or 56%, 31/46 or 67%) to those based on type-A sampling (e.g., field transects; 50/185 or 27%, 23/38 or 61%, 26/43 or 61%).
Discussion
Elevational patterns differ both across hemispheres and across latitudes14. Many of the differences between the two hemispheres and even the locations of many global biodiversity hotspots likely reflect differences in landmass and mountain-range configuration, and relatively higher temperature and climatic stability in the Southern Hemisphere15. For example, the higher elevations of diversity peaks in the Northern Hemisphere may simply reflect the higher elevations of mountains and consequently a higher range of elevations sampled (Fig. 4). In addition, the latitudinal extent examined is shorter (0–45°) in the Southern vs. Northern Hemisphere (0–70°)16.
Interestingly, in both hemispheres, a greater proportion of unimodal patterns occurs at lower mid-latitudes (e.g., temperate zones; Fig. 3). Three factor might be responsible for this trend; (1) greater elevational extents (or gradients) associated with higher mountains in this latitudinal belt, (2) greater anthropogenic disturbance at lower elevations due to human activty17, and (3) shorter climatic gradients at higher latitude (cold temperate, boreal) zones (e.g., tree line occurs at lower elevations) that may limit elevational bulges in diversity. Further work to elucidate the underlying cause of this pattern would be worthwhile.
The elevational positions of the lower/upper sampling limits and extents are clearly linked to the observed diversity patterns and elevations of diversity peaks which generally are higher at mid-latitudes for major taxonomic groups (Figs. 4–6). This could reflect a tendency by researchers to study higher mountains with strong or more extensive elevational gradients and more vegetation zones for examining diversity patterns. As such, many smaller (or lower) mountains that are not represented in Fig. 1 have yet to be investigated; however, this study underscores the fact that smaller ranges, even with more intensive sampling, may be more likely to exhibit non-unimodal patterns, likely reflecting the limited geographical range over which such patterns could be expressed.
The weaker correlation between the elevation of peak diversity and the upper sampling limit could be due to the difference between the highest elevation sampled and the position of treeline, snowline, or particularly vegetation line. Related to this, the unimodal distribution of diversity peaks across latitude (Fig. 4) may be an artifact of the fact that mid-latitude gradients have higher starting points; the 20–45°N latitude range includes the highest mountains on earth, but these also occur on the largest landmass and as such the elevational gradients begin at higher elevations than many that were studied at higher and lower latitudes. As noted above, monotonic elevation-diversity relationships may be observed if the elevational gradient is limited that it lacks sufficient variation in biotic conditions; this could occur even if the start position is low when working in high latitudes18,19,20 or if it were high in lower latitudes (e.g., the high base of the elevational gradient).
These results beg the question of what drives the commonly observed unimodal elevational diversity pattern? The interactive effects of temperature and precipitation have been widely invoked to explain this; however, while temperature generally declines with elevation, patterns of precipitation vary greatly depending on mountain height, aspect, and latitude6. This could in part explain why patterns across elevation do not often mirror the well-documented pattern across latitude (over which both temperature and precipitation generally are greatest in equatorial regions)11. Reduced diversity at higher elevations is often related to decreasing temperature, area, soil nutrition, and increased isolation4 but other factors such as spatial constraints (e.g., the mid-domain effect)21,22 and human impacts23,24,25,26 also are important. It is beyond the scope of this work to specifically address the role of climate in structuring elevation diversity gradients, and sufficient data are lacking from transects (or even slopes with different aspect on the same transect) on the individual mountains where diversity has been surveyed. In any case, all these putative explanations fail to predict the right-skewed elevational pattern in diversity. One explanation that seems likely is that spatial constraints at higher elevations preclude accumulation of higher species richness1, either through reduced diversification and immigration or through increased risk of extirpation/extinction.
Some deviations from the common unimodal pattern likely are a reflection of the particular taxa under consideration. For example, within tropical mountain ranges, temperate taxa generally increase in diversity with elevation but then decline at the highest elevations, whereas tropical taxa generally decrease in diversity with elevation21 (unless the lower elevations are highly disturbed by human activities). Also, differences in elevational diversity peaks among plants and animals and among their subgroups (Fig. 7) probably reflect differences both in physiological tolerance and niche partitioning among species groups (e.g., trees vs. shrubs vs. herbs; bats vs. birds vs. non-flying mammals). In general, less inclusive groups (i.e., those with fewer species, such as genera vs. families, or families vs. orders) are less likely to present unimodal patterns because their constituent species usually have narrower distribution/elevational ranges and more specialized habitat preferences (e.g., total niche space of any given species is by definition less than that of all species within that particular genus). Therefore, we would expect smaller groups to demonstrate varied elevational patterns, as has been demonstrated across latitudinal gradients27.
Research on elevational gradients has employed a diverse array of sampling methods (Fig. S2)10,28, and we structured our analyses to provide some insight to this potential bias. Among our data, mixed sampling (type-D) produced a higher proportion of unimodal elevational pattern than the other three sampling types (i.e., field transects, specimens, and floras/faunas; see Methods), which we cautiously attribute to the more complete documentation of overall species distribution along the elevational gradients provided by combining different types of data. However, this observation was not a consequence of differential sampling across the taxonomic hierarchy (e.g., different sampling types were not preferentially used for more vs. less inclusive taxonomic groups), presumably because (1) when researchers examine elevational gradients using regional biotas (i.e., type-C), they also extract data from such databases to examine the elevational patterns of individual species groups, (2) a large proportion of studies employ multiple methods in generating the elevational patterns6, and (3) newer biotas are increasingly complete and comprehensive.
However, improved sampling (both in extent and intensity) over time may have contributed to the increase in the proportion of unimodal patterns. For example, less than a decade ago, 50% of 204 gradients reported by Rahbek10 displayed unimodal patterns, whereas our data suggests about 63%. This difference likely reflects greater sample size as well as more comprehensive and expansive sampling in recent years. It is also possible that earlier studies were based on lower sampling intensity and erroneously reported monotonic decline in diversity with elevation, leading to the perception that elevation patterns mirror latitudinal patterns11,29.
To further improve sampling in the future, we suggest more efforts to compare aspects of the same mountain. Future comparisons among all 4 major aspects (N, S, W, E) but especially between the N- and S-slopes or between wet-(rain-receiving) and dry-slopes of the same mountains would, to some level, reduce the confounding effects of mountain height and latitude. It could also help separate the influences from one set of variables such as area, range/positions, and even the species pool that are relatively constant and that from other sources such as radiation, temperature, and moisture which may vary enormously.
A few related questions require further attention. For example, (1) why are diversity peaks generally located at lower mid-elevations rather than at the symmetrical midpoint as predicted by the mid-domain effect (Fig. 6)? (2) Why do we see qualitative differences among hierarchical taxonomic groups? (3) What factor(s) underlie different patterns on different aspects of the same mountain? (4) What evolutionary or historical processes produce observed elevational diversity patterns30? (5) How might diversity peaks change with time31, and how will climate warming and other anthropogenic impacts (e.g., habitat loss and degradation) re-position the diversity peaks of various taxonomic groups? (6) How do exotic species integrate into existing elevational patterns and what are the consequences for native species (e.g., insinuation vs. competitive replacement)? Answers to these questions will advance our understanding of global elevational biodiversity gradients and simultaneously inform pressing conservation efforts. For instance, if climate warming results in upward shifts of species ranges, will those species groups that exhibit diversity peaks at the highest elevation (Fig. 7) automatically experience the most immediate conservation threats, and if so, what actions could be taken to save these species?
Elevational diversity patterns are quite diverse and to some extent reflect the unique contemporary and historical contingencies of each range. The uneven distribution of mountains and of their elevational extents across the planet clearly influences latitudinal diversity patterns but this role appears to have been underappreciated. Quantifying this influence is likely to help interpreting deviations from the conventional latitudinal patterns. With more and better data available, global elevational patterns should become increasingly clear, enabling us to better understand causal mechanisms. Distinguishing between scale and gradients, among taxonomic groups, and implicitly incorporating the importance of human and climate change in future comparative studies will greatly benefit our understanding of basic ecological phenomena and how research findings may be appropriately applied in conservation.
Methods
We compiled and examined 443 elevational gradients from the literature on vertical diversity patterns from around the world (see Supplementary Information for a complete reference list). We searched Google Scholar using key words such as elevation(al), altitude/altitudinal, diversity, and richness up to Oct. 31, 2012 when final analyses were started. We selected those studies that provided (1) the location where sampling/survey was conducted, (2) latitude/longitude (when not provided, we extracted this using the latitudinal locations of the mountain peaks), (3) the organism types, (4) lower/upper sampling endpoints (thus extents), (5) diversity or richness measures, and (6) the position of diversity/richness peaks along the transects with relatively high sampling intensity. We selected those with full access to contents in peer-reviewed journals. Additionally, we searched and added the literature/data in reverse chronological order, preferentially selecting more recent studies because they generally were conducted with more complete and more intensive sampling.
The 443 gradients/transects all fell within 0–70° latitude in both Northern (N = 337) and Southern hemispheres (N = 106; Fig. 1). These studies involved diverse taxonomic groups of plants (N = 249), animals (N = 192), and microorganisms (N = 2) with various sizes and heterogeneities in terms of the number of species and composition. The studies on plants included those on seed plants, pteridophytes, epiphytes, and bryophytes. The studies on animals were more diverse, including all non-flying mammals, small mammals, bats, birds, insects, ants, lizards, frog, snakes, and snails. The studies on microorganisms were mostly based on soil samples. Our dataset is available upon request to the senior author and we continue to expand this to include other related aspects such as life history features, mountain-specific weather/climate data for future comparisons.
To examine how elevation diversity patterns change with latitude, we segregated studies by 10° latitudinal zones (e.g., 0–10°, 10–20°, 20–30°, 30–40°, 40–50°, >50°) to ensure sufficient sample sizes for comparative analyses. The actual lower and upper sampling limits were used as surrogates to represent the length and start/end positions of underlying gradients. In many cases, the sampling limits did not represent the actual bases or tops because different mountain aspects had different bases and sometimes treeline or vegetation line limited sampling frames. Elevational diversity patterns were classified by the relationship between elevation and taxonomic richness; as such, classifications included positive (richness increases with elevation), negative, unimodal, bimodal or polymodal (“bimodal/polymodal”), unimodal or negative (“unimodal/negative”), and “none”. The category “unimodal/negative” included gradients that showed both patterns as well as those that could be classified as either unimodal or negative depending on the statistical techniques used (i.e., first vs. second order regression32) or individual discretion (especially when the diversity peak is very close to the lower limit of sampling). “None” included all gradients that were either very difficult to describe (and classify). Pattern classifications were based on the original authors' descriptions with further confirmation during this study. For some gradient patterns (3 of 6), we adopted a procedure similar to that of Rahbek10 except that the patterns of “horizontal” and “other” were replaced by “bimodal or polymodal”, “unimodal or negative”, or “none”. Because the majority of these studies did not provide specific information regarding key features of the gradients sampled, we did not attempt to evaluate the influence of aspect on diversity patterns.
To examine whether sampling techniques may have biased results, we classified studies (gradients) into four categories as follows: field transects (type-A; n = 291), specimen-based (type-B; n = 6), regional floras/faunas (type-C; n = 98), and mixed sources (type-D; n = 48). The number of type-B transects was limited primarily because this method had mostly been used in combination with other methods such as field surveys6 and/or local/regional floras or faunas13, and as such were classified as type-A, -C, or -D transects (see Fig. S2 and additional references in Supplementary Information).
While we are unable to categorically exclude the possibility that differential sampling intensity may influence our results, we believe that our approach makes this unlikely. In particular, we have selected recent studies which tend to sample both more intensively and more extensively, we grouped gradients into 10° latitudinal belts to minimize local influences, and we have compared results based on four sampling techniques (which are known to have different sampling biases). As we note in Discussion, further research in this field should emphasize standardized sampling across elevations, latitudes, and aspects to most effectively promote our understanding of geographical patterns in vertical gradients.
We used regression analyses, t-tests, contingency tests (Chi-square and Fisher's exact test), and one-way ANOVA for comparative analysis among latitudinal zones and different elevational extents used in the case studies and linear regressions to examine the correlations of the elevations of diversity peaks with the elevations of sampling limits (lower, mid, and upper) and latitude. For comparative purposes, most analyses were performed separately for Northern and Southern Hemispheres.
Supplementary Material
Global variation in elevational diversity patterns
Acknowledgments
We thank S. Creed, J. Falcone, S. Norman, D. Roelke, A. Symstad, and J. van Ruijven for helpful comments.
Footnotes
The authors declare no competing financial interests.
Author Contributions Q.G. initiated and designed the research. Q.G., Z.S., H.L., L.H., H.R. and J.W. collected data. L.H. and H.R. also revised and edited the manuscript. Q.G. and D.K. performed data analyses and wrote the paper.
References
- Spehn E. & Körner C. Data mining for global trends in mountain biodiversity. (CRC Press, Boca Raton, 2009). [Google Scholar]
- Rahbek C. The elevational gradient of species richness: a uniform pattern? Ecography 18, 200–205 (1995). [Google Scholar]
- Stevens G. C. The elevational gradient in elevational range: an extension of Rapoport's latitudinal rule to altitude. Am. Nat. 140, 893–911 (1992). [DOI] [PubMed] [Google Scholar]
- Lomolino M. V. Elevation gradients of species-density: historical and prospective views. Global Ecol. Biogeo. 10, 3–13 (2001). [Google Scholar]
- McCain C. M. Elevational gradients in diversity of small mammals. Ecology 86, 366–372 (2005). [Google Scholar]
- McCain C. M. Could temperature and water availability drive elevational species richness patterns? A global case study for bats. Global Ecol. Biogeo. 16, 1–13 (2007). [Google Scholar]
- Lomolino M. V., Riddle B. R., Whittaker R. J. & Brown J. H. Biogeography, fourth edition (Sinauer Associates, Inc., Sunderland, 2010). [Google Scholar]
- Stevens G. C. & Fox J. F. The causes of treeline. Ann. Rev. Ecol. Syst. 22, 177–192 (1991). [Google Scholar]
- Levin S. A. The problem of pattern and scale in ecology. Ecology 73, 1943–1967 (1992). [Google Scholar]
- Rahbek C. The role of spatial scale and the perception of large-scale species richness patterns. Ecol. Lett. 8, 224–239 (2005). [Google Scholar]
- Brown J. H. Mammals on mountainsides: elevational patterns of diversity. Global Ecol. Biogeo. 10, 101–109 (2001). [Google Scholar]
- Lyons S. K. & Willig M. R. Species richness, latitude, and scale-sensitivity. Ecology 83, 47–58 (2002). [Google Scholar]
- Nogués-Bravo D., Araújo M. B., Romdal T. & Rahbek C. Scale effects and human impact on the elevational species richness gradients. Nature 453, 216–219 (2008). [DOI] [PubMed] [Google Scholar]
- Janzen D. H. Why mountain passes are higher in the tropics. Am. Nat. 101, 233–249 (1967). [Google Scholar]
- Dunn R. R. et al. Climatic drivers of hemispheric asymmetry in global patterns of ant species richness. Ecol. Lett. 12, 324–333 (2009). [DOI] [PubMed] [Google Scholar]
- Chown S. L., Sinclair B. J., Leinaas H. P. & Gaston K. J. Hemispheric asymmetries in biodiversity – a serious matter for ecology. PloS Biol. 2, e406 (2004). [DOI] [PMC free article] [PubMed] [Google Scholar]
- Vitousek P. M. et al. Human Domination of Earth's Ecosystems. Science 277, 494–499 (1997). [Google Scholar]
- Kessell S. Gradient modeling: resource and management (Springer, New York, 1979). [Google Scholar]
- Grytnes J. A. Species-richness patterns of vascular plants along seven elevational transects in Norway. Ecography 26, 291–300 (2003). [Google Scholar]
- Kessler M. Elevational gradients in species richness and endemism of selected plant groups in the central Bolivian Andes. Plant Ecol. 149, 181–193 (2000). [Google Scholar]
- Tattersfield P., Warui C. M., Seddon M. B. & Kiringe J. W. Land-snail faunas of afromontane forests of Mount Kenya, Kenya: ecology, diversity and distribution patterns. J. Biogeo. 28, 843–861 (2001). [Google Scholar]
- Colwell R. K. & Hurtt G. C. Nonbiological gradients in species richness and a spurious Rapoport effect. Am. Nat. 144, 570–595 (1994). [Google Scholar]
- Heaney L. R. Small mammal diversity along elevational gradients in the Philippines: an assessment of patterns and hypotheses. Global Ecol. Biogeo. 10, 15–39 (2001). [Google Scholar]
- Sanders N. J. Elevational gradients in ant species richness: area, geometry, and Rapoport's rule. Ecography 25, 25–32 (2002). [Google Scholar]
- Oommen M. A. & Shanker K. Elevational species richness patterns emerge from multiple local mechanisms in Himalayan woody plants. Ecology 86, 3039–3047 (2005). [Google Scholar]
- Currie D. J. & Kerr J. T. Tests of the mid-domain hypothesis: a review of the evidence. Ecol. Monogr. 78, 3–18 (2008). [Google Scholar]
- Hillebrand H. On the generality of the latitudinal diversity gradient. Am. Nat. 163, 192–211 (2004). [DOI] [PubMed] [Google Scholar]
- Rowe R. J. & Lidgard S. Elevational gradients and species richness: do methods change pattern perception? Global Ecol. Biogeo. 18, 163–177 (2008). [Google Scholar]
- MacArthur R. H. Geographical Ecology (Harper & Rowe Publishers, New York, 1972). [Google Scholar]
- Ricklefs R. E. A comprehensive framework for global patterns in biodiversity. Ecol. Lett. 7, 1–15 (2004). [Google Scholar]
- Kelt D. A. Assemblage structure and quantitative habitat relations of small mammals along an ecological gradient in the Colorado Desert of southern California. Ecography 22, 659–673 (1999). [Google Scholar]
- Guo Q. F. Incorporating latitudinal and central-marginal trends in assessing genetic variation across species ranges. Mol. Ecol. 21, 5396–5403 (2012). [DOI] [PubMed] [Google Scholar]
Associated Data
This section collects any data citations, data availability statements, or supplementary materials included in this article.
Supplementary Materials
Global variation in elevational diversity patterns


