

Abstract
Changes in proportions of lipoprotein classes have been described in disease states in humans. In veterinary medicine, hyperlipidemia can cause complications, such as cutaneous xanthomas, liver disease, cholelithiasis, pancreatitis, glomerular disease, lipemia retinalis, or peripheral neuropathy, but there are few reports regarding lipoproteins in diseased animals. For canine serum, we partially validated continuous lipoprotein density profiling (CLPDP), a novel density gradient ultracentrifugation technique. We examined canine lipoproteins separated by CLPDP by transmission electron microscopy (TEM). We compared lipoprotein profiles between healthy control dogs (n = 29) and dogs with exocrine pancreatic insufficiency (EPI; n = 28) using CLPDP. Dogs with EPI included those untreated (EPI-NT; n = 6) and those treated with enzyme supplementation (EPI-T; n = 22). Our preliminary assay validation showed that CLPDP was repeatable (CV = 11.2%) and reproducible (CV = 10.6%) in canine serum. The diameters of lipoproteins analyzed by TEM were similar to those reported previously. Dogs in the EPI-NT group had more severe dyslipidemia than dogs in the EPI-T group. Dogs in the EPI-T group had lipoprotein profiles similar to healthy control dogs. CLPDP might be a useful tool for evaluating dyslipidemia in dogs.
Keywords: Dogs, dyslipidemia, exocrine pancreatic insufficiency, lipoprotein profile
Introduction
Lipoproteins transport lipids in the bloodstream and can be classified based on their hydrated density. In humans, these density classes include the intestinally derived chylomicrons, hepatically assembled very low–density lipoproteins (VLDL), and their lipolytic byproducts: intermediate-density lipoproteins (IDL) and low-density lipoproteins (LDL), as well as peripherally formed high-density lipoproteins (HDL).10 Altered proportions of lipoprotein classes have been described in certain human disease states, such as coronary artery disease.15 In veterinary medicine, hyperlipidemia is a general term associated with various diseases and can cause clinical complications such as cutaneous xanthomas,3 liver disease,35 cholelithiasis,1 pancreatitis,39 glomerular disease,31 lipemia retinalis, or peripheral neuropathy.14 Limited published reports are available in veterinary medicine regarding characteristics of lipoproteins in diseased animals.
In human medicine, the standard method for assessing LDL level is to estimate plasma LDL cholesterol (LDL-C) concentration by the Friedewald equation [LDL-C = (total cholesterol) – (HDL cholesterol [HDL-C]) – (triglycerides/5) in mg/dL].8 This is an effective test because delayed LDL clearance results in increased plasma LDL-C as well as increasing the modifications of LDL particles34 that make them atherogenic.2,17,21,33 However, lipoproteins are highly heterogeneous particles, and cholesterol concentrations within the lipoprotein particles do not necessarily reflect their biological properties.11 Therefore, evaluation of complete lipoprotein distributions could be more meaningful than cholesterol concentrations within lipoprotein particles.11,18
Density gradient ultracentrifugation (DGU), including rate zonal ultracentrifugation and isopycnic ultracentrifugation, has been the gold standard for separating and identifying lipoproteins based on their density.4 Typical DGU techniques are often time-consuming because they require sequential centrifugation steps. Continuous lipoprotein density profiling (CLPDP) is a novel DGU technique that uses a self-generating density gradient solution, bismuth sodium ethylenediamine tetra-acetic acid (NaBiEDTA), and a fluorescent probe, N-[7-(4-nitrobenzo-2-oxa-1,3-diazole)]-6-aminocaproyl-D-erythro-sphingosine (NBD C6-ceramide).18,38 This technique requires a single ultracentrifugation lasting 6 h, allows visualization of a continuous distribution of lipoproteins (lipoprotein profile), and permits quantification of lipoprotein fractions by calculating the area under the curve (AUC). CLPDP was initially developed to analyze human lipoprotein profiles but has been used in other species.5,22,38 A 2013 study used this technique to analyze canine lipoprotein profiles in healthy dogs.38 However, this technique has not been analytically validated in canine serum. The stability of lipoproteins for use with canine serum and the effect of freeze–thaw cycles with different storage conditions on lipoprotein profiles in canine serum have not been investigated, to our knowledge.
HDL are the predominant lipoproteins in dogs, whereas LDL predominate in humans.36 In addition, the density distributions of canine LDL and HDL particles overlap; therefore, separating LDL and HDL completely by density centrifugation alone is challenging.19,30 Thus, the density distribution of human lipoproteins cannot be simply applied to canine lipoprotein classification. The diameters of LDL and HDL in humans and dogs have been reported previously.27 One way to evaluate the application of CLPDP in canine serum is to measure the diameter of canine lipoproteins in 2 ranges, corresponding to human LDL and HDL. Observing the distribution of lipoprotein sizes could help better understand how CLPDP performs with canine lipoproteins.
Exocrine pancreatic insufficiency (EPI) is a syndrome caused by insufficient synthesis and secretion of pancreatic enzymes.29,37 Pancreatic enzymes contribute to digestion of dietary lipid (e.g., lipase and phospholipase), proteins (e.g., trypsin and chymotrypsin), carbohydrates (amylase), and other macronutrients (e.g., elastase, DNase, and RNase).6 The most common causes of EPI in dogs are acinar atrophy or chronic pancreatitis, which both result in an absolute lack of pancreatic acinar cells.29 It has been estimated that ⩾90% of the functional capacity of the exocrine pancreas must be lost before clinical signs develop.37 Clinical signs include weight loss, increased appetite, loose stool, and a poor hair coat. EPI is treated with pancreatic enzyme replacement therapy.29,37
The aims of our study were to partially validate the CLPDP technique for lipoprotein profiling in canine serum, to assess the stability of lipoproteins in canine serum under different storage conditions, to assess the freeze–thaw cycle effects on lipoprotein profiling, and to investigate the shapes and sizes of canine lipoprotein particles using electron microscopy. We hypothesized that dogs with EPI have dyslipidemia and that enzyme replacement therapy would improve the dyslipidemia. Our final goal was to compare the lipoprotein profiles of CLPDP in healthy dogs, and both treated and untreated dogs with EPI.
Materials and methods
DGU methodology and nomenclature
CLPDP was carried out as described previously with some modifications.13,38 Briefly, 1,280 µL of 0.18 M NaBiEDTA density solution (Tokyo Chemical Industry, Tokyo, Japan) was mixed with 10 µL of serum and 10 µL of NBD C6-ceramide (Cayman Chemical, Ann Arbor, MI). A 1,150-µL aliquot of the mixture was transferred into polycarbonate centrifuge tubes (Beckman Coulter, Brea, CA) and centrifuged at 868,000 × g and 4ºC for 6 h in an ultracentrifuge (Optima MAX-LP, Beckman Coulter) with a fixed angle rotor (MLA-130, Beckman Coulter). After centrifugation, tubes were immediately imaged by a fluorescence imaging system with a digital camera (Quantifire XI, Optronics, Muskogee, OK) and a metal halide continuous light source (Dolan-Jenner Industries, Boxborough, MA). Following ultracentrifugation, the image of each tube was converted to a density profile (OriginPro v.7.5, OriginLab, Northampton, MA). The tube coordinate (mm) on the x-axis of the lipoprotein profile corresponded to an actual centrifuge tube coordinate (mm) from 0 mm at the top of the tube to 33 mm at the bottom. The average intensity of fluorescence was plotted on the y-axis to produce a lipoprotein profile.
Less dense particles, such as triglyceride-rich lipoproteins (TRL), migrated near the top of the tube, whereas more dense particles, such as HDL, settled at the bottom. Total lipoprotein and fractional lipoprotein fluorescence intensities of TRL (1.010–1.019 g/mL), nominal LDL/low-HDL (1.019–1.063 g/mL), and nominal high-HDL (1.063–1.178 g/mL) were determined by measuring the AUC of each density range. AUC% for the 3 density regions were calculated by normalizing by total AUC. For analysis between healthy control dogs and dogs with EPI, numbering nomenclature of fractions 2–11 was created every 2 mm (tube coordinate) from the top of the tube, except fraction 1. Fraction 1 was determined based on the first peak (1.010–1.019 g/mL), corresponding to TRL, such as chylomicrons and VLDL. Fractions 2–8 correspond to nominal LDL/low-HDL (1.019–1.063 g/mL), and fractions 9–11 correspond to nominal high-HDL (1.063–1.178 g/mL). Total lipoprotein intensity was also determined by measuring the AUC of the entire fluorescence trace and presented as a total AUC. An HDL:LDL ratio was created to aid interpretation of the results by calculating the AUC% ratio of fraction 10 to 3. Fraction 3 corresponds to the density range of 1.023–1.027 g/mL and therefore most likely corresponds to VLDL and LDL particles.38 Fraction 10 corresponds to the density range of 1.086–1.119 g/mL, which likely corresponds to HDL particles.4,38
Part 1: Partial assay validation
CLPDP repeatability and reproducibility
CLPDP was partially validated through evaluation of coefficients of variation (CVs) for repeatability and reproducibility. Intra- and inter-assay CVs of each density region (TRL, LDL/low-HDL, and high-HDL) were calculated to determine repeatability and reproducibility, respectively. Surplus 8–12-h fasting serum from routine diagnostic samples submitted to the Gastrointestinal Laboratory (GI Lab) at Texas A&M University (College Station, TX) was randomly selected without identifying patient information. Three surplus samples were pooled for intra- and inter-assay evaluation. For determination of assay repeatability, intra-assay evaluation was performed by analyzing 10 aliquots from the pooled serum within a same run on the day received. Additional 10 aliquots from the same pooled serum were prepared for determination of assay reproducibility and were kept at −80°C until analysis. Inter-assay evaluation was performed by analyzing 10 aliquots over 10 different runs, each on a different day every 1 or 2 wk within 3 mo of initial sampling. Both AUC and AUC% were calculated for TRL, nominal LDL/low-HDL, and nominal high-HDL.
Effects of freeze–thaw cycles
Blood was obtained from 4 healthy dogs fasted for the previous 12 h. Written informed consent was obtained from all owners of enrolled dogs, and the study protocol was approved by the Institutional Animal Care and Use Committee (IACUC) of Texas A&M University (IACUC2014-0109CA). The blood was collected in serum tubes without any additives and left at room temperature for at least 40 min. Samples were centrifuged for 15 min at 1,600 × g and 20°C. Serum fractions were separated and transferred to serum tubes. Immediately after centrifugation, a baseline CLPDP lipoprotein profile was established. The remaining serum was aliquoted and stored at −80°C until analysis. Sera were thawed and refrozen 3 times within 5 d after collection, and were analyzed at each point in the freeze–thaw cycle. The CVs of each density region (TRL, LDL/low-HDL, and high-HDL) were calculated between the baseline and each freeze–thaw time point.
Lipoprotein stability
Blood was obtained from 3 healthy dogs fasted for the previous 12h. The protocol for the blood draw was as mentioned above, and the same study protocol (IACUC2014-0109CA) was used. Written informed consent was obtained from all owners of enrolled dogs. Lipoprotein profiling was performed on the day of blood collection. The remaining serum was aliquoted and stored at 4°C, –20°C, and −80°C until analysis. Serum stored at 4°C and −20°C was analyzed after 3 d, 1 wk, and 1 mo. Serum stored at −80°C was analyzed after 3 d, 1 wk, and at 1, 3, 5, 6, 8, 9, 10, 11, and 12 mo. CVs of each density region (TRL, LDL/low-HDL, and high-HDL) were calculated comparing the baseline and each time point for each storage condition.
Electron microscopy
One blood sample was obtained from a healthy dog fasted for 12 h. The protocol for the blood draw was as mentioned above, and the same study protocol (IACUC2014-0109CA) was used. The sample was collected in a non-additive serum tube and allowed to clot at room temperature for 40 min. The sample was centrifuged for 15 min at 1,600 × g and 20°C, and the serum was analyzed on the same day as collection. Ten µL of serum and 1,280 µL of the NaBiEDTA density solution were mixed well. The mixture was centrifuged at 868,000 × g for 6 h at 4°C. After centrifugation, nominal LDL/low-HDL and high-HDL ranges (1.019–1.063 g/mL and 1.063–1.178 g/mL, respectively) were manually removed by pipette based on the tube coordinates, 9.1–22.7 mm and 22.7–29.0 mm, respectively. Each fraction was desalted using 0.15 M sodium chloride solution and a centrifugal filter (Amicon Ultra-0.5 mL, MilliporeSigma, Billerica, MA). After desalting, fractions were stored at 4°C until further analysis. Within a few days, each fraction of canine serum was negatively stained with 2% phosphotungstate, and grids were examined with a transmission electron microscope (Philips Morgagni 268 TEM, FEI, Hillsboro, OR). The diameter of 550 particles was measured (ImageJ).24,26
Part 2: Clinical assay comparison
Heathy dogs
Surplus 12-h fasting serum samples from 29 privately owned dogs enrolled in other IACUC-approved studies were included. Written informed consent had been obtained from all owners of enrolled dogs. Blood was collected in serum tubes without any additives and allowed to clot for at least 40 min at room temperature. The samples were then centrifuged for 15 min at 1,600 × g and 20°C. The serum fraction was separated for a chemistry profile, and the surplus sera were stored at −80°C until lipoprotein profiling. Blood was also collected in EDTA tubes for a complete blood count (CBC). Physical examination, serum chemistry profile (Sirrus, Stanbio, Boerne, TX), and CBC (Advia 120, Siemens Healthcare, Erlangen, Germany) were performed on the same day of blood collection to confirm their health status. CLPDP was performed within 3 mo. Serum cholesterol and triglyceride (TG) concentrations were measured using a commercial benchtop clinical chemistry analyzer (Sirrus).
Dogs with EPI
Serum was obtained from 28 fasting dogs with EPI that were enrolled in a related IACUC-approved project. Written informed consent had been obtained from all owners of enrolled dogs. Dogs in this study originated throughout the United States. Serum was shipped to the GI Lab at Texas A&M University overnight with icepacks or dry ice. All laboratory analyses at the GI Lab were performed within 4 d of collection. Serum canine trypsin-like immunoreactivity (TLI) and cobalamin concentrations were measured using a commercial immunoassay system validated for use in dogs (Immulite 2000 XPI, Siemens). EPI was confirmed with TLI concentration ⩽2.5 µg/L (reference interval [RI]: 5.7–45.2 µg/L). All enrolled dogs with EPI had serum cobalamin concentrations ⩾295 pmol/L (RI: 185–669 ng/L), a criterion of the related project. Other inclusion criteria included ⩾1 y of age, presence of one or more clinical signs of EPI (e.g., polyphagia, weight loss, steatorrhea, and/or loose, voluminous, and/or malodorous stools), and no evidence of any additional disease processes based on history, physical examination, and other laboratory analyses. Serum cholesterol and TG concentrations were measured using a commercial benchtop clinical chemistry analyzer (Sirrus). Surplus serum was aliquoted and stored at −80°C until further evaluation. Lipoprotein profiles were analyzed by CLPDP within 3 mo. Dogs with EPI were categorized into 2 groups: dogs that had not been treated (EPI-NT) and those treated with enzyme supplementation (EPI-T).
Statistical analysis
Distribution of the data was assessed using the Shapiro–Wilk test and visual inspection. A parametric test (Student t-test), nonparametric test (Wilcoxon rank sum test), and nonparametric comparisons for each pair using Wilcoxon method were used where appropriate. A chi-square test was performed to test homogeneity on sex and breeds of the sample population. Significance was set at p ≤ 0.05. The Benjamini–Hochberg false discovery rate was used to calculate adjusted p value (q value) for multiple comparisons where appropriate. Significance was set at q < 0.05. Metabolomic data analysis software (MetaboAnalyst 3.0)40 was used to generate a principal component analysis (PCA) plot in order to show the clustering and overlap among lipoprotein profiles based on AUCs% of 11 fractions in healthy dogs, dogs in the EPI-T group, and dogs in the EPI-NT group.
Results
Part 1: Partial assay validation
Assay repeatability and reproducibility
The highest CV for intra-assay variability was 11.2%; the highest CV for inter-assay variability was 21.4% (Table 1).
Table 1.
Intra- and inter-assay coefficient of variation of canine serum lipoprotein density ranges evaluated by density gradient ultracentrifugation.
|
Intra-assay
|
Inter-assay | |||
|---|---|---|---|---|
| AUC | AUC% | AUC | AUC% | |
| TRL | 11.2 | 8.8 | 21.4 | 19.8 |
| LDL/low-HDL | 7.3 | 3.1 | 10.6 | 8.0 |
| High-HDL | 4.6 | 0.8 | 9.3 | 3.7 |
AUC = area under the curve; AUC% = AUC as a fraction of overall AUC; HDL = high-density lipoproteins; LDL = low-density lipoproteins; TRL = triglyceride-rich lipoproteins.
Effects of freeze–thaw cycle
The CV ranges after 3 freeze–thaw cycles at −80°C were 17.8–25.1% for TRL, ⩽10.2% for LDL/low-HDL, and ⩽4.0% for high-HDL (Table 2).
Table 2.
Inter-assay coefficient of variation for lipoprotein density ranges evaluated by density gradient ultracentrifugation in frozen canine serum stored at −80°C at 3 different times.
|
TRL
|
LDL/low-HDL
|
High-HDL | ||||
|---|---|---|---|---|---|---|
| AUC | AUC% | AUC | AUC% | AUC | AUC% | |
| First thaw | 19.6 | 21.9 | 10.1 | 8.9 | 4.0 | 1.5 |
| Second thaw | 20.7 | 17.8 | 3.6 | 2.4 | 3.7 | 1.0 |
| Third thaw | 24.8 | 25.1 | 10.2 | 7.9 | 3.7 | 1.0 |
AUC = area under the curve; AUC% = AUC as a fraction of overall AUC; HDL = high-density lipoproteins; LDL = low-density lipoproteins; TRL = triglyceride-rich lipoproteins.
Lipoprotein stability
The CVs for TRL, LDL/low-HDL, and high-HDL at 4°C for up to 1 mo were ≤19.4%, ≤14.2%, and ≤4.0%, respectively; ≤18.6%, ≤9.4%, and ≤8.2%, respectively, at −20°C for up to 1 mo; and ≤19.8%, ≤12.2%, and ≤6.2%, respectively, at −80°C for up to 1 y (Table 3).
Table 3.
Inter-assay coefficient of variation for canine serum lipoprotein density ranges evaluated by density gradient ultracentrifugation stored at up to 1 y at different temperatures.
|
4°C for 1 mo |
–20°C for 1 mo |
–80°C for 1 y | ||||
|---|---|---|---|---|---|---|
| AUC | AUC% | AUC | AUC% | AUC | AUC% | |
| TRL | 19.4 | 17.2 | 18.6 | 16.0 | 18.7 | 19.8 |
| LDL/low-HDL | 14.2 | 11.3 | 9.4 | 5.8 | 12.2 | 5.8 |
| High-HDL | 4.0 | 5 | 8.2 | 2.6 | 6.2 | 2.8 |
AUC = area under the curve; AUC% = AUC as a fraction of overall AUC; HDL = high-density lipoproteins; LDL = low-density lipoproteins; TRL = triglyceride-rich lipoproteins.
Electron microscopy
Electron microscopy showed spherical particles in both density ranges. The size range of particles within the density range of LDL/low-HDL was 9.5–29.0 nm (median: 16.1 nm; Fig. 1). The size range of particles within the density range of high-HDL was 9.7–17.2 nm (median: 13.2 nm; Fig. 2). Figures 3 and 4 present the distribution of particle diameters. Figure 3 shows that ~52% of particles within the density range of LDL/low-HDL had diameters of 11.0–17.0 nm; 47% of particles within the same range were 17.0–30.0 nm. Almost all particles within the density range of high-HDL had diameters of 10–17.5 nm (Fig. 4).
Figure 1.
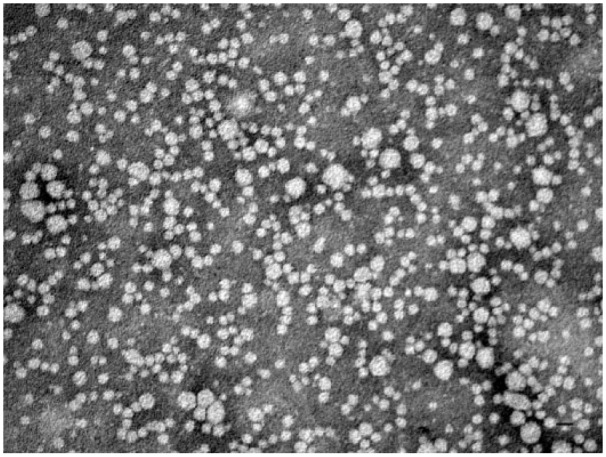
Negatively stained (2% phosphotungstate) electron micrograph of canine lipoproteins of nominal LDL/low-HDL (density range: 1.019–1.063 g/mL). Bar = 20 nm.
Figure 2.
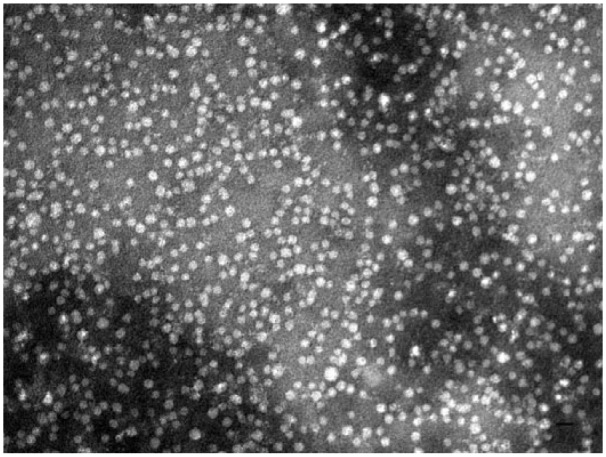
Negatively stained (2% of phosphotungstate) electron micrograph of canine lipoproteins of nominal high-HDL (density range: 1.063–1.178 g/mL). Bar = 20 nm.
Figure 3.
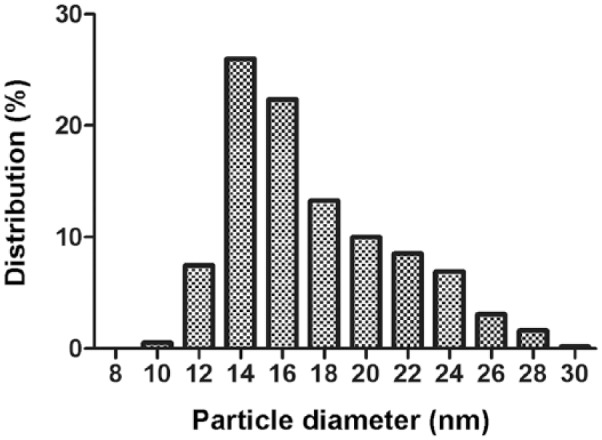
The diameter (nm) distribution of 550 canine lipoprotein particles of nominal LDL/low-HDL (density range: 1.019–1.063 g/mL).
Figure 4.
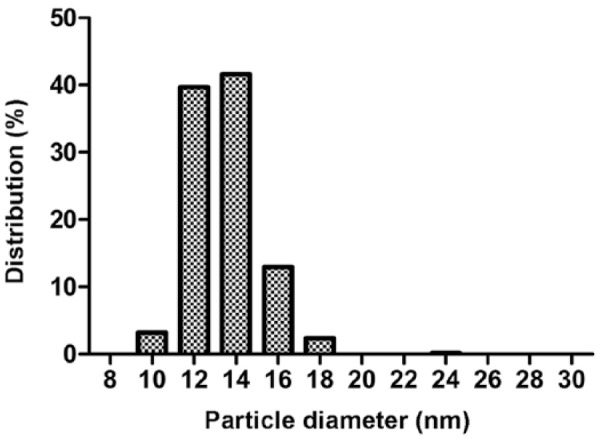
The diameter (nm) distribution of 550 canine lipoprotein particles of nominal high-HDL (density range: 1.063–1.178 g/mL).
Part 2: Clinical assay comparison
Study population
None of the parameters of breed, sex, weight (kg), and age of enrolled dogs differed significantly between healthy control dogs, dogs in the EPI-T group, or dogs in the EPI-NT group (p ⩽ 0.05; Table 4).
Table 4.
Signalment of healthy dogs and dogs with exocrine pancreatic insufficiency both treated and untreated.
| Signalment | Healthy control | EPI | ||
|---|---|---|---|---|
| EPI-NT | EPI-T | |||
| Pure breed | n (no. of breeds) | 19 (12) | 6 (3) | 17 (10) |
| Mixed breed | n | 9 | 0 | 5 |
| Males | n (neutered) | 12 (8) | 3 (1) | 8 (5) |
| Females | n (spayed) | 17 (15) | 3 (3) | 14 (12) |
| Median weight | kg (range) | 27.2 (2.7–40.1) | 24.7 (9.7–29.4) | 24.7 (2.7–37.5) |
| Median age | y (range) | 4 (1–12) | 2.7 (1–4) | 2.7 (1–14) |
EPI = exocrine pancreatic insufficiency; EPI-NT = EPI untreated; EPI-T = EPI treated with enzyme supplementation; n = number of dogs.
Serum TG and cholesterol concentrations
Serum TG concentrations in healthy control dogs (median [min.–max.] mmol/L: 0.59 [0.38–6.61] mmol/L) were significantly higher than those in the EPI-NT group (0.46 [0.27–0.57] mmol/L, p = 0.005). However, serum TG concentrations did not differ between healthy control dogs and dogs in the EPI-T group (0.54 [0.38–1.24] mmol/L, p = 0.086) as well as between dogs in the EPI-T group and the EPI-NT group (p = 0.060). Serum cholesterol concentrations in the EPI-NT group (mean ± [standard deviation (SD)]: 3.0 ± 0.93 mmol/L) were significantly lower than those in the healthy control group (6.1 ± 1.5 mmol/L, p < 0.001) or in the EPI-T group (5.1 ± 1.7 mmol/L, p = 0.005). Serum cholesterol concentrations in the EPI-T group were significantly lower than those in healthy control dogs (p = 0.031).
Lipoprotein profiles
Overlay graphs of the lipoprotein profiles for healthy control, EPI-T, and EPI-NT dog groups are presented in Figures 5–7, respectively. Fraction 1 corresponds to TRL, fractions 2–8 correspond to nominal LDL/low-HDL (1.019–1.063 g/mL), and fractions 9–11 to nominal high-HDL (1.063–1.178 g/mL).
Figure 5.
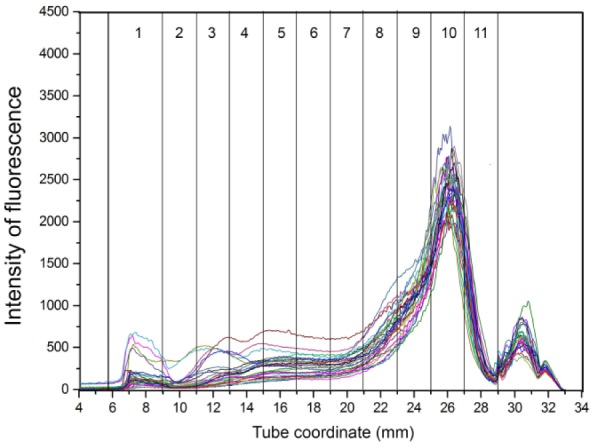
Overlay of density gradient ultracentrifugation lipoprotein profiles from 29 healthy control dogs. The x-axis shows the tube coordinate (mm), and the y-axis displays the intensity of fluorescence. Numbers in columns are lipoprotein density fractions. Most dogs had similar patterns characterized by a high peak at fraction 10.
Figure 6.
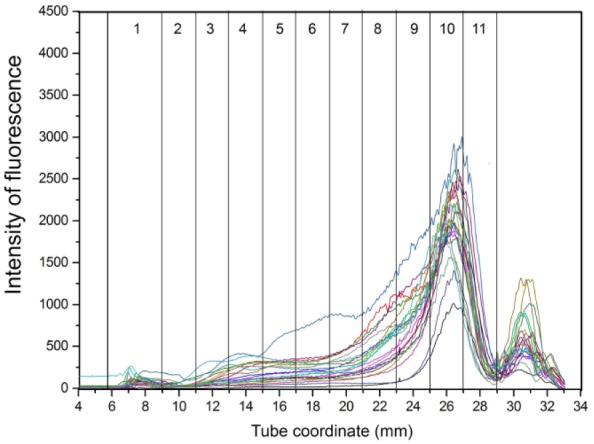
Overlay of density gradient ultracentrifugation lipoprotein profiles from dogs with exocrine pancreatic insufficiency treated with enzyme supplementation. Numbers in columns are lipoprotein density fractions. Some dogs had smaller peaks at fraction 10 as well as fractions 4–9.
Figure 7.
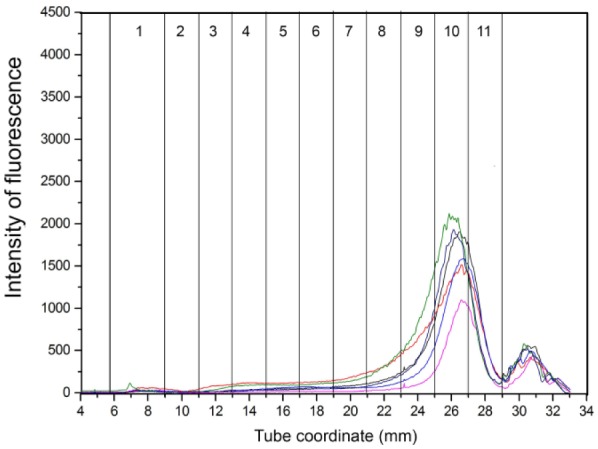
Overlay of density gradient ultracentrifugation lipoprotein profiles in dogs with untreated exocrine pancreatic insufficiency. Numbers in columns are lipoprotein density fractions. The dogs in this group had smaller peaks overall.
Total AUC and the AUCs for fractions 1–10 differed significantly among all 3 groups (healthy control, EPI-T, and EPI-NT; q < 0.05); fraction 11 did not differ significantly among those 3 groups (q = 0.125: Supplementary Table 1). Moreover, each fraction 1–10 in dogs in the EPI-NT group was significantly decreased compared to healthy control dogs and dogs in the EPI-T group (q < 0.05). However, only 5 fractions (2, 3, 5, 9, 10) differed significantly between healthy control and EPI-T groups. The AUC% for 9 fractions (2–8, 10, 11) differed significantly among the 3 groups (q < 0.05); the AUC% for 2 fractions, 1 and 9, did not differ significantly among all 3 groups (q = 0.148 and 0.081, respectively; Supplementary Table 2). The AUC% for fractions 3–11, except 9, significantly differed between healthy control and EPI-NT groups (q <0.05), and between EPI-T and EPI-NT groups (q < 0.05), but not between healthy control and EPI-T groups (q < 0.05).
The HDL:LDL ratio (Fig. 8) differed significantly between the EPI-T and EPI-NT groups (p = 0.017), and between healthy control dogs and the EPI-NT group (p = 0.004).
Figure 8.
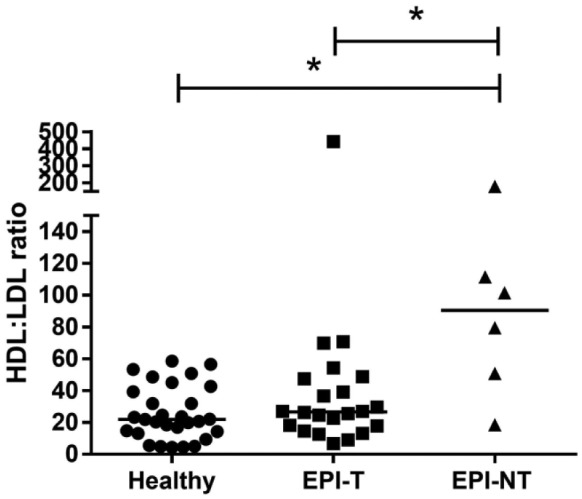
Density gradient ultracentrifugation HDL:LDL ratio (ratio of fraction 10 to 3) between healthy control dogs, dogs with exocrine pancreatic insufficiency (EPI) treated with enzyme supplementation (EPI-T), and untreated EPI dogs (EPI-NT). The ratio was significantly higher in dogs in the EPI-NT group than that in healthy control dogs or dogs in the EPI-T group (p ≤ 0.05, respectively).
Separation could be seen in the PCA plot of lipoprotein profile composition (Fig. 9), with a shift from the upper right to the bottom left side of the plot that corresponds to the differences between healthy control dogs, dogs in the EPI-T group, and dogs in the EPI-NT group.
Figure 9.
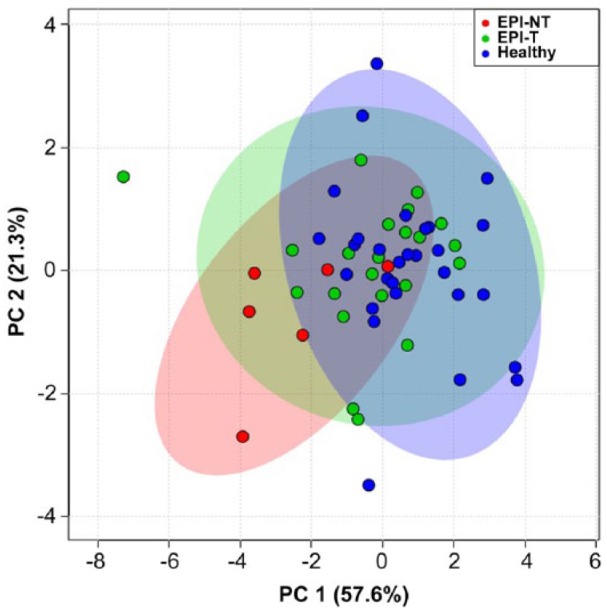
Principal component analysis plot showing the relationship of density gradient ultracentrifugation lipoprotein profiles for healthy dogs (blue) compared to treated dogs with exocrine pancreatic insufficiency (EPI-T: green) and those untreated (EPI-NT: red), with 95% confidence regions. PC 1 = 57.6%; PC 2 = 21.3%.
Discussion
The CLPDP method was initially developed to analyze lipoprotein profiles in human plasma samples based on human lipoprotein density distribution.18 The intra- and inter-assay variability with use of canine serum showed that CLPDP was repeatable and reproducible for the density ranges of nominal LDL/low-HDL and high-HDL, whereas the method was repeatable but not reproducible for TRL.28,32 We found that canine serum lipoproteins in the range of nominal LDL/low-HDL and high-HDL are stable for up to 1 mo at 4°C and −20°C as well as for up to 12 mo when stored at −80°C. However, canine nominal TRL were not stable under any of these conditions, and fresh serum may need to be used. Our findings suggest that sample handling, storage condition, and freeze–thaw cycles did not affect the assessment of lipoprotein profiles and were unlikely to affect the results obtained from fresh clinical samples in dogs with EPI. A larger sample size with a wider range of lipoprotein concentrations, including high and low values, is needed to fully validate CLPDP.
Canine HDL and LDL overlap in hydrated density, making it challenging to separate them completely based on their density.19,30 Negative-staining electron microscopy showed spherical particles in both nominal LDL/low-HDL and high-HDL density ranges. The particles within density range of LDL/low-HDL were larger than the ones within high-HDL. Approximately 52% of particles within the density range of nominal LDL/low-HDL (1.019–1.063 g/mL) were 11.0–17.0 nm diameter; 47% of particles within the same range were 17.0–30.0 nm diameter. Almost all particles within the density range of nominal high-HDL (1.063–1.178 g/mL) were 10–17.5 nm diameter. Such results are similar to previous reports on human and canine lipoprotein diameters.4,20 Our finding suggests that there is overlap of particle diameters between the 2 density ranges distributed by CLPDP.
Serum TG concentrations in untreated dogs with EPI were significantly lower than those in healthy dogs. This finding was consistent with a previous case report.16 Serum cholesterol concentrations in dogs in the EPI-NT group were significantly lower than those in healthy control dogs or dogs with EPI that were treated. Moreover, serum cholesterol concentrations in dogs with EPI were significantly lower than those in healthy control dogs even if they were treated with enzyme supplementation. A previous study reported that dogs with EPI that had an adequate response to enzyme supplementation had statistically higher serum cholesterol concentrations compared to healthy controls.25 On the other hand, dogs with EPI that had gastrointestinal signs had lower serum cholesterol concentrations.12
The lipoprotein profiles in both the EPI-NT and EPI-T groups had significantly lower AUC and AUC% in most fractions compared to healthy control dogs. Dogs in the EPI-NT group had a significantly higher HDL:LDL ratio than in the EPI-T group or healthy control dogs. However, the HDL:LDL ratio did not differ significantly between healthy control dogs and dogs in the EPI-T group. These results suggest that untreated dogs with EPI have dyslipidemia as well as disproportionate levels of HDL (fraction 10) and VLDL (fraction 3) composed of significantly lower VLDL and HDL levels compared to healthy control dogs. The PCA plot (Fig. 9) suggests that dogs in the EPI-T group had lipoprotein profiles similar to those of healthy control dogs, whereas dogs in the EPI-NT group had altered lipoprotein profiles compared to healthy control dogs. Our results suggest that enzyme supplementation therapy in dogs with EPI improves their dietary lipid assimilation, yet lipoprotein profiles and PCA plot still differed from healthy dogs. A major limitation of our study was the small sample size of the EPI-NT group. Evaluation of additional treated and untreated animals with EPI would be required to make a more definitive statement regarding the relationship between clinical signs and lipoprotein profiles after enzyme replacement therapy in dogs with EPI.
Important lipoprotein metabolism pathways might be involved in the pathogenesis of dyslipidemia in dogs with EPI. In normal physiologic condition, dietary TGs are incorporated into chylomicrons within enterocytes and released into the lymph.9 The main function of chylomicrons is to transport dietary TG into peripheral tissues as well as dietary cholesterol to the liver.7 The chylomicron remnants eventually bind to the LDL receptor and LDL receptor–related protein, and are internalized into hepatocytes. In our study, dogs in the EPI-NT group had significantly lower serum TG concentrations and TRL than did healthy dogs. This result suggests that dogs with EPI have decreased serum TG because of insufficient absorption of dietary TG if they are not treated with enzyme supplementation. In contrast to the absorption process of dietary TG, endogenously synthesized TG and cholesterol are secreted within VLDL particles from the liver. VLDL remnants produced by TG hydrolysis in peripheral tissues are taken up by the liver and further metabolized by hepatic lipase to become LDL.23 Decreased lipoproteins in the density range of VLDL and LDL in dogs with EPI might be explained by insufficient de novo fatty acid biosynthesis in the liver because of decreased absorption of carbon sources, such as glucose or amino acids from the intestines, as well as decreased cholesterol ester uptake from chylomicron into the liver. Nascent HDL particles are secreted by the liver and small intestine, and acquire phospholipids and free cholesterol from peripheral tissues and TRL via phospholipid transfer protein with cholesteryl esters that formed via the action of lecithin-cholesterol acyltransferase.7,9 Nascent HDL particles become larger and less dense HDL particles (HDL3 and HDL2). Because dogs with EPI had decreased TRL, their HDL rates were most likely decreased because of insufficient supplies of phospholipids and free cholesterol from TRL.
Supplemental Material
Supplemental material, DS1_JVDI_10.1177_1040638718793677 for Evaluation of density gradient ultracentrifugation serum lipoprotein profiles in healthy dogs and dogs with exocrine pancreatic insufficiency by Tomomi Minamoto, Joseph C. Parambeth, Rosemary L. Walzem, Harold R. Payne, Jonathan A. Lidbury, Jan S. Suchodolski and Jörg M. Steiner in Journal of Veterinary Diagnostic Investigation
Acknowledgments
The material contained in this manuscript will be published as a dissertation at Texas A&M University in recognition of partial fulfillment of requirement of a PhD degree of the first author. The abstract was presented at 2013 American College of Veterinary Internal Medicine (ACVIM) Forum, 12–15 June 2013, Seattle, WA.
Footnotes
Declaration of conflicting interests: The authors declared no potential conflicts of interest with respect to the research, authorship, and/or publication of this article.
Funding: Supported in part by Texas AgriLife Research project 8738 (RL Walzem). Other authors received no financial support for the research, authorship, and/or publication of this article.
References
- 1. Aguirre A. Diseases of the gallbladder and extrahepatic biliary system. In: Ettinger SJ, et al., eds. Textbook of Veterinary Internal Medicine. Vol. 2 8th ed. St. Louis, MO: Elsevier, 2017:1674–1680. [Google Scholar]
- 2. Chait A, et al. Susceptibility of small, dense, low-density lipoproteins to oxidative modification in subjects with the atherogenic lipoprotein phenotype, pattern B. Am J Med 1993;94:350–356. [DOI] [PubMed] [Google Scholar]
- 3. Chanut F, et al. Systemic xanthomatosis associated with hyperchylomicronaemia in a cat. J Vet Med A Physiol Pathol Clin Med 2005;52:272–274. [DOI] [PubMed] [Google Scholar]
- 4. Chapman MJ, et al. A density gradient ultracentrifugal procedure for the isolation of the major lipoprotein classes from human serum. J Lipid Res 1981;22:339–358. [PubMed] [Google Scholar]
- 5. Cornax I, et al. Mobilization of ectopic yolk in Gallus gallus domesticus: a novel reverse lipid transport process. J Exp Biol 2013;216:1949–1958. [DOI] [PubMed] [Google Scholar]
- 6. Cullen JM. Liver, biliary system, and exocrine pancreas. In: McGavin MD, Zachary JF, eds. Pathologic Basis of Veterinary Diseases. 4th ed. St. Louis, MO: Mosby Elsevier, 2007:393–461. [Google Scholar]
- 7. Dominiczak MH, Caslake MJ. Apolipoproteins: metabolic role and clinical biochemistry applications. Ann Clin Biochem 2011;48:498–515. [DOI] [PubMed] [Google Scholar]
- 8. Friedewald WT, et al. Estimation of the concentration of low-density lipoprotein cholesterol in plasma, without use of the preparative ultracentrifuge. Clin Chem 1972;18:499–502. [PubMed] [Google Scholar]
- 9. Gurr MI, et al. Transport of lipids in the blood: plasma lipoproteins. In: Gurr MI, et al., eds. Lipid Biochemistry. 5th ed. Oxford, UK: Blackwell Science, 2002:177–190. [Google Scholar]
- 10. Gurr MI, et al. Lipoproteins can be conveniently divided into groups according to density. In: Gurr MI, et al., eds. Lipid Biochemistry. 5th ed. Oxford, UK: Blackwell Science, 2002:177–179. [Google Scholar]
- 11. Hafiane A, Genest J. High density lipoproteins: measurement techniques and potential biomarkers of cardiovascular risk. BBA Clin 2015;3:175–188. [DOI] [PMC free article] [PubMed] [Google Scholar]
- 12. Hill F. Malabsorption syndrome in the dog: a study of thirty eight cases. J Small Anim Pract 1972;13:575–594. [DOI] [PubMed] [Google Scholar]
- 13. Johnson JD, et al. Metal ion complexes of EDTA as solutes for density gradient ultracentrifugation: influence of metal ions. Anal Chem 2005;77:7054–7061. [DOI] [PubMed] [Google Scholar]
- 14. Jones BR, et al. Peripheral neuropathy in cats with inherited primary hyperchylomicronaemia. Vet Rec 1986;119:268–272. [DOI] [PubMed] [Google Scholar]
- 15. Kannel WB. High-density lipoproteins: epidemiologic profile and risks of coronary artery disease. Am J Cardiol 1983;52:9B–12B. [DOI] [PubMed] [Google Scholar]
- 16. Kim JW, et al. Canine exocrine pancreatic insufficiency treated with porcine pancreatic extract. J Vet Sci 2005;6:263–266. [PubMed] [Google Scholar]
- 17. La Belle M, Krauss RM. Differences in carbohydrate content of low density lipoproteins associated with low density lipoprotein subclass patterns. J Lipid Res 1990;31:1577–1588. [PubMed] [Google Scholar]
- 18. Larner CD, et al. Developing high performance lipoprotein density profiling for use in clinical studies relating to cardiovascular disease. Anal Chem 2011;83:8524–8530. [DOI] [PMC free article] [PubMed] [Google Scholar]
- 19. Mahley RW, Weisgraber KH. Canine lipoproteins and atherosclerosis: I. Isolation and characterization of plasma lipoproteins from control dogs. Circ Res 1974;35:713–721. [DOI] [PubMed] [Google Scholar]
- 20. Mahley RW, et al. Canine lipoproteins and atherosclerosis. II. Characterization of the plasma lipoproteins associated with atherogenic and nonatherogenic hyperlipidemia. Circ Res 1974;35:722–733. [DOI] [PubMed] [Google Scholar]
- 21. Nigon F, et al. Discrete subspecies of human low density lipoproteins are heterogeneous in their interaction with the cellular LDL receptor. J Lipid Res 1991;32:1741–1753. [PubMed] [Google Scholar]
- 22. Petzinger C, et al. Conversion of α-linolenic acid to long-chain omega-3 fatty acid derivatives and alterations of HDL density subfractions and plasma lipids with dietary polyunsaturated fatty acids in Monk parrots (Myiopsitta monachus). J Anim Physiol Anim Nutr (Berl) 2014;98:262–270. [DOI] [PubMed] [Google Scholar]
- 23. Ramasamy I. Recent advances in physiological lipoprotein metabolism. Clin Chem Lab Med 2014;52:1695–1727. [DOI] [PubMed] [Google Scholar]
- 24. Rueden CT, et al. ImageJ2: ImageJ for the next generation of scientific image data. BMC Bioinformatics 2017;18:529. [DOI] [PMC free article] [PubMed] [Google Scholar]
- 25. Rutz GM, et al. Effects of exchange of dietary medium chain triglycerides for long-chain triglycerides on serum biochemical variables and subjectively assessed well-being of dogs with exocrine pancreatic insufficiency. Am J Vet Res 2004;65:1293–1302. [DOI] [PubMed] [Google Scholar]
- 26. Schneider CA, et al. NIH Image to ImageJ: 25 years of image analysis. Nat Methods 2012;9:671–675. [DOI] [PMC free article] [PubMed] [Google Scholar]
- 27. Segrest JP, et al. Structure of apolipoprotein B-100 in low density lipoproteins. J Lipid Res 2001;42:1346–1367. [PubMed] [Google Scholar]
- 28. Shah VP, et al. Bioanalytical method validation—a revisit with a decade of progress. Pharm Res 2000;17:1551–1557. [DOI] [PubMed] [Google Scholar]
- 29. Steiner J. Canine pancreatitis: diagnosis and treatment. In: Ettinger SJ, et al., eds. Textbook of Veterinary Internal Medicine. Vol. 2 8th ed. St. Louis, MO: Elsevier, 2017:1683–1688. [Google Scholar]
- 30. Suto A, et al. LC-MS/MS analysis of canine lipoproteins fractionated using the ultracentrifugation-precipitation method. J Vet Med Sci 2013;75:1471–1477. [DOI] [PMC free article] [PubMed] [Google Scholar]
- 31. Vaden SL. Glomerular diseases In: Ettinger SJ, et al., eds. Textbook of Veterinary Internal Medicine. Vol. 2 8th ed. St. Louis, MO: Elsevier, 2017:1959–1972. [Google Scholar]
- 32. Valentin M-A, et al. Validation of immunoassay for protein biomarkers: bioanalytical study plan implementation to support pre-clinical and clinical studies. J Pharm Biomed Anal 2011;55:869–877. [DOI] [PubMed] [Google Scholar]
- 33. Véniant MM, et al. Defining the atherogenicity of large and small lipoproteins containing apolipoprotein B100. J Clin Invest 2000;106:1501. [DOI] [PMC free article] [PubMed] [Google Scholar]
- 34. Walzem R, et al. Older plasma lipoproteins are more susceptible to oxidation: a linking mechanism for the lipid and oxidation theories of atherosclerotic cardiovascular disease. Proc Nat Acad Sci 1995;92:7460–7464. [DOI] [PMC free article] [PubMed] [Google Scholar]
- 35. Watson PJ. Metabolic diseases of the liver. In: Ettinger SJ, et al., eds. Textbook of Veterinary Internal Medicine. Vol. 2 8th ed. St. Louis, MO: Saunders Elsevier, 2017:1658–1662. [Google Scholar]
- 36. Watson T. Lipoprotein metabolism in dogs and cats. Comp Haematol Int 1996;6:17–23. [Google Scholar]
- 37. Wiberg M. Exocrine pancreatic insufficiency in dogs. In: Bonagura JT, Twedt DC, eds. Kirk’s Current Veterinary Therapy. 14th ed. St. Louis, MO: Saunders Elsevier, 2009:531–534. [Google Scholar]
- 38. Xenoulis PG, et al. Novel lipoprotein density profiling in healthy dogs of various breeds, healthy Miniature Schnauzers, and Miniature Schnauzers with hyperlipidemia. BMC Vet Res 2013;9:47. [DOI] [PMC free article] [PubMed] [Google Scholar]
- 39. Xenoulis PG, et al. Investigation of hypertriglyceridemia in healthy Miniature Schnauzers. J Vet Intern Med 2007;21:1224–1230. [DOI] [PubMed] [Google Scholar]
- 40. Xia J, Wishart DS. Using MetaboAnalyst 3.0 for comprehensive metabolomics data analysis. Curr Protoc Bioinformatics 2016;55:14.10.1–14.10.91. [DOI] [PubMed] [Google Scholar]
Associated Data
This section collects any data citations, data availability statements, or supplementary materials included in this article.
Supplementary Materials
Supplemental material, DS1_JVDI_10.1177_1040638718793677 for Evaluation of density gradient ultracentrifugation serum lipoprotein profiles in healthy dogs and dogs with exocrine pancreatic insufficiency by Tomomi Minamoto, Joseph C. Parambeth, Rosemary L. Walzem, Harold R. Payne, Jonathan A. Lidbury, Jan S. Suchodolski and Jörg M. Steiner in Journal of Veterinary Diagnostic Investigation