Abstract
Purpose: Obesity, defined as a body mass index (BMI) exceeding 30 kg/m2, is a serious health problem, which can be called an epidemic on a global scale and is one of the most important causes of preventable death. The aim of this study was to assess ectopic fat accumulation in pancreas, liver and skeletal muscle in patients with obesity, overweight and normal BMI in correlation with metabolic syndrome (MetS).
Patients and methods: The study included 267 consecutive patients who underwent a standard clinical assessment with BMI calculation. Ectopic fat accumulation in pancreas, liver, and skeletal muscle was evaluated by magnetic resonance imaging (MRI) using fat–water separated Dixon imaging. MetS was defined according to the criteria modified by the National Cholesterol Education Program Adult Treatment Panel III Guidelines. Central obesity was defined using gender and ethnic-specific values for waist circumference.
Results: There was a statistically significant correlation between the degree of steatosis of the assessed organs and BMI value as well as waist circumference ratio, that determined the degree of central obesity. It was found that the most rapid relative fat accumulation was in muscle, then in pancreas and then in liver. Higher steatosis of pancreas, liver, and muscle was demonstrated depending on the number of the satisfied MetS criteria.
Conclusion: Knowing that pancreatic fatty disease is a risk factor for MetS, it seems that assessment and monitoring of ectopic fat accumulation may have important clinical implications and may be used in the prediction of metabolic risk and its early prevention.
Keywords: magnetic resonance imaging, obesity, pancreatic steatosis, liver steatosis, metabolic syndrome, fat fraction
Introduction
Obesity, defined as a body mass index (BMI) exceeding 30 kg/m2, is a very serious health problem of the twenty-first century, which is becoming an epidemic on a global scale and is one of the most important causes of preventable death.1,2
According to WHO data, the number of obese people in the world has doubled since 1980. In 2016 there were more than 1.9 billion overweight adults, of whom 650 million were obese, representing about 13% of the global adult population, including 11% of men and 15% of women.2
Obesity leads to excessive ectopic fat infiltration of many organs, including liver, heart, pancreas, skeletal muscles and kidneys, that can have severe metabolic and clinical implications.3–12
Excess fat accumulation results in the development of an elevated number of many serious health problems, including metabolic syndrome (MetS), type 2 diabetes (T2DM) and cardiovascular disease, and correlates significantly with increased mortality.13–17 A particularly important problem is MetS associated with obesity, which consists of at least three of these five abnormalities: (1) central obesity; (2) high triglyceride (TG) level; (3) decreased HDL cholesterol level; (4) high blood pressure; and (5) elevated fasting glucose level or previously diagnosed metabolic disorders.18,19
MetS is associated with a fivefold increased risk of the development of T2DM, twofold higher risk of cardiovascular disease, twofold to fourfold higher risk of stroke, three to four times increased risk of myocardial infarction and two times higher death rate due to coronary events.20,21 All these factors lead to around 3.4 million adults dying every year in the world because of diseases related to overweight and obesity.4
Central obesity is considered to be the main cause of insulin resistance and is closely connected with the other four components of MetS.3–10,22,23
Studies using CT to assess MetS revealed that accumulation of visceral adipose tissue is the best predictor of MetS for women, and is also good for men.24 The current research, however, suggests that fat distribution is a better marker of metabolic risk than obesity itself. That is why pancreatic steatosis not only strongly correlates with the prevalence of MetS but also corresponds with a number of its components.3,9,25,26 Regarding fatty pancreas and non-alcoholic fatty pancreatic disease (NAFPD), there is a twofold increase in susceptibility to the development of MetS.5,27
In the early stages of MetS, deleterious and progressive changes in each organ are often asymptomatic and possibly reversible. Consequently, a lifestyle modification including weight loss and increasing physical activity can reduce morbidity and mortality of MetS-related diseases.4,15,28,29
Pancreatic fatty disease is a risk factor for MetS. It seems that the assessment of the amount of ectopic fat accumulation may have important clinical implications by monitoring steatosis level. It can also be used in metabolic risk prediction and its early prevention or therapeutic intervention.
As far as we are aware, a direct comparison between ectopic fat accumulation in the three tissues (liver, pancreas, and muscle) and their impact on metabolic disorders has not yet been performed.
The aim of this study was to assess ectopic fat accumulation in pancreas, liver and skeletal muscle in patients with obesity, overweight and normal BMI in correlation with the presence of central obesity and Mets.
Material and methods
The study protocol was approved by the Local Ethical Committee (Independent Bioethics Commission for Research of the Medical University of Gdansk, Poland). The study was conducted in accordance with the Declaration of Helsinki.
All participants provided informed written consent for abdominal magnetic resonance imaging after they had been informed about the purposes and methods of the examination. All authors had access to study data and reviewed and approved the final manuscript.
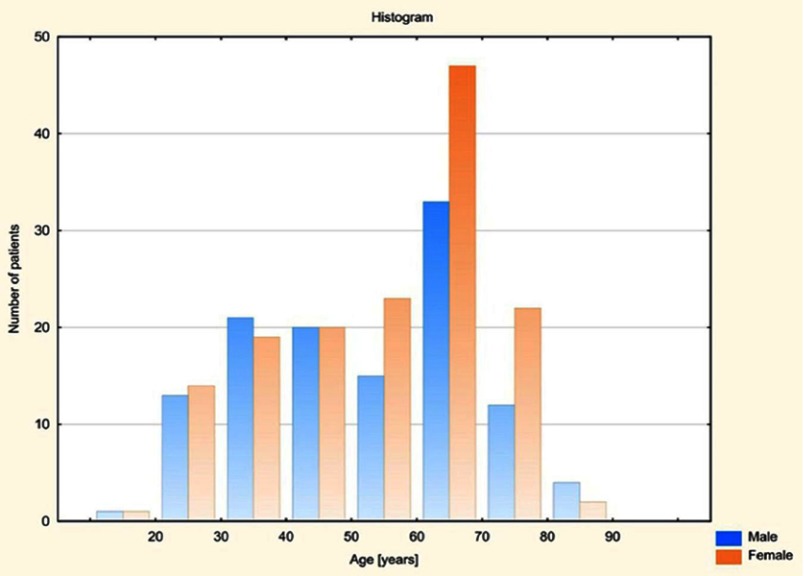
This prospective study included 267 consecutive individuals of Caucasian origin (148 women aged from 19 to 82, mean 54.97 and 119 men aged from 18 to 83, mean 52.09) (Figure 1) who were referred to abdominal magnetic resonance imaging (MRI) and underwent a standard clinical assessment, physical examination and laboratory tests. Subjects were referred for MRI examination from the Department of Gastroenterology and Hepatology and from the Department of General Endocrine and Transplant Surgery, University Clinical Centre in Gdansk and also from their clinics. All examinations were performed in the II Department of Radiology, University Clinical Centre in Gdansk between January and August 2018. The material was random; the selection of subjects was not planned statistically.
Figure 1.
Age distribution for both genders in the study group.
The clinical data, including medical history, medication and alcohol drinking habits of all participants were collected. BMI was calculated by dividing weight in kilograms by square of the height in meters. The commonly accepted BMI ranges were used: underweight – less than 18.5 kg/m2, normal weight from 18.5 to 24.9, overweight from 25 to 29.9 and obese ≥30 kg/m2 (including class I obesity 30.0–34.9, class II obesity 35.0–39.9 and class III obesity ≥40 kg/m2). Waist circumference was measured at a level midway between the lower rib margin and the iliac crest in the horizontal position.
MetS was defined according to the criteria modified by the National Cholesterol Education Program Adult Treatment Panel III Guidelines.
Central obesity was defined using ethnic-specific values for waist circumference in Europe which is ≥80 cm for women and ≥94 cm for men. Due to the different reference values of waist circumference, depending on gender, a universal value defined in percent and called Waist Circumference Ratio (WCR) was created for both groups. The variable marked as WCR [%] represents the ratio of waist circumference of the patient to the reference value, which is 80 cm for a woman and 94 cm for a man. For women, for the limit value of 80 cm, WCR amounts to 100% (80/80×100%), in the case of normal waist circumference (<80 cm) below 100% and for central obesity >100%. Similarly, for men for the limit value of 94 cm, WCR amounts to 100% (94/94×100%), in the case of normal waist circumference (<94 cm) below 100% and for central obesity >100%.
High TG level was confirmed when the range limit of 150 mg/dL was exceeded. It was assumed that a reduced HDL cholesterol level was less than 40 mg/dL for men and less than 50 mg/dL for women. Hypertension was diagnosed if systolic or diastolic blood pressure was elevated above 130/85 mmHg, or in the case of the previously diagnosed hypertension treatment. Impaired fasting glucose level was defined as ≥100 mg/dL, or in the case of previously diagnosed T2DM.
Abdominal MRI exams were performed on a 1.5 T Siemens Magnetom Aera system (Siemans, Munich, Germany). Ectopic fat accumulation in pancreas, liver and skeletal muscle was evaluated in MRI using the fat–water separated Dixon imaging technique which uses a chemical shift between resonance frequencies of protons bound in fat and water. A quantitative assessment of fat accumulation was achieved by computing the percentage value of fat fraction, which is fat signal divided by the sum of fat and water signals and then multiplied by 100.
To measure pancreatic fat and water signal three regions of interest (ROIs) were placed in the head, body, and tail of pancreas. In order to avoid contamination from volume averaging with extrapancreatic adipose tissue, the ROIs were placed in pancreatic parenchyma so that they would be surrounded by pancreatic tissue not only within the imaging plane but also on the slices above and below. Pancreatic duct and vessels were not included in the measurement.
Liver fat was assessed by using ROIs which were as large as possible with a homogeneous signal avoiding large vessels and enlarged bile ducts.
Two additional round ROIs were drawn on bilateral paraspinal muscles at the lumbar vertebra 3 level. This is the level considered in the literature as the best for skeletal muscle as well as visceral and subcutaneous fat assessment in healthy middle-aged adults.30
The mean of all ROIs in each part of the pancreas (head, body, and tail) was calculated to determine the average fat fraction.
Average fat fraction for muscles is the arithmetic mean of fat fraction in right and left paraspinal muscles.
The general exclusion criteria were as follows: the use of medications that are potentially frequently related to liver steatosis as chemotherapeutic agents (5-FU, irinotecan, oxaliplatin), methotrexate and steroids,31 age younger than 18 years, alcohol intake of more than 30 g per day in the previous 10 years or greater than 10 g per day in the previous one year, and the lack of consent to participate in the study.
Patients who were diagnosed with toxic liver damage in laboratory tests had not been referred for MRI examination by the doctors from the Department of Gastroenterology and Hepatology and from the Department of General Endocrine and Transplant Surgery, University Clinical Centre in Gdansk.
The exclusion criterion referring to the amount of alcohol intake has been determined on the basis of most published literature regarding NAFPD defined that significant alcohol consumption is more than two drinks (~10 g of alcohol per one drink unit) per day in the previous year. Some studies have used sex‐specific definitions: >3 drinks on average per day in men and >2 drinks on average per day in women, but we used the same cutoff of alcohol intake for men and women.32 At the same time, according to the criteria of alcohol abuse, it has been shown that the amount that can develop the alcoholic liver disease corresponds to an average daily alcohol intake of 30 g, corresponding to two to three glasses of wine a day for 10 years in the past.33
Statistical analysis
To assess the interdependence between the analyzed variables, Pearson’s correlation coefficients were calculated and regression lines presented with appropriate scatter plots. Differences between the mean values in independent groups were examined by parametric Welch’s t-test or parametric one-way ANOVA. Additionally, in the case of multiple comparisons, the results of Tukey’s HSD test were introduced. Normality assumption of the data set was checked by the Shapiro–Wilk test. The level of significance was set at α=0.05. All statistical analyses were performed in Statistica version 13.1 (Dell, Inc. (Round Rock, TX, USA) 2016, data analysis software system).
Results
The study included 267 consecutive patients (148 women and 119 men) (Tables 1 and 2).
Table 1.
General features of all study group (N=267)
| Variable | Descriptive statistics whole patients group | ||||
|---|---|---|---|---|---|
| Mean | Median | Min | Max | SD | |
| Age | 53.69 | 57.00 | 18.00 | 83.00 | 16.39 |
| BMI | 25.95 | 24.93 | 15.92 | 40.40 | 4.45 |
| WCR | 108.69 | 108.51 | 74.47 | 163.75 | 16.88 |
| Fat fraction – pancreas | 8.16 | 7.00 | 2.00 | 32.00 | 5.38 |
| Fat fraction – muscles | 7.10 | 5.19 | 1.35 | 41.00 | 6.01 |
| Fat fraction – liver | 5.26 | 3.49 | 0.74 | 31.90 | 5.19 |
Abbreviation: WCR, waist circumference ratio.
Table 2.
General features of all participants depending on gender (male=119, female=148)
| Variable | Descriptive statistics, male and female group | |||||
|---|---|---|---|---|---|---|
| Sex | Mean | Median | Min | Max | SD | |
| Age | Male | 52.09 | 54.00 | 18.00 | 83.00 | 16.97 |
| Female | 54.97 | 58.50 | 19.00 | 82.00 | 15.85 | |
| BMI | Male | 25.82 | 24.76 | 15.92 | 40.40 | 4.30 |
| Female | 26.06 | 25.20 | 17.42 | 38.16 | 4.58 | |
| WCR | Male | 99.76 | 97.87 | 74.47 | 143.62 | 13.96 |
| Female | 115.88 | 114.38 | 86.25 | 163.75 | 15.57 | |
| Fat fraction – pancreas | Male | 8.39 | 7.00 | 2.00 | 27.00 | 5.61 |
| Female | 7.97 | 6.12 | 2.00 | 32.00 | 5.21 | |
| Fat fraction – muscles | Male | 6.17 | 5.00 | 1.35 | 41.00 | 6.37 |
| Female | 7.85 | 7.00 | 1.64 | 27.00 | 5.61 | |
| Fat fraction – liver | Male | 4.74 | 3.50 | 0.74 | 23.68 | 4.00 |
| Female | 5.68 | 3.42 | 0.88 | 31.90 | 5.95 | |
Abbreviation: WCR, waist circumference ratio.
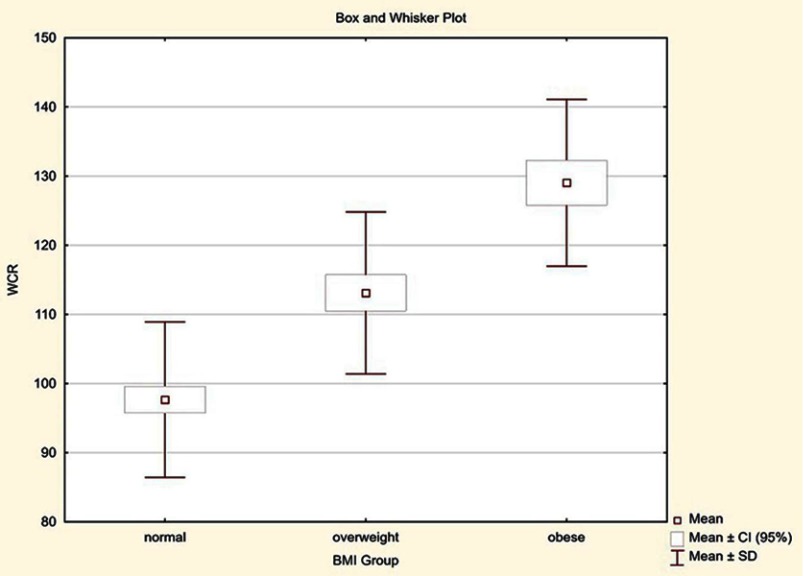
The mean BMI value in the group of women was 26.06 kg/m2 (range from 17.42 to 38.16) and 25.82 kg/m2 (range from 15.92 to 40.40) in the group of men. Of all subjects, 133 patients had normal BMI, 79 were overweight, and 55 were obese. Due to the different reference values of waist circumference, depending on gender, a universal value defined in percent was evaluated in both groups. This variable labeled as WCR [%] presents the ratio of patient’s waist circumference to the reference value and for subjects with normal waist circumference is less than 100%, while for patients with central obesity is greater than 100%. Among 148 women, average WCR was 115.88% (range 86.25–163.75%), and in the group of 119 men 99.76% (range 74.47–143.62%). In the group of all subjects with normal BMI (range between 18.5 and 24.9 kg/m2), average WCR was 97.67%. In overweight patients (BMI from 25 to 29.9 kg/m2), WCR was 113.10%, and in obese subjects (BMI ≥30 kg/m2) it was 129.04%.
The obtained results indicate that in the obese group, waist circumference is on average 29.04% higher compared to the norm. In the overweight group, waist circumference is 13.10% higher, while in the group with normal BMI waist circumference is on average 2.33% lower than the reference value (Figure 2).
Figure 2.
Distribution of waist circumference ratio (WCR) in the study group depending on BMI.
Comparing the value of WCR in patients with normal BMI which ranged from 74.47% to 125.00%, it was observed that some of them had high waist circumferences. It was found that among 133 patients with normal BMI, 57 subjects (42.86%) exceeded normal waist circumference, of which as much as 85.96% were women (49 patients), and only 14.04% were men (eight patients).
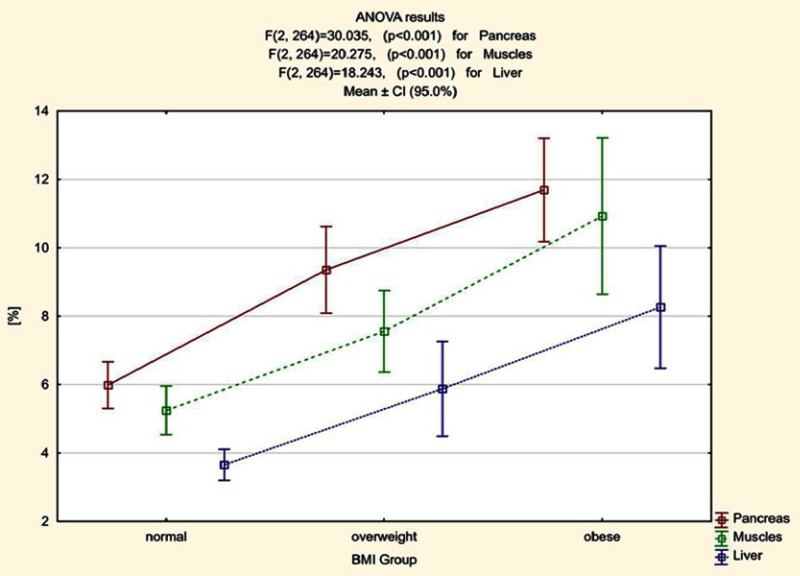
Based on the obtained results we calculated that the average percentage value of fat fraction in patients with normal BMI was 5.98%. In overweight patients it was 9.36% and in obese subjects it was 11.69%. The average percentage value of fat fraction in skeletal muscle in patients with normal BMI was 5.25%. In overweight patients it was 7.56% and in obese subjects it was 10.93%. The average percentage value of liver fat fraction in patients with normal BMI was 3.66%, in overweight patients it was 5.88% and in obese subjects it was 8.26% (Figure 3).
Figure 3.
Mean fat fraction [%] in pancreas, muscle and liver and confidence intervals for averages (95.0%) in patients with obesity, overweight and normal BMI.
Statistically significant differences between all pairs of variables (normal BMI vs overweight, normal BMI vs obese and overweight vs obese) concerning the amount of fat accumulation in the pancreas, muscle and liver were found (Table 3).
Table 3.
Characteristics of the subjects included in the study divided on the basis of BMI (normal weight, overweight and obese) in terms of fat accumulation value in the pancreas, muscle and liver and the number of MetS criteria met
| Variable | ANOVA results | ||||||
|---|---|---|---|---|---|---|---|
| BMI group | N | Mean | Median | SD | F | P | |
| Pancreas fat fraction | normal | 133 | 5.98 | 5,00 | 3,99 | 30.035 | <0.001 |
| overweight | 79 | 9.36 | 8,00 | 5,66 | |||
| obese | 55 | 11.69 | 10,00 | 5,58 | |||
| Muscles fat fraction | normal | 133 | 5.25 | 4.00 | 4.14 | 20.275 | <0.001 |
| overweight | 79 | 7.56 | 7.00 | 5.31 | |||
| obese | 55 | 10.93 | 8.00 | 8.46 | |||
| Liver fat fraction | normal | 133 | 3.66 | 2.83 | 2.67 | 18.244 | <0.001 |
| overweight | 79 | 5.88 | 4.10 | 6.19 | |||
| obese | 55 | 8.26 | 5.88 | 6.62 | |||
| Number of metabolic syndrome criteria | normal | 109 | 0.95 | 1.00 | 1.03 | 38.044 | <0.001 |
| overweight | 74 | 1.84 | 2.00 | 0.98 | |||
| obese | 52 | 2.33 | 2.00 | 0.96 | |||
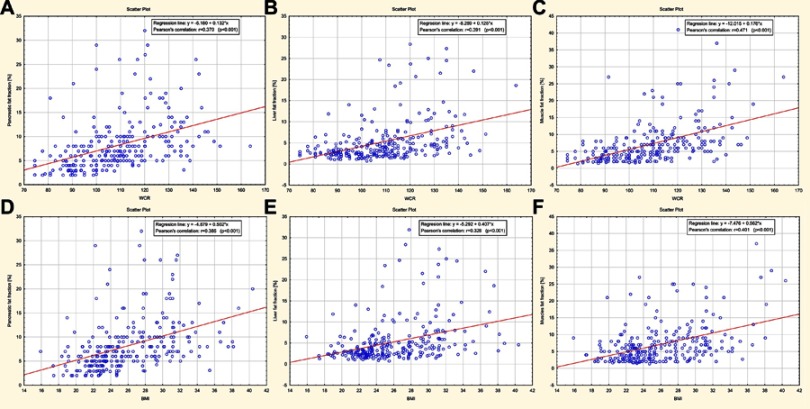
There was a statistically significant, moderate positive correlation between the extent of steatosis of evaluated organs and BMI value as well as expressed in percent variable WCR that determines the degree of central obesity. Excess fat accumulation in pancreas, liver, and muscle alongside BMI and WCR increase was observed, which is graphically illustrated by scatter plots (Figure 4A–F).
Figure 4.
(A–F) Scatter plots graphically illustrating the percentage of excessive fat accumulation in pancreas, liver, and muscle alongside an increase in waist circumference ratio (WCR) and BMI values.
Based on the WCR values analysis, it was found that the most rapidly relative fat accumulation among the assessed organs was in muscle, then in the pancreas and lastly in the liver. It was shown that when waist circumference increases by 1% (percentage point) in relation to the reference value, fat fraction increases by 0.18% (SE=0.02%) for muscles, by 0.13% (SE=0.02%) for pancreas and by 0.12% (SE=0.02%) for the liver. Regarding BMI, we demonstrated that fat accumulation also occurs most rapidly in muscle, then in the pancreas and lastly in the liver. It was estimated that when BMI increased by one unit, fat fraction increased by 0.56% (SE=0.08%) for muscles, by 0.50% (SE=0.07%) for pancreas and by 0.41% (SE=0.07%) for the liver.
A comparative analysis of fat accumulation in organs in a group of 133 patients with normal, up to 24.9 kg/m2 BMI, was performed, depending on whether waist circumference measured in centimeters exceeds the reference values or not. The patients were divided into two groups: I – with normal BMI and without central obesity, and II – with normal BMI but higher than reference waist circumference. Statistically significant differences in fat accumulation in all assessed organs between the group of patients with normal BMI and normal waist circumference (group I) and the group with normal BMI, but with a higher than reference waist circumference (group II) were observed. The most significant differences between the two groups of patients were found in fat fraction in muscle (Table 4).
Table 4.
Mean fat accumulation in the pancreas, liver and skeletal muscle(s) in patients with normal BMI and without central obesity (group I, N=76) and with normal BMI but higher than reference waist circumference (group II, N=57)
| Variable | Welch’s t-test for independent groups | |||
|---|---|---|---|---|
| Mean ± SD Group 1 |
Mean ± SD Group 2 |
T | P | |
| Pancreas fat fraction % | 5.338±3.567 | 6.846±4.372 | −2.127 | 0.036 |
| Muscle fat fraction % | 4.259±3.344 | 6.561±4.726 | −3.136 | 0.011 |
| Liver fat fraction% | 3.205±2.092 | 4.258±3.200 | −2.161 | 0.033 |
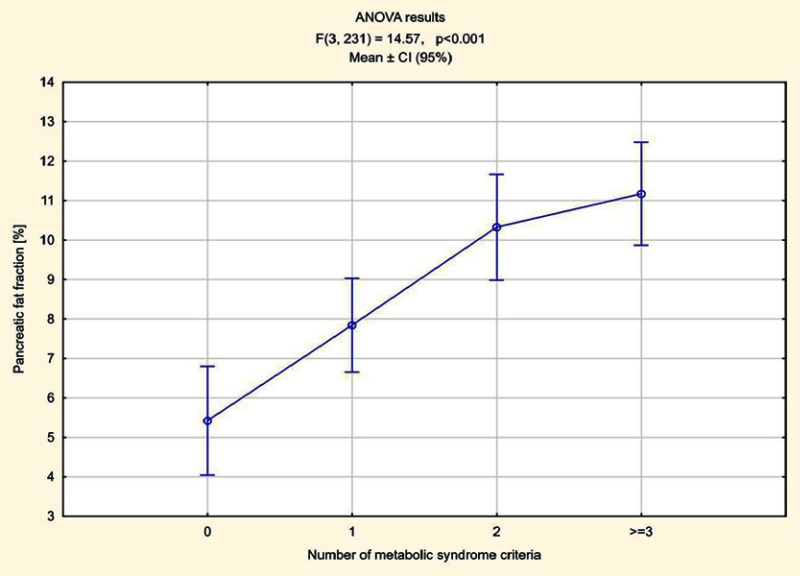
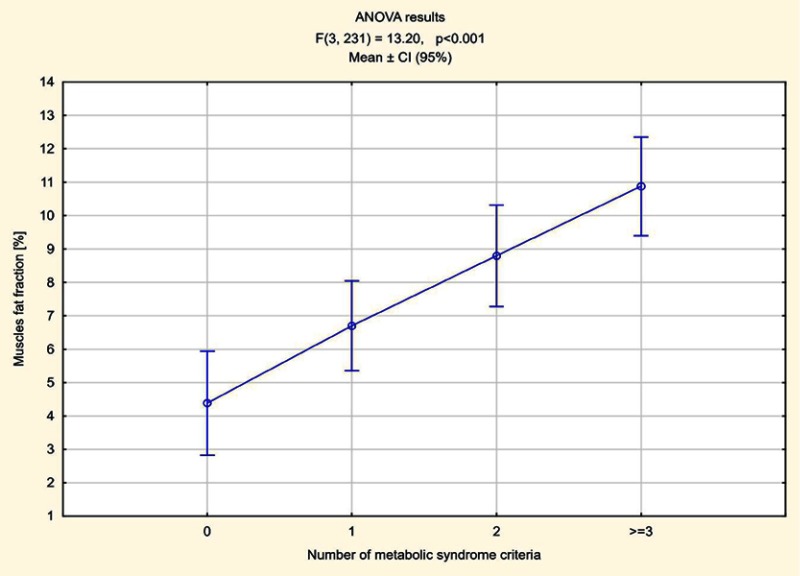
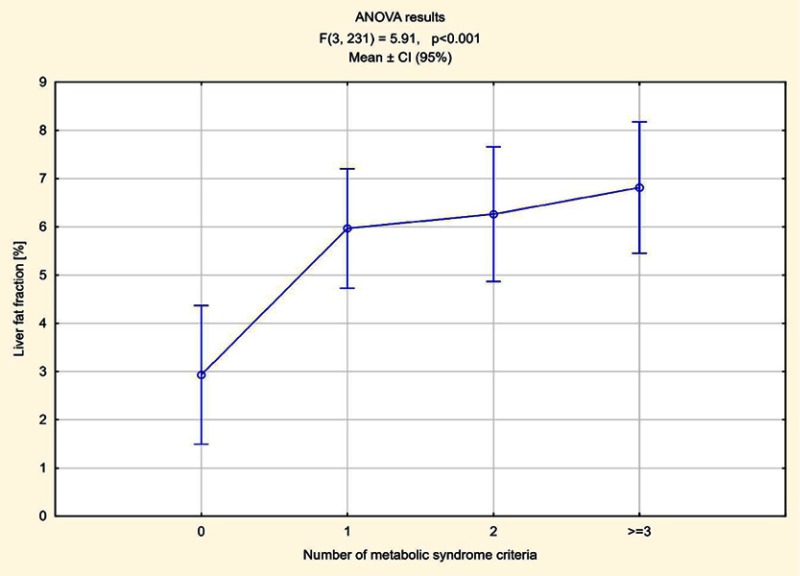
The number of elements meeting MetS criteria was calculated in all patients. In 70 patients one component of MetS was found, in 55 two criteria were met, in 52 patients three, in five subjects four and in one all five components of MetS were present. Higher pancreas steatosis depending on the number of fulfilled MetS criteria was demonstrated, ranging from an average of 7.84% in patients who met one criterion to 13% in a patient meeting all five criteria. The average pancreatic fat accumulation in patients with diagnosed MetS, ie meeting three criteria or more, exceeded 11% (Figure 5). In the remaining patients in whom no components of MetS were observed, the average steatosis of the pancreas was 5.42%. The relations between fat accumulation in muscle and liver, and the number of fulfilled MetS criteria were less expressed, especially for liver (Figures 6 and 7).
Figure 5.
Pancreas steatosis depending on the number of fulfilled MetS criteria.
Figure 6.
Muscle steatosis depending on the number of fulfilled MetS criteria.
Figure 7.
Liver steatosis depending on the number of fulfilled MetS criteria.
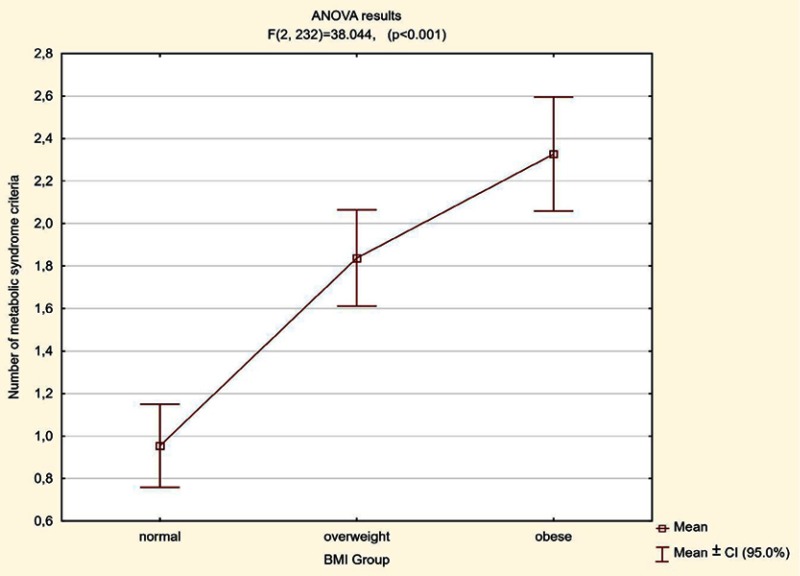
Regarding BMI value, the mean quantity of MetS criteria increased with the growth in BMI from 0.96 in patients with normal BMI, to an average of 1.84 in overweight patients, up to an average 2.33 in obese patients. There were statistically significant differences between all pairs of variables (normal BMI vs overweight, normal BMI vs obese, overweight vs obese) in terms of the number of the fulfilled MetS (Table 3, Figure 8).
Figure 8.
Relation between the average number of fulfilled criteria of MetS depending on the BMI value.
The number of the fulfilled criteria of MetS in 133 patients with normal BMI depending on waist circumference was also evaluated.
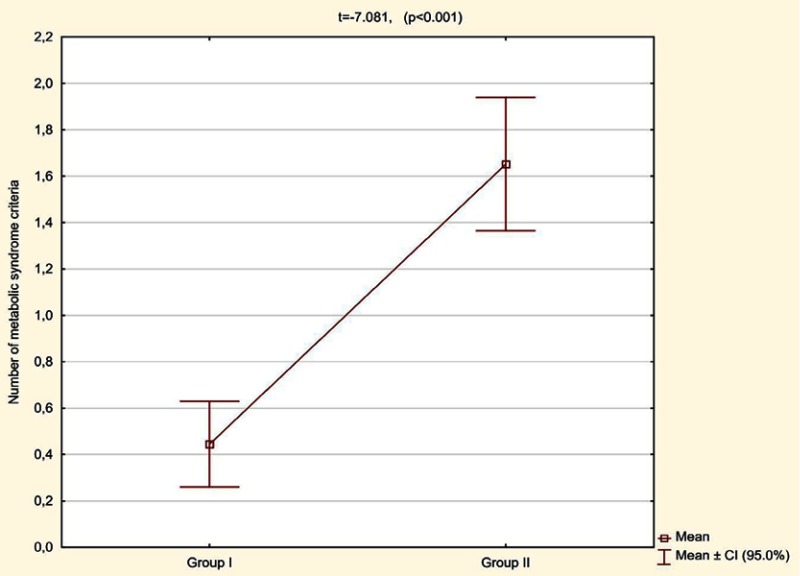
A statistically significant difference (p<0.001) was found in the average number of MetS criteria met, which in the patients with normal BMI and without central obesity (group 1) was 0.44 (CI 95% 0.26–0.63) and in the patients with normal BMI but with higher than reference values of waist circumference (group 2) was 1.65 (CI 95% 1.36–1.94) (Figure 9).
Figure 9.
Number of metabolic syndrome criteria met in patients with normal BMI depending on waist circumference (group I – without central obesity, group II – with higher than the reference value of waist circumference).
Discussion
In the presented study, we assessed ectopic fat accumulation in pancreas, liver and skeletal muscle in 267 consecutive patients with obesity, overweight and normal BMI, in correlation with the presence of central obesity and MetS. Because of the different reference values of waist circumference depending on gender, we introduced a completely novel numerical value that is universal for both groups. It is expressed in percent and described as Waist Circumference Ratio. WCR represents the ratio of waist circumference of a patient to the reference value, and makes it possible to assess central obesity regardless of BMI values of patients.
Analyzing WCR, it was found that in the obese group waist circumference was on average around 29% higher compared to the norm, while in the overweight group it was about 13% higher in relation to the reference value. It seems that the average WCR values that were above the normal range for this study are consistent with the tendency of the general population in which the occurrence of overweight and obesity increases in every decade. For instance, abdominal obesity is currently estimated to be present in approximately 6.5 million residents of Poland.34
Because obesity defined by high BMI was not a criterion for inclusion in this study, it seems that good correlation of WCR with MetS markers does not mean that the study cohort was more prone to obesity compared to the general population.
The most interesting results were obtained in the group of 133 patients with normal BMI. It turned out that despite correct body index mass, almost 43% of the subjects had a high WCR, the majority of which were women. This is particularly important considering animal model studies which have shown that an offspring exposed to both maternal obesity and obesogenic diet have significantly higher body weight and more expressed metabolic disorder in the future5,35,36
The results of the study of Oben et al confirm that maternal diet-induced obesity induces an obese, hypertensive phenotype in offspring. In these dysmetabolic progeny, significant increases in body weight and pancreas tissue TG content were observed. The work also emphasizes that an increase in the incidence of pancreatic cancer could be programmed by an increasing rate of maternal obesity.35 It must be pointed out that waist circumference has recently been considered to be more indicative of the MetS profile than BMI, and so both BMI along with abdominal obesity are risk factors of severe health consequences such as T2DM, cardiovascular diseases and a range of other conditions, including some forms of cancer.15,37–41 Our results, analyzing the comparison between BMI and WCR with MetS categories, are in line with this current idea. WCR, the new indicator we have introduced, allows us to identify the onset of metabolic abnormalities, even with the normal range of BMI; hence it seems that it can be used in metabolic risk prediction and its early prevention through lifestyle modification or therapeutic intervention accordingly.
Low fat content in the pancreas is a common phenomenon and is not associated with clinical symptoms.6,42 However, in the available literature, the reported fat accumulation values are often different.13,22,26,43
In the paper presented by Wong et al, including 3,000 local Hong Kong residents aged 18 years or above, it was found that in 90% of the examined subjects who did not abuse alcohol and did not meet any of MetS criteria, fat content ranged from 1.8% to 10.4%.22 A prospective population-based Study of Health in Pomerania including 1,367 volunteers (563 men and 678 women; median age 50 years) showed that the mean unadjusted pancreatic fat content was 4.4%.26 A nested, prospective case-control study in the southern part of Germany containing 385 subjects (median age: 57 years, 58.2% males), of which 53 were classified as subjects with diabetes, 95 as prediabetes, and 237 as controls showed that median pancreatic fat fraction was 5.2% and it was significantly higher in subjects with prediabetes and diabetes as compared to controls (6.2% vs 8.6% vs 4.9%).37 The first study that has investigated pancreatic fat disposition postmortem, carried out by Ogilvie, involved 19 obese patients (17 females, mean age 52) and in 19 non-obese subjects (11 females, mean age 48.5) who died due to a variety of causes (eg chronic interstitial nephritis, cerebral abscess, chronic endocarditis, lobar pneumonia). This autopsy study demonstrated that obese patients had an average of 17.1% fat content in the pancreas, while non-obese patients showed an average of 9.3% fat accumulation in the organ.44 The last meta-analysis quantified normal mean pancreatic fat at the level of 4.5±0.9%, and Singh et al recommended that the normal pancreatic fat cut-off point of 6.2% is used in the prospective studies.27
These values are similar to the data we presented, which assessed that the average ectopic fat accumulation in the pancreas in patients with normal BMI was 5.98%, in overweight people it was 9.36%, and in obese patients it was 11.69%.
The results in the literature showing correlations between pancreatic steatosis, BMI, waist circumference and the number of MetS criteria met are often inconsistent.
In the paper presented by Patel et al it was found that pancreatic fat did not correlate with age, BMI and diabetes status, while fat content in the organ increased significantly with increasing histology-determined liver steatosis.43 Contrary, Stamm in 112 unselected autopsies of adult patients without known pancreatic disease (except adult-onset diabetes mellitus) showed that the presence of fat in the pancreas increases with age and an amount >25% is associated with a significantly higher risk of T2DM.45 Heber et al noted that although pancreatic fat fraction differs significantly between subjects with prediabetes, diabetes, and controls, this association may be confounded by age, gender, and the amount of visceral adipose tissue.37 Conversely, in the paper of Kühn et al no significant differences in pancreatic fat fraction among subjects with normal glucose tolerance, prediabetes, and T2DM were found.26 Wong et al presented that nonalcoholic fatty liver disease is associated with central obesity, hypertriglyceridemia, hyperferritinemia and insulin resistance.22 In the paper presented by Heni et al it was shown that pancreatic fat content positively correlates with BMI, visceral adipose tissue and waist circumference. No association of pancreatic fat amount with age, sex, and hepatic fat content was found.46
In contrast to the part of the publications in which it was found that ectopic fat content in pancreas did not correlate with BMI or the presence or absence of diabetes, the values obtained by us showed statistically significant, moderate positive correlation, both with BMI and WCR as well as the average number of the met criteria for MetS.
A similar correlation was found in the case of liver and muscle, where it was shown that the average muscle steatosis in patients with normal BMI was 5.25%, in overweight patients it was 7.56%, and in obese patients it was 10.93%. In the case of the liver, these values were 3.66%, 5.88%, and 8.26%, respectively.
In the available literature, we did not find any information regarding the dynamics of fat accumulation in various organs. Whereas in the material analyzed by our team, it was shown that fat accumulation is relatively fastest in muscle, then in the pancreas and finally in the liver.
We have calculated that increased waist circumference by 1% in relation to the reference value leads to an increase in fat accumulation by about 0.18% for muscles, 0.13% for pancreas and 0.12% for the liver. We have also shown that when BMI increases by a unit, fat infiltration increases by 0.56% for muscles, by 0.5% for pancreas and by 0.41% for the liver.
It seems that these data are very interesting and the assessment of fatty infiltration dynamics of particular organs and their impact on the risk of MetS require better knowledge and further research.
The fact that ectopic fat accumulation in various organs increases with increasing BMI seems to be a logical conclusion, and similar results were presented in other works.30,37
In the analyzed group of patients, the comparison of people with normal body weight but who are different in terms of normal or high waist circumference is of the greatest importance.
In these two groups of patients, statistically significant differences were found not only in the amount of fat accumulated in the pancreas, liver, and muscle but also in the number of MetS criteria met.
It seems to us that these are the most interesting results of the work presented, which indicate that the BMI measurement alone is not sufficient to determine the metabolic risk. Some authors suggest that metabolic risk factors should be screened through the waist circumference measurement regardless of BMI.47 On the other hand, many studies have shown that BMI has comparable efficiency to waist circumference in predicting the development of T2DM and other metabolic disorders.48–51 For us, only the combined assessment of BMI and WCR makes it possible to determine comprehensively the profile of MetS and also to assess the risk of serious diseases, which can be reduced, among other things, by modifying the lifestyle.
It should be emphasized that in the early stages of MetS, deleterious and progressive changes in each organ are often asymptomatic and possibly reversible.15,52
Of course, further research is needed to show what clinical implications of fat accumulation in various organs are, both in the terms of their damage and systemic effects.
Conclusion
In this study, we found that with the increase in BMI, WCR, and the number of metabolic syndrome criteria met, among all organs assessed by us, fat accumulation in pancreas was the most relevant. For that reason, we believe that the assessment of ectopic fat accumulation within the pancreas with the simultaneous assessment of WCR can play a significant role and may have important clinical implications. By monitoring these two elements, the metabolic risk may be predicted, and therefore, early prevention or possible therapeutic intervention may be applied.
Abbreviation list
MRI, magnetic resonance imaging; BMI, body mass index; MetS, metabolic syndrome; WCR, waist circumference ratio; T2DM type 2 diabetes mellitus; HDL, high-density lipoproteins; TG, triglyceride; NAFPD, non-alcoholic fatty pancreatic disease; ROI, region of interest.
Disclosure
The authors report no conflicts of interest in this work.
References
- 1.OECD. OECD obesity update. 2017. Available from: https://www.oecd.org/els/health-systems/Obesity-Update-2017.pdf. Accessed July 20, 2018.
- 2.World Health Organization. Obesity and overweight. 2017. Available from: http://www.who.int. Accessed July 25, 2018
- 3.Sakai NS, Taylor SA, Chouhan MD. Obesity, metabolic disease and the pancreas – quantitative imaging of pancreatic fat. Br J Radiol. 2018;91:20180267. doi: 10.1259/bjr.20180267 [DOI] [PMC free article] [PubMed] [Google Scholar]
- 4.Catanzaro R, Cuffari B, Italia A, Marotta F. Exploring the metabolic syndrome: nonalcoholic fatty pancreas disease. World J Gastroenterol. 2016;22(34):7660–7675. doi: 10.3748/wjg.v22.i34.7660 [DOI] [PMC free article] [PubMed] [Google Scholar]
- 5.Tariq H, Nayudu S, Akella S, Glandt M, Chilimuri S. Non-alcoholic fatty pancreatic disease: a review of literature. Gastroenterol Res. 2016;9(6):87–91. doi: 10.14740/gr731w [DOI] [PMC free article] [PubMed] [Google Scholar]
- 6.Smits MM, van Geenen EJ. The clinical significance of pancreatic steatosis. Nat Rev Gastroenterol Hepatol. 2011;8(3):169–177. doi: 10.1038/nrgastro.2011.4 [DOI] [PubMed] [Google Scholar]
- 7.Yamazaki H, Tsuboya T, Katanuma A, et al. Lack of independent association between fatty pancreas and incidence of Type 2 diabetes: 5-year Japanese Cohort Study. Diabetes Care. 2016;39(10):1677–1683. doi: 10.2337/dc16-0074 [DOI] [PubMed] [Google Scholar]
- 8.Ozturk K, Dogan T, Celikkanat S, et al. The association of fatty pancreas with subclinical atherosclerosis in nonalcoholic fatty liver disease. Eur J Gastroenterol Hepatol. 2018;30(4):411–417. doi: 10.1097/MEG.0000000000001059 [DOI] [PubMed] [Google Scholar]
- 9.Lee JS, Kim SH, Jun DW, et al. Clinical implications of fatty pancreas: correlations between fatty pancreas and metabolic syndrome. World J Gastroenterol. 2009;15(15):1869–1875. [DOI] [PMC free article] [PubMed] [Google Scholar]
- 10.Pokhrel B, Choi EK, Khalid O, et al. Increased fat in pancreas not associated with risk of pancreatitis post-endoscopic retrograde cholangiopancreatography. Clin Exp Gastroenterol. 2014;7:199–204. doi: 10.2147/CEG.S31333 [DOI] [PMC free article] [PubMed] [Google Scholar]
- 11.Arulanandan A, Ang B, Bettencourt R, et al. Association between quantity of liver fat and cardiovascular risk in patients with nonalcoholic fatty liver disease independent of nonalcoholic steatohepatitis. Clin Gastroenterol Hepatol. 2015;13(8):1513–1520. doi: 10.1016/j.cgh.2015.01.027 [DOI] [PubMed] [Google Scholar]
- 12.Acharya C, Navina S, Singh VP. Role of pancreatic fat in the outcomes of pancreatitis. Pancreatology. 2014;14(5):403–408. doi: 10.1016/j.pan.2014.06.004 [DOI] [PMC free article] [PubMed] [Google Scholar]
- 13.Pezzilli R, Calculli L. Pancreatic steatosis: is it related to either obesity or diabetes mellitus? World J Diabetes. 2014;5(4):415–419. doi: 10.4239/wjd.v5.i4.415 [DOI] [PMC free article] [PubMed] [Google Scholar]
- 14.Kee CC, Sumarni MG, Lim KH, et al. Association of BMI with risk of CVD mortality and all-cause mortality. Public Health Nutr. 2017;20(7):1226–1234. doi: 10.1017/S136898001600344X [DOI] [PMC free article] [PubMed] [Google Scholar]
- 15.Kim SR, Lerman LO. Diagnostic imaging in the management of patients with metabolic syndrome. Transl Res. 2018;194:1–18. doi: 10.1016/j.trsl.2017.10.009 [DOI] [PMC free article] [PubMed] [Google Scholar]
- 16.Flegal KM, Kit BK, Orpana H, Graubard BI. Association of all-cause mortality with overweight and obesity using standard body mass index categories: a systematic review and meta-analysis. JAMA. 2013;309(1):71–82. doi: 10.1001/jama.2012.113905 [DOI] [PMC free article] [PubMed] [Google Scholar]
- 17.Hong CW, Fazeli Dehkordy S, Hooker JC, Hamilton G, Sirlin CB. Fat quantification in the abdomen. Top Magn Reson Imaging. 2017;26(6):221–227. doi: 10.1097/RMR.0000000000000141 [DOI] [PMC free article] [PubMed] [Google Scholar]
- 18.Alberti KG, Zimmet P, Shaw J. Metabolic syndrome – a new world-wide definition. A consensus statement from the international diabetes federation. Diabet Med. 2006;23(5):469–480. doi: 10.1111/j.1464-5491.2006.01858.x [DOI] [PubMed] [Google Scholar]
- 19.Alberti KG, Eckel RH, Grundy SM, et al; International Diabetes Federation Task Force on Epidemiology and Prevention; Hational Heart, Lung, and Blood Institute; Society; International Association for the Study of Obesity. Harmonizing the metabolic syndrome: a joint interim statement of the International Diabetes Federation Task Force on Epidemiology and Prevention; National Heart, Lung, and Blood Institute; American Heart Association; World Heart Federation; International Atherosclerosis Society; and International Association for the Study of Obesity. Circulation. 2009;120(16):1640–1645. doi: 10.1161/CIRCULATIONAHA.109.192644. [DOI] [PubMed] [Google Scholar]
- 20.Kaur J. A comprehensive review on metabolic syndrome. Cardiol Res Pract. 2014;2014:943162. doi: 10.1155/2014/943162 [DOI] [PMC free article] [PubMed] [Google Scholar] [Retracted]
- 21.Singh RG, Yoon HD, Poppitt SD, Plank LD, Petrov MS. Ectopic fat accumulation in the pancreas and its biomarkers: A systematic review and meta-analysis. Diabetes Metab Res Rev. 2017;33(8):e2918. doi: 10.1002/dmrr.2918 [DOI] [PubMed] [Google Scholar]
- 22.Wong VW, Wong GL, Yeung DK, et al. Fatty pancreas, insulin resistance, and β-cell function: a population study using fat-water magnetic resonance imaging. Am J Gastroenterol. 2014;109(4):589–597. doi: 10.1038/ajg.2014.1 [DOI] [PubMed] [Google Scholar]
- 23.Della Corte C, Mosca A, Majo F, et al. Nonalcoholic fatty pancreas disease and Nonalcoholic fatty liver disease: more than ectopic fat. Clin Endocrinol (Oxf). 2015;83(5):656–662. doi: 10.1111/cen.12862 [DOI] [PubMed] [Google Scholar]
- 24.Pickhardt PJ, Jee Y, O’Connor SD, Del Rio AM. Visceral adiposity and hepatic steatosis at abdominal CT: association with the metabolic syndrome. AJR Am J Roentgenol. 2012;198(5):1100–1107. doi: 10.2214/AJR.11.7361 [DOI] [PubMed] [Google Scholar]
- 25.Lim S, Meigs JB. Ectopic fat and cardiometabolic and vascular risk. Int J Cardiol. 2013;169(3):166–176. doi: 10.1016/j.ijcard.2013.08.077 [DOI] [PubMed] [Google Scholar]
- 26.Kühn JP, Berthold F, Mayerle J, et al. Pancreatic steatosis demonstrated at MR imaging in the general population: clinical relevance. Radiology. 2015;276(1):129–136. doi: 10.1148/radiol.15140446 [DOI] [PMC free article] [PubMed] [Google Scholar]
- 27.Singh RG, Yoon HD, Wu LM, Lu J, Plank LD, Petrov MS. Ectopic fat accumulation in the pancreas and its clinical relevance: A systematic review, meta-analysis, and meta-regression. Metabolism. 2017;69:1–13. doi: 10.1016/j.metabol.2016.12.012 [DOI] [PubMed] [Google Scholar]
- 28.Selwyn AP. Weight reduction and cardiovascular and metabolic disease prevention: clinical trial update. Am J Cardiol. 2007;100(12A):33P–37P. doi: 10.1016/j.amjcard.2007.10.012 [DOI] [PubMed] [Google Scholar]
- 29.Cohen JB, Cohen DL. Cardiovascular and renal effects of weight reduction in obesity and the metabolic syndrome. Curr Hypertens Rep. 2015;17(5):34. doi: 10.1007/s11906-015-0544-2 [DOI] [PMC free article] [PubMed] [Google Scholar]
- 30.Schweitzer L, Geisler C, Pourhassan M, et al. Estimation of skeletal muscle mass and visceral adipose tissue volume by a single magnetic resonance imaging slice in healthy elderly adults. J Nutr. 2016;146(10):2143–2148. doi: 10.3945/jn.116.236844 [DOI] [PubMed] [Google Scholar]
- 31.Miele L, Liguori A, Marrone G, et al. Fatty liver and drugs: the two sides of the same coin. Eur Rev Med Pharmacol Sci. 2017;21(1 Suppl):86–94. [PubMed] [Google Scholar]
- 32.Yu TY, Wang CY. Impact of non-alcoholic fatty pancreas disease on glucose metabolism. J Diabetes Investig. 2017;8(6):735–747. doi: 10.1111/jdi.12665 [DOI] [PMC free article] [PubMed] [Google Scholar]
- 33.Bellentani S, Tiribelli C. The spectrum of liver disease in the general population: lesson from the Dionysos study. J Hepatol. 2001;35(4):531–537. [DOI] [PubMed] [Google Scholar]
- 34.Gierach M, Gierach J, Ewertowska M, Arndt A, Junik R. Correlation between body mass index and waist circumference in patients with metabolic syndrome. ISRN Endocrinol. 2014;2014:514589. doi: 10.1155/2014/514589 [DOI] [PMC free article] [PubMed] [Google Scholar]
- 35.Oben JA, Patel T, Mouralidarane A, et al. Maternal obesity programmes offspring development of non-alcoholic fatty pancreas disease. Biochem Biophys Res Commun. 2010;394(1):24–28. doi: 10.1016/j.bbrc.2010.02.057 [DOI] [PMC free article] [PubMed] [Google Scholar]
- 36.Carter R, Mouralidarane A, Soeda J, et al. Non-alcoholic fatty pancreas disease pathogenesis: a role for developmental programming and altered circadian rhythms. PLoS One. 2014;9(3):e89505. doi: 10.1371/journal.pone.0089505 [DOI] [PMC free article] [PubMed] [Google Scholar]
- 37.Heber SD, Hetterich H, Lorbeer R, et al. Pancreatic fat content by magnetic resonance imaging in subjects with prediabetes, diabetes, and controls from a general population without cardiovascular disease. PLoS One. 2017;12(5):e0177154. doi: 10.1371/journal.pone.0177154 [DOI] [PMC free article] [PubMed] [Google Scholar]
- 38.Fukuda Y, Yamada D, Eguchi H, et al. CT density in the pancreas is a promising imaging predictor for pancreatic ductal adenocarcinoma. Ann Surg Oncol. 2017;24(9):2762–2769. doi: 10.1245/s10434-017-5914-3 [DOI] [PubMed] [Google Scholar]
- 39.Kim SY, Kim H, Cho JY, et al. Quantitative assessment of pancreatic fat by using unenhanced CT: pathologic correlation and clinical implications. Radiology. 2014;271(1):104–112. doi: 10.1148/radiol.13122883 [DOI] [PubMed] [Google Scholar]
- 40.Rebours V, Gaujoux S, d’Assignies G, et al. Obesity and fatty pancreatic infiltration are risk factors for Pancreatic Precancerous Lesions (PanIN). Clin Cancer Res. 2015;21(15):3522–3528. doi: 10.1158/1078-0432.CCR-14-2385 [DOI] [PubMed] [Google Scholar]
- 41.Zyromski NJ, Mathur A, Pitt HA, et al. Obesity potentiates the growth and dissemination of pancreatic cancer. Surgery. 2009;146(2):258–263. doi: 10.1016/j.surg.2009.02.024 [DOI] [PubMed] [Google Scholar]
- 42.Smereczyński A, Kołaczyk K. Is a fatty pancreas a banal lesion? J Ultrason. 2016;16(66):273–280. doi: 10.15557/JoU.2016.0027 [DOI] [PMC free article] [PubMed] [Google Scholar]
- 43.Patel NS, Peterson MR, Brenner DA, Heba E, Sirlin C, Loomba R. Association between novel MRI-estimated pancreatic fat and liver histology-determined steatosis and fibrosis in non-alcoholic fatty liver disease. Aliment Pharmacol Ther. 2013;37(6):630–639. doi: 10.1111/apt.12237 [DOI] [PMC free article] [PubMed] [Google Scholar]
- 44.Ogilvie R. The islands of Langerhans in 19 cases of obesity. J Pathol. 1933;37:473–481. doi: 10.1002/(ISSN)1555-2039 [DOI] [Google Scholar]
- 45.Stamm BH. Incidence and diagnostic significance of minor pathologic changes in the adult pancreas at autopsy: a systematic study of 112 autopsies in patients without known pancreatic disease. Hum Pathol. 1984;15(7):677–683. [DOI] [PubMed] [Google Scholar]
- 46.Heni M, Machann J, Staiger H, et al. Pancreatic fat is negatively associated with insulin secretion in individuals with impaired fasting glucose and/or impaired glucose tolerance: a nuclear magnetic resonance study. Diabetes Metab Res Rev. 2010;26(3):200–205. doi:10.1002/dmrr.1073 [DOI] [PubMed] [Google Scholar]
- 47.Aye M, Sazali M. Waist circumference and BMI cut-off points to predict risk fctors for metabolic syndrome among outpatients in a district hospital. Singapore Med J. 2012;53:545–550. [PubMed] [Google Scholar]
- 48.Janghorbani M, Amini M. Metabolic syndrome in type 2 diabetes mellitus in Isfahan, Iran: prevalence and risk factors. Metab Syndr Relat Disord. 2007;5(3):243–254. doi: 10.1089/met.2005.0010 [DOI] [PubMed] [Google Scholar]
- 49.Dekker JM, Girman C, Rhodes T, et al. Metabolic syndrome and 10-year cardiovascular disease risk in the Hoorn Study. Circulation. 2005;112(5):666–673. doi: 10.1161/CIRCULATIONAHA.104.516948 [DOI] [PubMed] [Google Scholar]
- 50.Sattar N, Gaw A, Scherbakova O, et al. Metabolic syndrome with and without C-reactive protein as a predictor of coronary heart disease and diabetes in the West of Scotland Coronary Prevention Study. Circulation. 2003;108(4):414–419. doi: 10.1161/01.CIR.0000080897.52664.94 [DOI] [PubMed] [Google Scholar]
- 51.Li Y, Yatsuya H, Iso H, Tamakoshi K, Toyoshima H. Incidence of metabolic syndrome according to combinations of lifestyle factors among middle-aged Japanese male workers. Preventive Med. 2010;51(2):118–122. doi: 10.1016/j.ypmed.2010.04.016 [DOI] [PubMed] [Google Scholar]
- 52.Wang H, Maitra A, Wang H. Obesity, intrapancreatic fat infiltration, and pancreatic cancer. Clin Cancer Res. 2015;21(15):3369–3371. doi: 10.1158/1078-0432.CCR-15-0718 [DOI] [PubMed] [Google Scholar]


