Abstract
Comprised of at least five distinct nuclei, the pulvinar complex of primates includes two large visually driven nuclei; one in the dorsal (lateral) pulvinar and one in the ventral (inferior) pulvinar, that contain similar retinotopic representations of the contralateral visual hemifield. Both nuclei also appear to have similar connections with areas of visual cortex. Here we determined the cortical connections of these two nuclei in galagos, members of the stepsirrhine primate radiation, to see if the nuclei differed in ways that could support differences in function. Injections of different retrograde tracers in each nucleus produced similar patterns of labeled neurons, predominately in layer 6 of V1, V2, V3, MT, regions of temporal cortex, and other visual areas. More complete labeling of neurons with a modified rabies virus identified these neurons as pyramidal cells with apical dendrites extending into superficial cortical layers. Importantly, the distributions of cortical neurons projecting to each of the two nuclei were highly overlapping, but formed separate populations. Sparse populations of double labeled neurons were found in both V1 and V2 but were very low in number (<0.1%). Finally, the labeled cortical neurons were predominately in layer 6 and layer 5 neurons were labeled only in extrastriate areas. Terminations of pulvinar projections to area 17 was largely in superficial cortical layers, especially layer 1.
Keywords: galagos, visual cortex, RRID AB_477329
Graphical Abstract
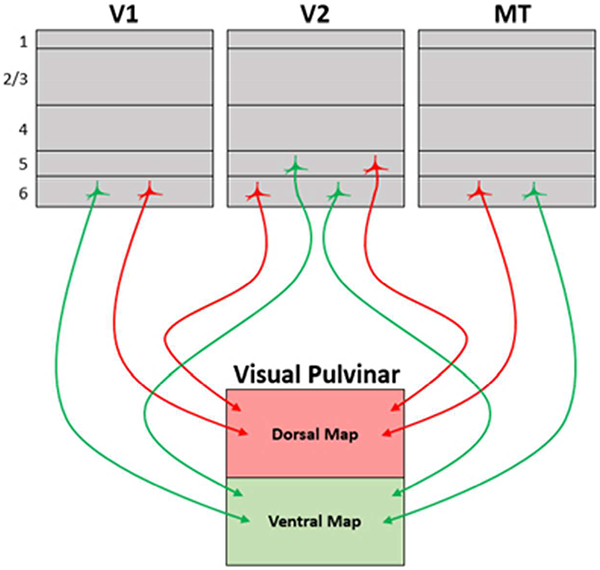
The galago visual pulvinar includes two nuclei with distinct, but mirrored retinotopic maps; one dorsal and one ventral. Retrograde tracers injected in each nucleus produced similar and distinct patterns of labeling across visual areas: notably layer 5 pyramidal neurons in V2 and layer 6 neurons in V1, V2, and MT.
Introduction
After many years of study on the visual pulvinar of monkeys, there is general agreement that the visual pulvinar is a complex of five, or possibly more, nuclei with different architecture, connections, and functionality (Adams et al., 2000; Baldwin et al., 2017; Cola et al., 2005; Jon H. Kaas & Lyon, 2007; O’Brien et al., 2001; Stepniewska & Kaas, 1997). While major features of this organization may apply to all anthropoid primates, including humans, how these features correspond with the visual pulvinar of stepsirrhine primates remain less certain. Importantly, early anatomical studies (Symonds & Kaas, 1978) and more recent electrophysiological mapping (Li et al., 2013) provide evidence for two large nuclei in stepsirrhine galagos that correspond to maps of the contralateral visual hemifield, and have connections with visual areas 17 and 18. In addition, the larger and more dorsal of these two nuclei appears to have a major role in gating the visual activity evoked in area 17 (Purushothaman et al., 2012). This more dorsal nucleus appears to be homologous to the lateral pulvinar nucleus, PL, of monkeys, while the more ventral nucleus likely corresponds to the central lateral nucleus, PIcl, of monkeys (Baldwin et al., 2017). In galagos, these two nuclei were called the central nucleus of the superior pulvinar, SPc, and the central nucleus of the inferior pulvinar, PIc, in early studies (Symonds & Kaas, 1978) and the PL and PIc more recently (Li et al., 2013). Here we refer to the two nuclei as the dorsal and ventral representations, corresponding to PL and PIc, respectively.
A prominent feature of the visually responsive pulvinar in primates is the existence of two distinct retinotopic maps. Originally described in macaques (Bender, 1981; Ungerleider et al., 1983), these maps have also been observed in other primate species including capuchins and galagos (Gattass et al., 1978; Li et al., 2013) as well as functional imaging of retinotopy in humans (Arcaro et al., 2015). The earliest microelectrode map made being of what we now recognize as the PIcl in owl monkeys (Allman et al., 1972). The retinotopic patterns of connections of parts of the visual pulvinar with cortical areas V1 and V2 across primate species are largely consistent with the existence of two maps (Baldwin et al., 2017). The two maps in the galagos are known to have reciprocal connections with early visual areas (Marion et al., 2013; D Raczkowski & Diamond, 1981; Denis Raczkowski & Diamond, 1980; Wong et al., 2009) that are involved in both ventral and dorsal streams of visual processing (Goodale & Milner, 1992; Mishkin & Ungerleider, 1982). The pulvinar maps have been reported to have major connections with cortical areas V1, V2, V3, V4, and MT (D Raczkowski & Diamond, 1981). The galago’s two maps in the visual pulvinar have been mapped and demonstrated to form almost mirrored representations from the dorsal to ventral nucleus (Li et al., 2013). Why does such an apparent redundancy exist- The answer may lie in the differences in circuitry that exists between these two visual pulvinar maps and the visual cortex. We used injections of tracer guided by concurrent electrophysiological recordings in the anesthetized galagos to show that cortical projections to the two maps are from distinct populations of cells spanning much of visual cortex. Additionally, we demonstrate that almost all of the labeled projecting neurons are layer 6 pyramidal neurons.
Materials and methods
Subjects
Four adult galagos (Otolemur garnettii) were used this study. These animals were cared for according to the National Institutes of Health Guide for the Care and Use of Laboratory Animals and according to a protocol approved by the Vanderbilt University Institutional Animal Care and Use Committee (IACUC). To reduce the number of these valuable primates used in experiments, some of the tissue from these animals was used in separate studies.
Surgery
Each of the following experiments shared a common surgical preparation (Li et al., 2013; Marion et al., 2013). Ketamine was used as an initial anesthetic sedative (10.3 mg/kg), in order to allow for surgical preparation and intubations. Anesthesia was then maintained via inhaled isoflurane (1–2% mixed in O2). While fully anesthetized, the galagos were placed in a stereotaxic frame. The surgery was performed under aseptic conditions, and vital signs including heart rate, respiration rate, blood pressure, and body temperature were regularly monitored throughout the procedure. A unilateral craniotomy was made over occipital-parietal cortex, and the dura of the region of the exposed brain area was removed to allow the microelectrode mapping and tracer injection in the pulvinar. The anesthesia was then switched to intravenous propofol (~2 mg/kg/hr) and respiration with nitrous oxide (67%). Intravenous paralytic (vecuronium bromide, 0.6 mg/kg/hr) was used to reduce eye movements and subtle modifications in the animal’s lens so that our visual power correction with contact lenses remained correct for the animal.
Pulvinar Injections
Parts of the dorsal and ventral retinotopic maps were carefully mapped with single tungsten electrodes (FHC, Inc., ME) at stereotaxic coordinates A-P: 3 mm, M-L: 5.5 mm, using visually evoked potentials in response to a simple stimulus consisting of a spot of light containing a crosshair pattern. The size of the spot was varied with eccentricity from the center of the visual field, becoming larger as it was moved farther from center, as the receptive fields of the visually-responsive pulvinar neurons get larger with eccentricity. These maps were compared to the data from previous experiments in order to corroborate locations(Li et al., 2013). In-house manufactured injectrodes, glass tubes pulled out to a fine (30Nm) tip and attached to an electrode, were used to record and confirm locations, and make subsequent injections. Injection locations were chosen as corresponding peripherally located (5–10° eccentricity from the center of the visual field) areas in the visual field within both maps to assure that: 1) the same area of the visual cortex was labeled from injections in each map and 2) there was no overlap between the injections. Injections were made via manual pressure, over the course of a few minutes. After each injection, the injectrode was left in the same position for 30 minutes to ensure that all the liquid had been evacuated before the injectrode was retracted.
The organization of corticopulvinar connections was revealed by injections of neuroanatomical tracers into the electrophysiology-identified representations in pulvinar. Two cholera toxin subunit B (CTB), two rabies, and one biotinylated dextran amine (BDA) tracers were used. The tracers were stored frozen at −80°C and kept frozen on dry ice until just before injection to prevent degradation. In 2 galagos, a total of 4NL of 1% CTB conjugated to Alexa- fluor 488 (green, Thermo Fisher) was injected at 2 different locations spaced 50Nm apart within the ventral map, and a total of 4μL of 1% CTB conjugated to Alexa-fluor 594 (red, Thermo Fisher) was injected at 2 different locations spaced 5004μm apart within the dorsal map in the same hemisphere. In addition, two different fluorescently-labeled modified rabies virus variants were injected into the other hemisphere in the same galagos. The tracers were designed to infect neurons at the injection site, but not infect other neurons by crossing synapses (Wickersham et al., 2007). A total of 4 μL of SADΔG – dsRed (red, 2 × 10⁹ infectious units / ml) and a total of 4 NL of SADΔG – GFP (green, 2 × 10⁹ infectious units / ml) were each injected at 2 different locations spaced 50μm apart within the dorsal and ventral maps, respectively, in one animal. CTB injections were made in one hemisphere of each animal’s brain and, one week later, rabies injections were made in the other hemisphere. In another 2 galagos, a total of 300–450nL of 3kDA BDA conjugated to Alexafluor 488 (green, Thermo Fisher Scientific, Waltham, MA) was injected into the dorsal retinotopic map to label the thalamocortical projections to visual cortex.
After each surgery, the galagos were treated with prophylactic antibiotic and analgesics after recovery from anesthesia. After a one-week survival time following the CTB/rabies injection series or 2–4 weeks following BDA injections, the galagos were euthanized via sodium pentobarbital overdose (>120 mg/kg), their blood was cleared with 0.1M PBS, and then they were perfused transcardially with 1.5 L of a fixative consisting of 3% paraformaldehyde and 0.1% glutaraldehyde with 0.2% picric acid.
Tissue preparation
For all experiments, the brain was stereotaxically blocked in the coronal plane, with cuts immediately anterior and posterior to the pulvinar. After blocking, the brain was removed from the skull. The brain was then cryoprotected in 30% sucrose in 0.1M phosphate buffer solution, frozen, and cut into 50μm slices using a freezing microtome. Sections were stored at −80°C in a 20% glycerol in Tris buffer solution. Every third section was mounted on glass slides and coverslipped with Vectashield (Vector Labs). The sections were not dehydrated. These sections were used to visualize labeled cell bodies, axons, and dendrites. Adjacent sections were stained for cytochrome oxidase (CO) (Boyd & Matsubara, 1996) or parvalbumin (PV) (Wong & Kaas, 2010) and then mounted glass slides, dried overnight, and then dehydrated and coverslipped with DPX (Fisher). These CO and PV sections were used was to reveal the architectural boundaries in the thalamus (Baldwin et al., 2012) and cortex (Wong & Kaas, 2010).
Antibody characterization
Anti-PV primary antibody: The mouse monoclonal antibody PV (mouse anti PV, Cat#P3088, Sigma-Aldrich, St. Louis, MO; Immunogen is frog parvalbumin) recognizes parvalubumin in a Ca2+ ion-dependent manner without reacting to other members of the EF-hand family. This primary antibody was used at the concentration of 1:2000.
Tissue imaging and analysis
Sections of pulvinar and visual cortex were observed using fluorescent microscopy (Zeiss M2 with an Axiocam MRC camera) to confirm that: 1) injections were made successfully into the general locations of the two maps and 2) there was labeling of neurons or axons in cortex. Locations of the labeled neurons within the cortical layers that were identified in adjacent brain sections processed for CO or PV. The boundary of areas 17/18 was determined by alignment with adjacent CO stained sections and the boundary of MT was determined using PV stained sections. The anterior boundary of area 18 was estimated based off of previously reported orientation maps gathered via optical imaging (Fan et al., 2012). Photoshop 6.0 (Adobe, San Jose, CA) was used to count the number of labeled cells of each tracer in selected brain areas that were identified by the adjacent CO or PV-processed sections. This was accomplished by using Photoshop’s “count” tool which keeps a running count of cells as they are plotted. These values were then transcribed into a spreadsheet for final analysis.
Results
The present study focused on two main issues, determining the cortical areas and regions that project to each of the two large, retinotopically organized nuclei of the pulvinar complex, and characterizing the laminar distribution of the projecting neurons. Injections of CTB retrograde tracers into physiologically identified sites in the two nuclei, revealed both the areal and laminar patterns of the projecting neurons. In addition, similar injections of modified rabies as a tracer confirmed the results from the CTB injection, while labeling fewer cortical neurons but more completely. Thus, labeled neurons were clearly revealed as pyramidal neurons with long apical dendrites. Finally, injections of BDA into the dorsal (lateral) nucleus revealed the projections of this nucleus into layer 1 of area 17. Given the limited availability of galagos for these studies, our results are based on relatively few cases.
CTB injections in the two nuclei reveal overlapping distributions of layer 6 neurons across cortical areas V1, V2, V3, DM, MT, and inferotemporal cortex (IT)
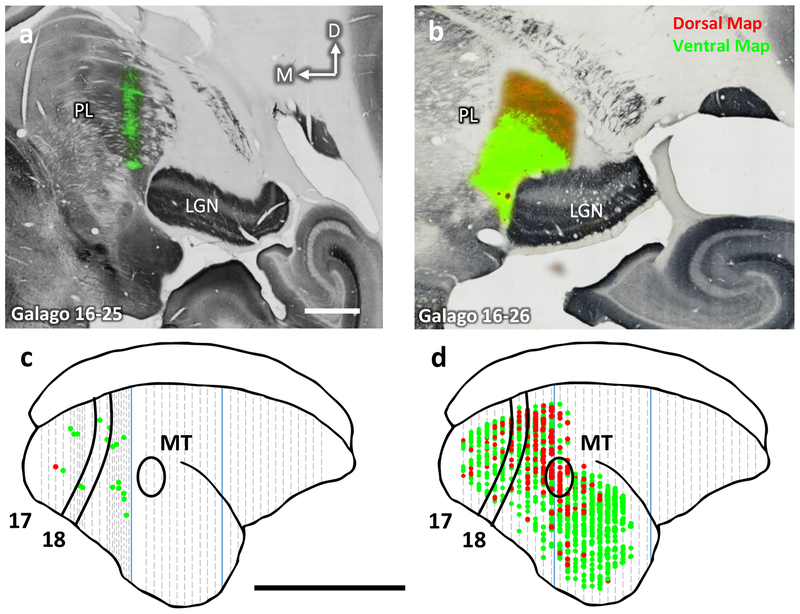
Cortical areas and layers with neurons projecting to each of the two pulvinar maps were identified by injecting distinguishable red or green tracers into the two maps into the same cerebral hemisphere. It was important to inject the tracers into retinotopically matched parts of the two nuclei, as only retinotopically congruent injections would likely double label neurons having projections to both nuclei (Cusick et al., 1985). Thus, recordings were made with tungsten microelectrodes to locate the visual fields in the two nuclei, and favorable recording sites in the two nuclei were targeted with an injection pipette attached to an electrode, CTB-red was injected into the dorsal map and CTB-green in the ventral map. Results from the two most successful cases are shown in Figure 1.
Figure 1:
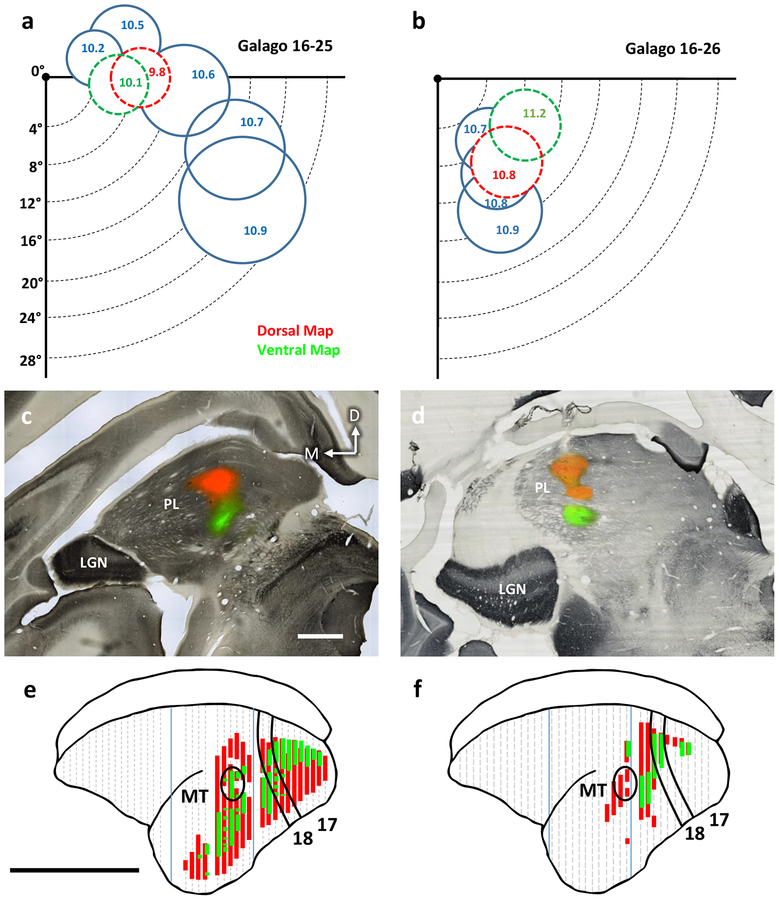
Distributions of labeled neurons in visual cortex after injections of CTB into the retinotopic maps in the lateral and inferior pulvinar in two galagos. a-b) Receptive fields for multiunit recordings in the dorsal and ventral maps in the pulvinar of galagos 16–25 and 16–26. The receptive fields are drawn on a depiction of the contralateral lower visual quadrant with 0° corresponding to area centralis of the retina. Receptive fields drawn in blue correspond to retinotopic mapping done using a tungsten electrode. Those fields drawn in red and green were obtained at the dorsal and ventral map injection sites, respectively. Indicated values are the cortical depths at which the circumscribed receptive fields were recorded. c-d) Coronal sections stained for CO overlaid on adjacent sections stained fluorescently for the injected CTB. Injection sites for the dorsal (red) and ventral (green) maps are shown. Scale bar is 1mm, e-f) The locations of populations of labeled neurons projecting to the dorsal map (red) and ventral map (green) in the coronal plane projected at a 45° angle onto the reconstructed dorsolateral surface of cortex. Borders of areas 17, 18, and MT indicated in black. Blue lines indicate tissue blocking cuts. Dashed grey lines indicate every ninth section of tissue. Scale bar is 1cm.
As shown in Figure 1, the injections were placed by the receptive fields of pulvinar neurons into paracentral vision of both maps, near the horizontal meridian in case 16–25 and 10° into the lower visual quadrant in case 16–26. The CTB uptake zone spread in both nuclei for both cases, but did not overlap. In both cases, large regions of visual cortex contained primarily distinct populations of labeled neurons (Fig. 1e,f) with very sparse double labeling (<0.1%). Many more neurons were labeled in case 16–25 and these neurons were distributed in area 17 within the contralateral portion representing the central 10° of visual space near the horizontal meridian (Rosa et al., 1997). The zone of labeled neurons also included parts of V2 and V3 devoted to central vision, much of the territory of visual area DL (V4), visual area MT and other areas of the MT complex, and much of inferior temporal cortex. Only the borders of V1 and MT were histologically evident, so that the appropriate locations of other areas were estimated from previous studies (Wong & Kaas, 2010). Results from case 16–26 were less extensive, but similar. Labeled neurons in V1, V2, and V3 were more medial than in case 16–25, as expected as this part of cortex represents central vision in the lower visual quadrant, matching the physiological location of the injection sites. Often labeled neurons were in DL, the MT complex, and upper parts of the inferior temporal (IT) cortex. Importantly, the distribution of red (dorsal map) and green (ventral map) labeled neurons largely overlapped. Thus, both the nuclei receive inputs from overlapping parts of several visual areas. Note also that many parts of cortex were not labeled. Notably, retinotopically mismatched parts of early visual areas, V1, V2, and V3 were not labeled, nor were regions of cortex with connections to the medial pulvinar (association areas of the temporal, parietal, and frontal lobes).
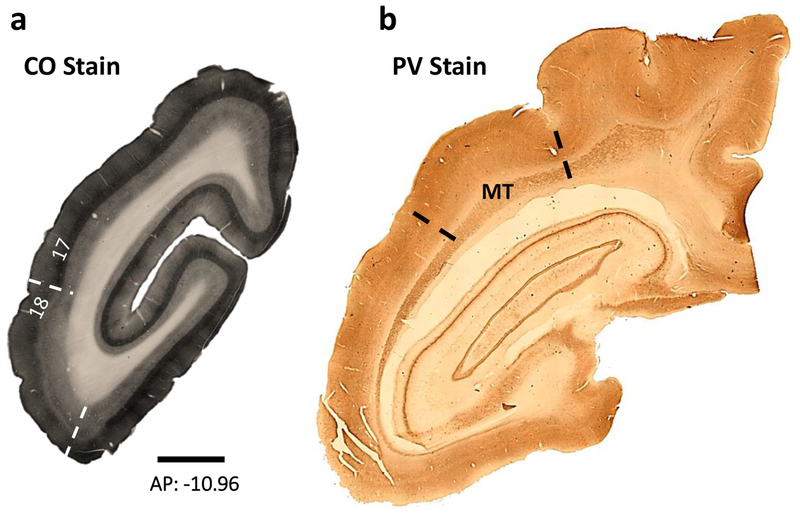
In both cases, the 17/18 border was clearly apparent in the brain sections processed for CO (Fig. 2). The prominent layer 4 of area 17 was apparent, as was a slightly less prominent layer 6. Thus, it was possible to assign labeled neurons to area 17 (V1) and to area 18 region (due to the estimated width of V2), and to area MT in sections processed for PV (Fig. 2b).
Figure 2:
The sections here depict the area 17/18 border in and the boundaries of area MT. a) A coronal section stained for CO not only reveals the border between areas 17 and 18 but also allows for the discrimination of different cortical layers. b) A coronal section stained for PV reveals the boundaries of area MT. Scale bar is 1000μm.
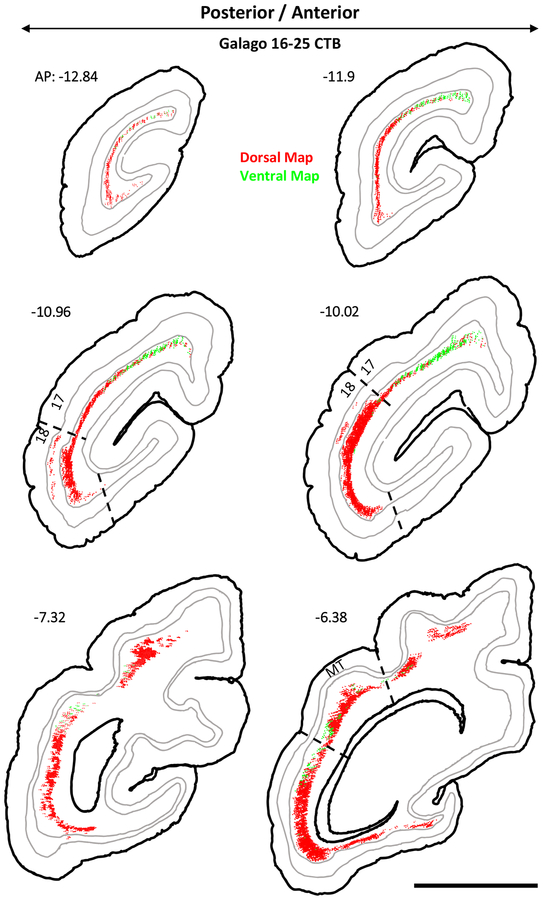
The injections also revealed the laminar locations of the labeled cortical neurons. Examples of these are illustrated for case 16–25 in Figure 3. The sections shown are those more densely labeled in caudal visual cortex from area 17 through to the middle of MT. Throughout areas V1, V2, V3, DL, MT, and IT, the labeled neurons were almost exclusively in layer 6, although a few were in layer 5 in area 18 (V2) (see AP −10.96 and −10.02). Of the over 14,000 area 18 neurons labeled in this case, only 296 were in layer 5. Results from case 16–26 were less extensive, but again labeled neurons were almost exclusively found within layer 6 (Fig 4). As projections from layer 6 are thought to have a modulating influence on thalamic neurons, while layer 5 projections are thought to have a driving influence (M. E. Bickford et al., 2015), these results suggest that cortical inputs to the pulvinar maps are predominately modulating. For case 16–25, 53 double labeled neurons were observed across V1 and V2. Case 16–26 contained only 18 double labeled neurons in the same regions. These counts were excluded from analysis since these cells made up such a minor proportion (<0.1%).
Figure 3:
Coronal sections of subject 16–25’s CTB labeled cortex arranged posterior to anterior in a left-to-right descending direction. The location of labeled cells projecting to the dorsal map are shown in red while those projecting to the ventral map are shown in green. The internal borders drawn in grey are the layer 4/5 and 5/6 borders. Areas 17, 18, and MT are delineated on appropriate sections. AP level indicated for each section.
Figure 4:
These images show neurons labeled by CTB within area 17 of subject 16–26. Labeled neurons in layer 6 of area 18 as seen through a red (a), green (b), and combined (c) filters. Double labeled neurons are indicated by white arrowheads. Scale bar is 60μm.
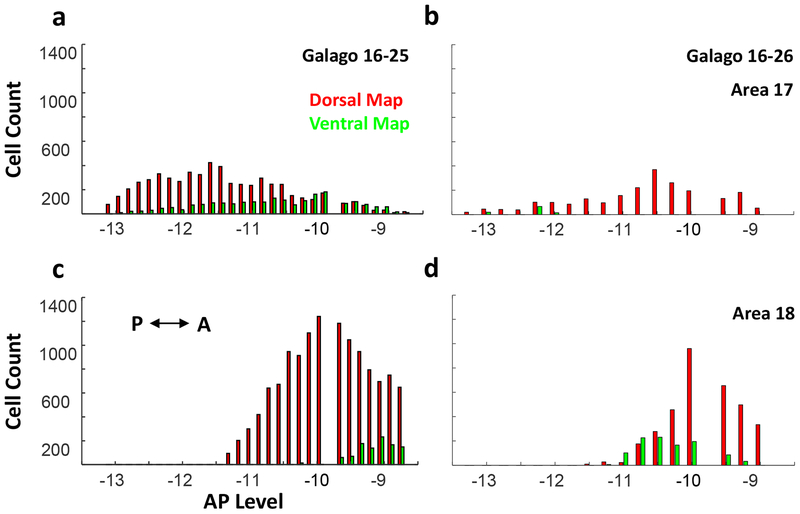
Quantitative measures of labeled neuron counts in V1 and V2 are shown for the two cases in Figure 5. Labeled neurons were counted in a series of posterior to anterior coronal brain sections for each cortical region or area. For case 16–25, 5795 neurons were labeled in V1 by the dorsal map injection (red) and 2117 were labeled by the ventral map injection (green). The number of labeled neurons varied across sections, with the ventral map green neurons numbers shifted somewhat toward anterior sections compared to the dorsal map red neurons, although the populations overlapped extensively. This slight shift toward the V1–V2 border for the population of neurons labeled by the injection in the ventral map likely reflects the slightly more central location of the ventral injection site within the retinotopic maps (Fig. 1c, d).
Figure 5:
Histograms of cell counts from two subjects for layer 6 neurons projecting to the dorsal (red) and ventral (green) maps from a-b) area 17 and c-d) area 18, arranged from posterior to anterior.
In the V2–V3 region, neuron counts for case 16–25 were high with 13461 red dorsal map projecting neurons and 1140 green ventral map projecting neurons, again with a high level of overlap. The peak of the distribution of green labeled neurons was more anterior. Based on previously reported cortical mapping, this peak possibly occurs more within V3. Results from the injection in case 16–26 were similar, but fewer neurons were labeled. The overlap in V1 was limited, as the ventral injection labeled few V1 neurons. More overlap of labeled neurons occurred in the V2–V3 distributions, possibly as a result of the larger receptive fields for V2 and V3 neurons, and the repeating modular organizations of these areas (Fan et al., 2012). Results from case 16–26 also show higher cell counts in the V2–V3 region, but fewer labeled neurons from the ventral pulvinar map injection.
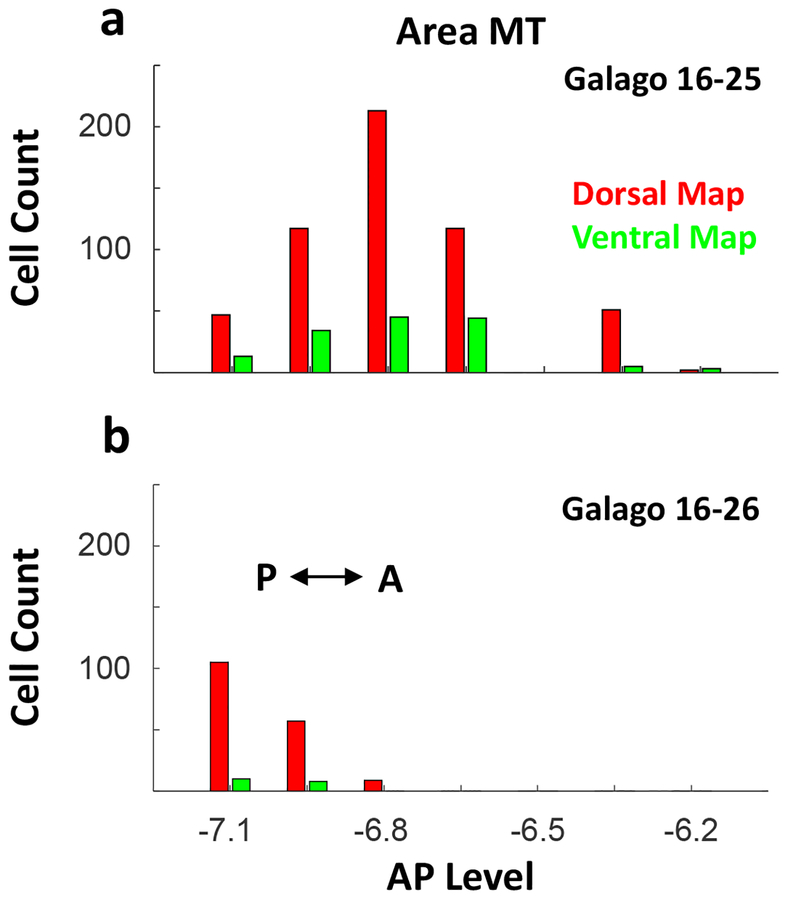
Counts of labeled neurons in area MT were also obtained for the injections in the dorsal and ventral pulvinar maps (Fig. 6). For case 16–25, a total of 691 neurons were labeled in the MT region within layer 6. The counts were lower for the injection into ventral map than for the dorsal map, but the distributions overlapped extensively with very few double labeled neurons. A smaller number of neurons were labeled in the MT region in case 16–26, but again the population overlapped.
Figure 6:
Cell count histograms of layer 6 MT neurons projecting to the dorsal (red) and ventral (green) maps of two subjects, galagoes a) 16–25 and b) 16–26 with 0 on the horizontal axis representing the location of our blocking cut.
Cortical neurons labeled by fluorescent proteins conjugated to modified rabies virus
We injected a modified rabies virus into the pulvinar maps of two galagos. The virus was modified to infect neurons at the injection sites, but not infect other neurons by crossing synapses (Wickersham et al., 2007). As for the CTB injections, the modified rabies virus also presented a red or green fluorescent marker. The advantage of the virus injections was that cortical neurons projecting to the injection sites would be infected, and the replicating virus within the cortical neurons would intensify the signal, revealing more of the cell morphology of the cortical neurons. We made red and green viral injections in the pulvinar in case 16–25 with limited success. Only the injection in the ventral map (GFP tagged virus) labeled cortical neurons and these were scattered in throughout V1–V3 and more rostral visual areas. In case 16–26, the virus injections were more readily taken up from both injection sites, and a large number of cortical neurons were labeled.
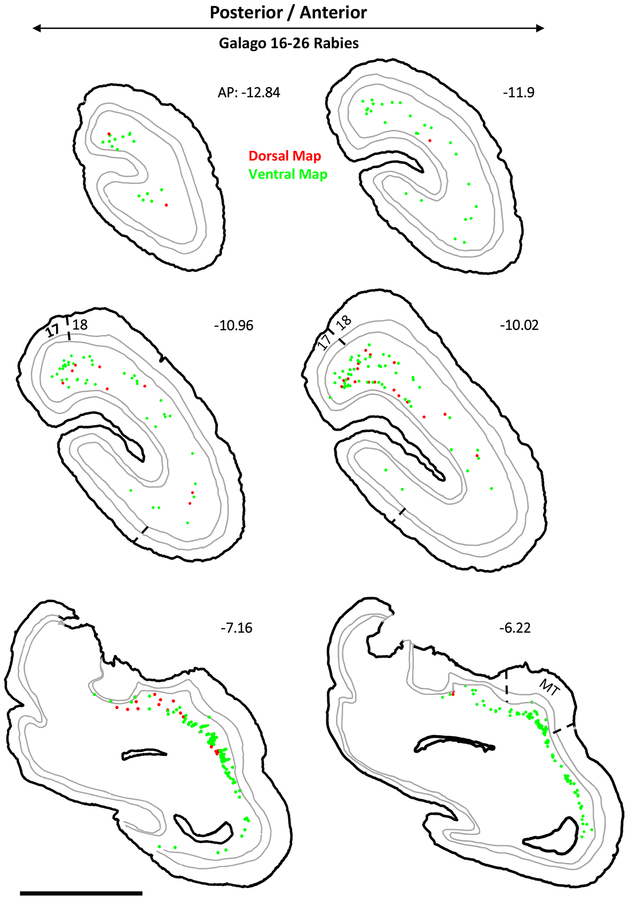
The results from the two virus cases fully support the conclusions based on the CTB injections. In case 16–26 where the injections were more effective, large numbers of cortical neurons were labeled across visual areas V1, V2, V3, DM, DL, MT, and IT (Fig. 7). Rostral parts of temporal cortex, possibly including higher order auditory or multisensory cortex were also labeled suggesting that especially the ventral injection may have spread to other pulvinar nuclei. Part of posterior parietal cortex was damaged so labeled neurons may have been overlooked in this region. Overall, 15292 neurons in these cortical areas were labeled and all but relatively few were in layer 6 (Fig. 8). Examples of labeled neurons are shown for areas 17, 18, and MT in Figure 9. The virus more fully labeled neurons so that apical dendrites extending toward layer 1 were fluorescent and revealed in detail. All labeled neurons, red or the more numerous green, appeared to be pyramidal neurons with long apical dendrites that extended into superficial cortical layers toward or into layer 1. Finally, we found very few neurons that were double labeled from the two pulvinar injections. Thus, projections from cortical areas to the dorsal and ventral maps were from predominately distinct, but overlapping distributions of neurons.
Figure 7:
Distributions of labeled neurons in visual cortex after injections of rabies tracers into the retinotopic maps in the lateral and inferior pulvinar in two galagos. a-b) Coronal sections stained for CO overlaid on adjacent sections stained fluorescently for the injected rabies. Injection sites for the dorsal (red) and ventral (green) maps are shown. Scale bar is 1cm, c-d). Labeled neurons descending to the dorsal map (red) and ventral map (green) projected at a 45° angle onto the surface of cortex, as in Figure 1. Borders of areas 17, 18, and MT indicated in black. Scale bar is 1cm.
Figure 8:
Neurons labeled in visual cortex after rabies virus injections into the dorsal and ventral pulvinar maps in galago 16–26. The locations of labeled cells projecting to the dorsal map are shown in red while those projecting to the ventral map are shown in green. The coronal sections are arranged in a posterior to anterior sequence. The internal borders drawn in grey are the layer 4/5 and 5/6 borders. Areas 17, 18, and MT are delineated on appropriate sections. AP level indicated for each section.
Figure 9:
Representative sections from areas 17 (a), 18 (b), and MT (c) demonstrating rabies labeled cells projecting to the dorsal (red) and ventral (green) maps of visual pulvinar. The border between layers 5 and 6 is indicated with a white dotted line when visible in the image. Scale bar is.
BDA injections in the dorsal map
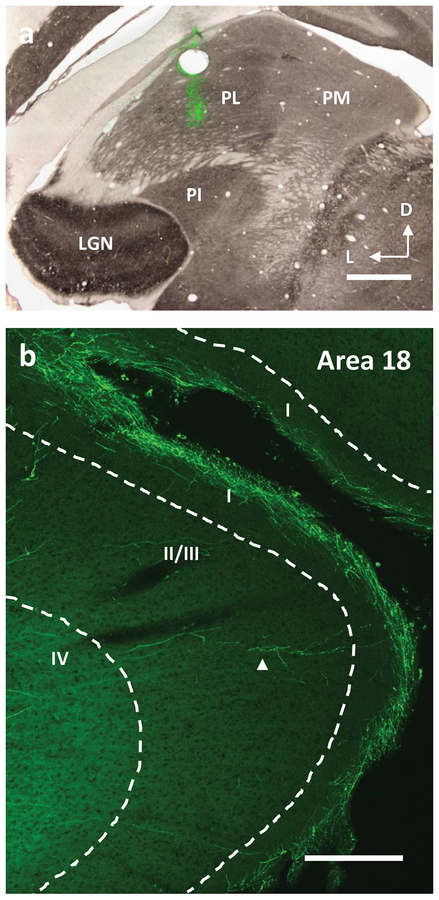
The thalamocortical projections from the pulvinar to the visual cortex were examined using injections of BDA as an anterograde tracer placed in the dorsal map of two galagos (Fig. 10). The tracer injection locations were guided by microelectrode recordings and confirmed to be in the region of the dorsal pulvinar maps histologically. Injections spread along the injection tract (dorso-ventral axis) with the largest observed spread spanning about 1mm along this dimension (Fig. 10a).
Figure 10:
Distributions of labeled processes in visual cortex after injections of BDA into the dorsal map in the lateral pulvinar of the galago. a) A coronal section stained for CO overlaid on an adjacent section stained fluorescently for the injected BDA. The injections were localized to the dorsal map within PL. Scale bar is 1mm, b) Pulvinar projections to area 17 (green). Axons can be seen to form arbors in a dense band in the most superficial part of layer 1. Sometimes arbors are observed in upper layer 2/3 (indicated by an arrow). Scale bar is 200μm.
Much like the retrogradely labeled cortical neurons described above, labeled axons were observed within several visual areas in cortex. Those projections that terminate in area 17 tended to ascend through the layers of cortex in a largely non-branching matter in which they only arborize once they reach layer 1. In layer 1, the processes branch and send collaterals in opposite directions at the border between the upper and lower halves of layer 1 and in the outermost sublayer (layer 1a). A small number of axons were observed to ascend to the top of layer 1 and have only local arborizations. Additionally, a few axons produced boutons as they passed through the inner half of layer 1. However, no extensive arborization was observed. Rarely, axons were observed to form arbors in layers 2/3 that continued to climb into layer 1 where they arborized more broadly. The arbors that were contained in layers 2/3 tended to remain confined locally to an area smaller than a single vertical column.
Projections to area 18 were also examined. These projections primarily terminated in layer 4 with a small minority terminating in lower layer 2 and upper layer 1. Axons extending into layer 1 branched in a similar pattern as seen in area 17. The spread of these layer 1 processes, however, matched the spread of the axons in layers 3/4 below them. This terminal labeling of area 18 has been previously reported in detail by Marion et al. (2013). Projections to other areas were sparse and were not examined in detail.
Discussion
In the present study, we injected tracers into two nuclei of the pulvinar complex in galagos, a stepsirrhine primate, in order to come to a better understanding of the connections and functions of these two nuclei. Galagos, as for other studied primates, have two large nuclei in the visual pulvinar that contain similar retinotopic maps with similar connections with primary visual cortex and other visual areas (Baldwin et al., 2017). In monkeys, the more ventral map corresponds to the central-lateral nucleus of the inferior pulvinar, PIcl, while the more dorsolateral map occupies most or all of the lateral pulvinar, PL. Other parts of the inferior pulvinar include the posterior nucleus, PIp, the medial nucleus, PIm, and the central-medial nucleus, PIcm. PIp, CI, and PIcm all project to the upper part of the temporal lobe where the middle temporal visual area, MT, and functionally associated visual areas (see Kaas and Morel, 1993) are located. PIp and PIcm get their VGluT2 positive inputs from neurons in the deep superficial grey of the superior colliculus, while PIcl and PL receive only sparse inputs from the superior colliculus (Kwan et al., 2018). Thus, the two large retinotopic maps in PIcl and PL appear to be most clearly related to early visual areas, while the more medial nuclei of the inferior pulvinar, PIp, PIm, and PIcm, appear to be more related to cortex in the upper temporal lobe (Kaas & Lyon, 2007).
The organization of the visual pulvinar in galagos is similar to that of monkeys in that two large retinotopic maps have been defined. One of these maps is in the inferior pulvinar and one is in the superior pulvinar (Li et al., 2013; Symonds & Kaas, 1978) suggesting that part of the pulvinar complex is rotated so that PL is superior and PIcl is inferior but more lateral. Other parts of the inferior pulvinar are medial, but rotated dorsally and caudally so that part of the thalamus occupied by the medial pulvinar in monkeys is occupied by the inferior pulvinar in galagos (Baldwin et al., 2013). As the different nuclei of the visual pulvinar in galagos are more difficult to distinguish architechtonically in galagos than in monkeys, it was important in the present study to locate injection sites in the large dorsal and ventral retinotopic maps with microelectrode recordings. While some slight spread of injected tracers could have included other parts of the pulvinar, such spread appeared to be minimal. And no significant spread occurred into the dorsal lateral geniculate nucleus, LGN, as judged by the spread of tracer around injection sites in histological brain sections and the lack of anterograde transport of tracer to layer 4 of area 17.
The areal and laminar distribution of cortical neurons projecting to the two pulvinar maps
Injections of either CTB or the modified rabies virus into the dorsal or the ventral retinotopic maps in the visual pulvinar labeled populations of neurons extending over much of visual cortex of galagos, including areas 17 (V1), 18 (V2), and MT as well as the regions of V3, DL (V4), MST, and the caudal temporal lobe (IT). As V1 and V2 are the largest of visual areas, V1 and V2 provided most of the cortical inputs to the dorsal and ventral maps. As expected from the locations of the injection sites in parts of the two maps, the labeled neurons were in dorsolateral parts of V1 and V2 representing central and paracentral vision (Rosa et al., 1997). The distribution of labeled neurons in the cortical map in MT (Allman et al., 1973) was proportionately larger, as expected from the larger receptive fields of neurons in MT and in adjoining cortex.
After all injections into both pulvinar maps, labeled neurons were exclusively in layer 6 of area 17, and largely, but not exclusively, in layer 6 in other visual areas. In the cortical territories of V2 and V3, some neurons were labeled in layer 5. In the CTB cases with retinotopically matched injections in the two maps, neurons in overlapping populations were either labeled by the ventral or the dorsal map injection, and double labeled neurons were occasionally seen in these cortical areas. Thus, it seems likely that the vast majority of cortical inputs to the two maps are from separate populations of neurons that spread across several cortical areas. While the information transmitted from each cortical area to the two pulvinar maps may be similar, it could be as least slightly different due to the separate populations of projecting neurons across cortical areas and functional divisions within cortical areas of columns and minicolumns (Kaas, 2012).
Our finding that a number of cortical visual areas, but especially V1 and V2, project to the dorsal (PL) and ventral (PIcl) maps is largely consistent with previous findings. In galagos, precise comparisons can be difficult as previous results were based on injection sites that were not identified by microelectrode recordings, and the injection sites could be larger, and involve more nuclei. For example, in the study of Raczkowski and Diamond (1981), injections of horseradish peroxidase (HRP) were placed in either the superior or inferior pulvinar and neurons in variable locations in visual cortex were labeled, including areas 17, 18, 19, MT, and much of temporal cortex, as in the present study. Overall, the results from injections in the inferior and superior pulvinar were roughly similar. While the injections almost certainly involved the dorsal and ventral maps, other parts of the pulvinar were likely involved as injections also labeled neurons in the lower superficial layer of the superior colliculus, where the neurons are known to project to the inferior pulvinar homologs of PIp and PIcm (Baldwin et al., 2013, 2017).
Unlike the present results, neurons labeled in V1 (area 17) of the Raczkowski and Diamond study (1981) were only in layer 5. While the great majority of labeled neurons in other areas were in layer 6, a few in areas 18 and 19 were in layer 5, as in the present study. Thus, the major difference in findings was in the labeling of only layer 5 neurons in area 17 in the Raczkowski and Diamond study (1981) and only layer 6 neurons in the present study. However, the projections of layer 5 neurons in area 17 to the pulvinar was expected from the results of anatomical and physiological experiments in monkeys. In macaque monkeys, projections to the pulvinar have repeatedly been described as coming from layer 5, while projections from other visual areas have been described as coming almost completely from layer 6 (Levitt et al., 1995; Lund et al., 1975; Trojanowski & Jacobson, 1977). This laminar distinction is important as layer 5 is considered the source “driving” inputs to the thalamus, while layer 6 provides modulating inputs (Bickford, 2016; Rovo et al., 2012; Sherman & Guillery, 1998). Thus, layer 5 inputs to the dorsal and ventral maps would activate neurons, provide these neurons with their basic response characteristics, and mediate retinotopy. As expected from this proposed role of the layer 5 projections to the pulvinar, lesions of area 17 in macaque monkeys renders neurons in the retinotopic pulvinar maps to be largely unresponsive to visual stimuli (Bender, 1981, 1983).
The laminar differences in the labeling of only layer 5 or only layer 6 neurons in area 17 of galagos in the study of Raczkowski and Diamond (1981) and the present study in galagos, and that of others in monkeys, are difficult to explain. However, somewhat different results were reported when Conley and Raczkowky (1990) reexamined the pattern of cortical projections to the pulvinar in galagos. After injections of the retrograde tracer, wheat germ agglutinin conjugated to horseradish peroxidase (WGA-HRP) into the pulvinar of three galagos, large regions of area 17 had large populations of labeled neurons in layer 6 (as many as 75%). Smaller numbers of larger neurons were labeled in the upper half of layer 5. By injecting another tracer into the LGN in the same cases, it was apparent that pulvinar and LGN injections labeled separate populations of layer 6 neurons in area 17. In macaque monkeys, Rockland (1996) made injections in area 17 to label terminations in the pulvinar, and described two types: type one had anatomical features of modulator functions, while type 2 had the expected features of driving functions. While Rockland (1996) assumed that all projections to the pulvinar from area 17 were from layer 5 neurons, based on Lund et al. (1981), it now seems more likely that the type 1 modulator projections from area 17 to the pulvinar were from layer 6 neurons, and only type 2 driving projections were from layer 5 neurons. Both type 1 and type 2 terminations have been reported in the lateral posterior “nucleus,” the homolog of the pulvinar, in rats after area 17 injections (Bourassa & Deschenes 1995; Marion et al., 2013), and they likely exist in all mammals.
It remains uncertain why the injections in the dorsal and ventral pulvinar maps in the present cases did not label layer 5 neurons in area 17, and labeled relatively few in extrastriate cortex. Conley and Raczkowski (1990) argued that pulvinar injections in their cases labeled both layer 6 and layer 5 neurons in area 17 because WGA-HRP is a “much more sensitive method.” Layer 5 neurons in area 17 of galagos were clearly labeled after pulvinar injections in earlier studies (Conley & Raczkowski, 1990; D Raczkowski & Diamond, 1981), and Conley and Raczkowski (1990) also found that area 17 sends projections from layer 5 neurons to the pulvinar. The differences in results across experiments could reflect the use of different tracers, the placements of injections within the maps, the lack of involvement of injected tracers in other parts of the pulvinar, and the post injection transport times. The large representations in PL and in PIcm are likely to be involved in many of the injection sites, but other parts of the pulvinar could be variably involved. In addition, the three dimensional retinotopic maps have a dimension of isorepresentation and the cortical inputs along the columns of isorepresentation could differ, as suggested by Shipp (2001). For now, it is uncertain why layer 6 neurons or layer 5 neurons are sometimes labeled with pulvinar injections, and sometimes not. However, it is worth noting that both layer 6 and layer 5 neurons in auditory cortex of mice were labeled by superior colliculus injections in a recent study (Zurita et al., 2017), while previous studies found labeled neurons mainly in layer 5. Thus, projections of layer 5 and layer 6 neurons labeled by subcortical injections vary across studies of auditory cortex. Finally, the inactivation of the retinotopic maps in PL or PIcl by lesions of area 17 could be the result of the loss of area 17 layer 5 inputs to the pulvinar, in combination with the inactivation of V2 and other areas of extrastriate cortex by the lesions (Schiller & Malpeli, 1977), as these areas send some layer 5 projections to the pulvinar maps.
Projections from the dorsal map to cortex
The dorsal retinotopic map (PL) of galagos projects to area 17 (V1), area 18 (V2), and more sparsely to other visual areas. These projections were revealed by BDA injections into the dorsal map in two galagos. The terminations in area 17 were mainly in layer 1, which suggests that they have a modulating role by synapsing on the ends of apical dendrites of pyramidal cells in layers 3, 5, and 6. In our galago cases, the labeling of layer 6 neurons in area 17 by the rabies virus injected in the dorsal map was dense enough to reveal long apical dendrites that extended well into layer 3 and possibly into layer 1. Thus, projections of dorsal map neurons to the superficial layers of area 17 could synapse directly on the apical dendrites of layer 6 neurons that project to the dorsal map, thereby altering the feedback that layer 6 neurons provide to the dorsal map. Other terminations in layers 2 and superficial third of layer 3 could also synapse on the dendrites of layer 6 neurons. The projections of the dorsal map (PL) neurons to area 18 (V2) terminate near the layer 4 junction with layer 3. These inputs could be a source of driving input to V2. Projections to more rostral visual areas could be detected but were sparse. These results are similar to those reported previously in galagos (Marion et al., 2013) where dense projections were described from the dorsal map to layer 1 of area 17, and inputs to area 18 (V2) were mainly to layer 4 and inner layer 3. Marion et al (2013) concluded from these results that PL could be a driver of neural activity in V2, while inputs to V1 would gate information outflow from V1 to V2 (Purushothaman et al., 2012). In squirrel monkeys, large injections involving the lateral and inferior pulvinar labeled axon terminations in much of the temporal lobe and into the temporal lobe that were more dense in lower layer 3 in area 18 but also in layers 5 and 6 (Curcio & Harting, 1978). Similar findings have been reported in macaque monkeys where injections including PI and PL labeled terminals in layers 1 and 2 of area 17 and layers 4 and lower 3 in area 18 (Benevento & Rezak, 1976; Ogren & Hendrickson, 1977). In monkey studies, the area 18 (V2) terminations from pulvinar injections were patchy (Curcio & Harting, 1978; Levitt et al., 1995; Livingstone & Hubel, 1982), reflecting the modular organization of V2 (Kaskan et al., 2009; Lim et al., 2009). Finally, at the single axon level, injections into PL in macaques labeled terminations in V2 and other visual areas (V3, V4, DL and MT) that were concentrated in layer 3, but also involved layers 4, 5, 6, and sometimes layer 1 (Rockland et al., 1999). Overall, the dorsal map (PL) projections to early visual areas appear to be similar between galagos and those observed in monkeys.
Table 1:
CTB labeled cell counts by cortical layer and brain area. Numbers in red indicate cells labeled by the dorsal map injection while those in green correspond to the ventral map injection.

|
Acknowledgements
We thank Mary Baldwin for helpful comments on our paper and Xu Xiangmin for providing the viral tracers. This paper is dedicated to the memory of Vivien Casagrande who was involved in this study up until the end.
This research was supported by grants from the National Eye Institute (NIH), EY02686 to JHK and EY025422 to VAC.
Footnotes
Conflict of interest
The authors declare no conflict of interest.
References
- Adams MM, Hof PR, Gattass R, Webster MJ, & Ungerleider LG (2000). Visual cortical projections and chemoarchitecture of macaque monkey pulvinar. Journal of Comparative Neurology, 419(3), 377–393. [DOI] [PubMed] [Google Scholar]
- Allman JM, Kaas JH, Lane RH, & Miezin FM (1972). A representation of the visual field in the inferior nucleus of the pulvinar in the owl monkey (Aotus trivirgatus). Brain Research, 40(2), 291–302. Retrieved from http://www.ncbi.nlm.nih.gov/pubmed/4623782 [DOI] [PubMed] [Google Scholar]
- Arcaro MJ, Pinsk MA, & Kastner S (2015). The Anatomical and Functional Organization of the Human Visual Pulvinar. Journal of Neuroscience, 35(27), 9848–9871. 10.1523/JNEUROSCI.1575-14.2015 [DOI] [PMC free article] [PubMed] [Google Scholar]
- Baldwin MKL, Balaram P, & Kaas JH (2013). Projections of the superior colliculus to the pulvinar in prosimian galagos (Otolemur garnettii) and VGLUT2 staining of the visual pulvinar. Journal of Comparative Neurology, 521(7), 1664–1682. 10.1002/cne.23252 [DOI] [PMC free article] [PubMed] [Google Scholar]
- Baldwin MKL, Balaram P, & Kaas JH (2017). The evolution and functions of nuclei of the visual pulvinar in primates. Journal of Comparative Neurology, 525(15), 3207–3226. 10.1002/cne.24272 [DOI] [PubMed] [Google Scholar]
- Baldwin MKL, Kaskan PM, Zhang B, Chino YM, & Kaas JH (2012). Cortical and subcortical connections of V1 and V2 in early postnatal macaque monkeys. The Journal of Comparative Neurology, 520(3), 544–569. 10.1002/cne.22732 [DOI] [PMC free article] [PubMed] [Google Scholar]
- Bender DB (1981). Retinotopic organization of macaque pulvinar. Journal of Neurophysiology, 46(3), 672–693. [DOI] [PubMed] [Google Scholar]
- Bender DB (1983). Visual activation of neurons in the primate pulvinar depends on cortex but not colliculus. Brain Research, 279(1–2), 258–261. 10.1016/0006-8993(83)90188-9 [DOI] [PubMed] [Google Scholar]
- Benevento LA, & Rezak M (1976). The cortical projections of the inferior pulvinar and adjacent lateral pulvinar in the rhesus monkey (macaca mulatta): An autoradiographic study. Brain Research, 108(1), 1–24. 10.1016/0006-8993(76)90160-8 [DOI] [PubMed] [Google Scholar]
- Bickford ME (2016). Thalamic Circuit Diversity: Modulation of the Driver/Modulator Framework. Frontiers in Neural Circuits, 9(January), 1–8. 10.3389/fncir.2015.00086 [DOI] [PMC free article] [PubMed] [Google Scholar]
- Bickford ME, Zhou N, Krahe TE, Govindaiah G, & Guido W (2015). Retinal and Tectal “Driver-Like” Inputs Converge in the Shell of the Mouse Dorsal Lateral Geniculate Nucleus. Journal of Neuroscience, 35(29), 10523–10534. 10.1523/JNEUROSCI.3375-14.2015 [DOI] [PMC free article] [PubMed] [Google Scholar]
- Bourassa J, & Deschênes M (1995). Corticothalamic projections from the primary visual cortex in rats: a single fiber study using biocytin as an anterograde tracer. Neuroscience, 66(2), 253–263. 10.1016/0306-4522(95)00009-8 [DOI] [PubMed] [Google Scholar]
- Boyd JD, & Matsubara JA (1996). Laminar and columnar patterns of geniculocortical projections in the cat: Relationship to cytochrome oxidase. Journal of Comparative Neurology, 365(4), 659–682. [DOI] [PubMed] [Google Scholar]
- Cola MG, Seltzer B, Preuss TM, & Cusick CG (2005). Neurochemical organization of chimpanzee inferior pulvinar complex. Journal of Comparative Neurology, 484(3), 299–312. 10.1002/cne.20448 [DOI] [PubMed] [Google Scholar]
- Conley M, & Raczkowski D (1990). Sublaminar organization within layer VI of the striate cortex in Galago. Journal of Comparative Neurology, 302(2), 425–436. 10.1002/cne.903020218 [DOI] [PubMed] [Google Scholar]
- Curcio CA, & Harting JK (1978). Organization of pulvinar afferents to area 18 in the squirrel monkey: evidence for stripes. Brain Research, 143(1), 155–161. 10.1016/0006-8993(78)90759-X [DOI] [PubMed] [Google Scholar]
- Cusick CG, Steindler DA, & Kaas JH (1985). Corticocortical and collateral thalamocortical connections of postcentral somatosensory cortical areas in squirrel monkeys: A double-labeling study with radiolabeled wheatgerm agglutinin and wheatgerm agglutinin conjugated to horseradish peroxidase. Somatosensory & Motor Research, 3(1), 1–31. 10.3109/07367228509144574 [DOI] [PubMed] [Google Scholar]
- Fan RH, Baldwin MKL, Jermakowicz WJ, Casagrande VA, Kaas JH, & Roe AW (2012). Intrinsic signal optical imaging evidence for dorsal V3 in the prosimian galago (Otolemur garnettii). Journal of Comparative Neurology, 520(18), 4254–4274. 10.1002/cne.23154 [DOI] [PMC free article] [PubMed] [Google Scholar]
- Gattass R, Oswaldo-Cruz E, & Sousa APB (1978). Visuotopic organization of the Cebus pulvinar: A double representation of the contralateral hemifield. Brain Research, 152(1), 1–16. 10.1016/0006-8993(78)90130-0 [DOI] [PubMed] [Google Scholar]
- Goodale M. a., & Milner a. D. (1992). Separate visual pathways for perception and action. Trends in Neurosciences, 15(1), 20–25. 10.1016/0166-2236(92)90344-8 [DOI] [PubMed] [Google Scholar]
- Kaas JH (2012). Evolution of columns, modules, and domains in the neocortex of primates. Proceedings of the National Academy of Sciences, 109(Supplement_1), 10655–10660. 10.1073/pnas.1201892109 [DOI] [PMC free article] [PubMed] [Google Scholar]
- Kaas JH, & Lyon DC (2007). Pulvinar contributions to the dorsal and ventral streams of visual processing in primates. Brain Research Reviews, 55(2 SPEC. ISS.), 285–296. 10.1016/j.brainresrev.2007.02.008 [DOI] [PMC free article] [PubMed] [Google Scholar]
- Kwan WC, Mundinano IC, de Souza MJ, Lee SCS, Martin PR, Grünert U, & Bourne JA (2018). Unravelling the subcortical and retinal circuitry of the primate inferior pulvinar. Journal of Comparative Neurology, (December 2017). 10.1002/cne.24387 [DOI] [PubMed] [Google Scholar]
- Levitt JB, Yoshioka T, & Lund JS (1995). Connections between the pulvinar complex and cytochrome oxidase-defined compartments in visual area V2 of macaque monkey. Experimental Brain Research, 104, 419–430. 10.1007/BF00231977 [DOI] [PubMed] [Google Scholar]
- Li K, Patel J, Purushothaman G, Marion RT, & Casagrande VA (2013). Retinotopic maps in the pulvinar of bush baby (Otolemur garnettii). Journal of Comparative Neurology, 521(15), 3432–3450. 10.1002/cne.23358 [DOI] [PMC free article] [PubMed] [Google Scholar]
- Livingstone MS, & Hubel DH (1982). Thalamic inputs to cytochrome oxidase-rich regions in monkey visual cortex. Proceedings of the National Academy of Sciences of the United States of America, 79(19), 6098–6101. Retrieved from http://www.pubmedcentral.nih.gov/articlerender.fcgi-artid=347060&tool=pmcentrez&rendertype=abstract [DOI] [PMC free article] [PubMed] [Google Scholar]
- Lund JS, Lund RD, Hendrickson AE, Bunt AH, & Fuchs AF (1975). The origin of efferent pathways from the primary visual cortex, area 17, of the macaque monkey as shown by retrograde transport of horseradish peroxidase. The Journal of Comparative Neurology, 164(3), 287–303. 10.1002/cne.901640303 [DOI] [PubMed] [Google Scholar]
- Marion R, Li K, Purushothaman G, Jiang Y, & Casagrande VA (2013). Morphological and neurochemical comparisons between pulvinar and V1 projections to V2. Journal of Comparative Neurology, 521(4), 813–832. 10.1002/cne.23203 [DOI] [PMC free article] [PubMed] [Google Scholar]
- Mishkin M, & Ungerleider LG (1982). Contribution of striate inputs to the visuospatial functions of parieto-preoccipital cortex in monkeys. Behavioural Brain Research, 6(1), 57–77. 10.1016/0166-4328(82)90081-X [DOI] [PubMed] [Google Scholar]
- O’Brien BJ, Abel PL, & Olavarria JF (2001). The retinal input to calbindin-D28k-defined subdivisions in macaque inferior pulvinar. Neuroscience Letters, 312(3), 145–148. 10.1016/S0304-3940(01)02220-0 [DOI] [PubMed] [Google Scholar]
- Ogren MP, & Hendrickson a. E. (1977). The distribution of pulvinar terminals in visual areas 17 and 18 of the monkey. Brain Research, 137(2), 343–350. 10.1016/0006-8993(77)90344-4 [DOI] [PubMed] [Google Scholar]
- Purushothaman G, Marion R, Li K, & Casagrande V. a. (2012). Gating and control of primary visual cortex by pulvinar. Nature Neuroscience, 15(6), 905–912. 10.1038/nn.3106 [DOI] [PMC free article] [PubMed] [Google Scholar]
- Raczkowski D, & Diamond IT (1980). Cortical Connections of the Pulvinar Nucleus in Galago. Journal of Comparative Neurology, 193(1), 1–40. 10.1002/cne.901930102 [DOI] [PubMed] [Google Scholar]
- Raczkowski D, & Diamond IT (1981). Projections from the superior colliculus and the neocortex to the pulvinar nucleus in Galago. The Journal of Comparative Neurology, 200(2), 231–254. 10.1002/cne.902000205 [DOI] [PubMed] [Google Scholar]
- Rockland KS, Andresen J, Cowie RJ, & Robinson DL (1999). Single axon analysis of pulvinocortical connections to several visual areas in the macaque. Journal of Comparative Neurology, 406(2), 221–250. [DOI] [PubMed] [Google Scholar]
- Rosa MG, Casagrande VA, Preuss T, & Kaas JH (1997). Visual field representation in striate and prestriate cortices of a prosimian primate (Galago garnetti). Journal of Neurophysiology, 77(6), 3193–217. Retrieved from http://www.ncbi.nlm.nih.gov/entrez/query.fcgi?cmd=Retrieve&db=PubMed&dopt=Citation&list_uids=9212268 [DOI] [PubMed] [Google Scholar]
- Rovo Z, Ulbert I, & Acsady L (2012). Drivers of the Primate Thalamus. Journal of Neuroscience, 32(49), 17894–17908. 10.1523/JNEUROSCI.2815-12.2012 [DOI] [PMC free article] [PubMed] [Google Scholar]
- Schiller PH, & Malpeli JG (1977). The effect of striate cortex cooling on area 18 cells in the monkey. Brain Research, 126(2), 366–369. 10.1016/0006-8993(77)90734-X [DOI] [PubMed] [Google Scholar]
- Sherman SM, & Guillery RW (1998). On the actions that one nerve cell can have on another: distinguishing “drivers” from “modulators”. Proceedings of the National Academy of Sciences of the United States of America, 95(12), 7121–7126. 10.1073/pnas.95.12.7121 [DOI] [PMC free article] [PubMed] [Google Scholar]
- Stepniewska I, & Kaas JH (1997). Architectonic subdivisions of the inferior pulvinar in New World and Old World monkeys. Vis Neurosci, 14(6), 1043–1060. Retrieved from http://www.ncbi.nlm.nih.gov/entrez/query.fcgi?cmd=Retrieve&db=PubMed&dopt=Citation&list_uids=9447687 [DOI] [PubMed] [Google Scholar]
- Symonds LL, & Kaas JH (1978). Connections of striate cortex in the prosimian, Galago senegalensis. The Journal of Comparative Neurology, 181(3), 477–512. 10.1002/cne.901810304 [DOI] [PubMed] [Google Scholar]
- Trojanowski JQ, & Jacobson S (1977). Brain The Morphology and Laminar Distribution of Cortico-Pulvinar Neurons in the Rhesus Monkey. Experimental Brain Research, 62(1–2), 51–62. [DOI] [PubMed] [Google Scholar]
- Ungerleider L, Galkin T, & Mishkin M (1983). Visuotopic organization of projections from striate cortex to inferior and lateral pulvinar in rhesus monkey. Journal of Comparative Neurology, 217(2), 137–157. 10.1002/cne.902170203 [DOI] [PubMed] [Google Scholar]
- Wickersham IR, Finke S, Conzelmann K-K, & Callaway EM (2007). Retrograde neuronal tracing with a deletion-mutant rabies virus. Nature Methods, 4(1), 47–49. 10.1038/nmeth999 [DOI] [PMC free article] [PubMed] [Google Scholar]
- Wong P, Collins CE, Baldwin MKL, & Kaas JH (2009). Cortical connections of the visual pulvinar complex in prosimian galagos (Otolemur garnetti). Journal of Comparative Neurology, 517(4), 493–511. 10.1002/cne.22162 [DOI] [PMC free article] [PubMed] [Google Scholar]
- Wong P, & Kaas JH (2010). Architectonic subdivisions of neocortex in the galago (Otolemur garnetti). Anatomical Record, 293(6), 1033–1069. 10.1002/ar.21109 [DOI] [PMC free article] [PubMed] [Google Scholar]
- Zurita H, Rock C, Perkins J, & Apicella A junior. (2017). A Layer-specific Corticofugal Input to the Mouse Superior Colliculus. Cerebral Cortex, (July 2017), 1–17. 10.1093/cercor/bhx161 [DOI] [PMC free article] [PubMed] [Google Scholar]


