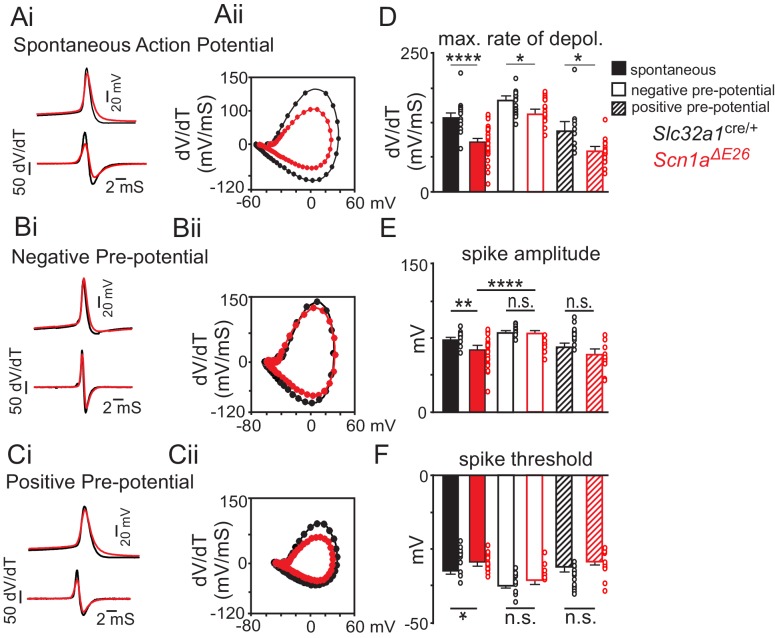
Figure 5. The Scn1a A1783V pathological variant may result in loss of channel function by increased voltage-dependent inactivation.
(A) average spontaneous action (Slc32a1cre/+ control n = 24 spikes, Scn1aΔE26 n = 29 spikes (top) and first time derivative of average action potentials (bottom) recorded from inhibitory neurons in slices from control and Scn1aΔE26 mice (Ai) and corresponding phase plot (Aii) (dV/dt; Y-axis vs mV; X-axis) of the traces in panel Ai show that cells expressing Scn1a A1783V depolarize slower compared to control cells (Figure 5—source data 1). (B), average first action potential following a hyperpolarizing pre-potential (−100 pA; 1 s) (Slc32a1cre/+ control n = 13 spikes, Scn1aΔE26 n = 16 spikes) (top) and first time derivative of average action potentials (bottom) recorded from inhibitory neurons in slices from control and Scn1aΔE26 mice (Bi) and corresponding phase plot (Bii) of traces in panel Bi show that holding cells at a negative pre-potential to remove sodium channel inactivation improved the depolarization kinetics of subsequent spikes (Figure 5—source data 1). (C), average first action potential following a depolarizing pre-potential (+180 pA; 1 s) (control n = 9 spikes, Scn1aΔE26 n = 11 spikes (top) and first time derivative of average action potentials (bottom) recorded from inhibitory neurons in slices from control and Scn1aΔE26 mice (Ci) and corresponding phase plot (Cii) of traces in panel Ci show that holding cells at a depolarized pre-potential to increase sodium channel inactivation diminished genotype differences in action potential kinetics (Figure 5—source data 1). (D–F), summary data showing the maximum rate of depolarization (D), action potential amplitude (E) and action potential threshold (F) of spontaneous action potentials and first spikes following positive or negative pre-potentials recorded in slices from control and Scn1aΔE26 mice. Results were compared by two-way ANOVA and the Sidak multiple comparison test.. *, p<0.05; **, p<0.01; ***, p<0.001; ****, p<0.0001.

