

SUMMARY
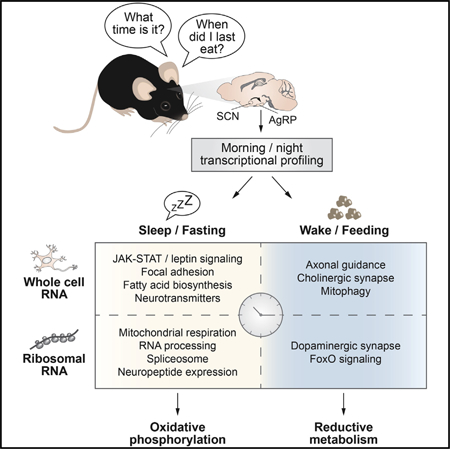
The alignment of fasting and feeding with the sleep/ wake cycle is coordinated by hypothalamic neurons, though the underlying molecular programs remain incompletely understood. Here, we demonstrate that the clock transcription pathway maximizes eating during wakefulness and glucose production during sleep through autonomous circadian regulation of NPY/AgRP neurons. Tandem profiling of whole-cell and ribosome-bound mRNAs in morning and evening under dynamic fasting and fed conditions identified temporal control of activity-dependent gene repertoires in AgRP neurons central to synaptogenesis, bioenergetics, and neurotransmitter and peptidergic signaling. Synaptic and circadian pathways were specific to whole-cell RNA analyses, while bioenergetic pathways were selectively enriched in the ribosome-bound transcriptome. Finally, we demonstrate that the AgRP clock mediates the transcriptional response to leptin. Our results reveal that time-of-day restriction in transcriptional control of energy-sensing neurons underlies the alignment of hunger and food acquisition with the sleep/wake state.
In Brief
The central molecular clock aligns feeding with the sleep/wake state. Cedernaes et al. employ RNA sequencing in AgRP neurons across different nutrient states, revealing time-of-day-dependent enrichment of circadian and bioenergetic gene networks. They discover that the behavioral and transcriptional response to leptin varies from morning to evening, as the AgRP clock coordinates the leptin response and glucose metabolism with arousal.
Graphical Abstract
INTRODUCTION
The circadian clock aligns periods of fasting and feeding with cycles of sleep and wakefulness in anticipation of the rotation of the Earth. The integration of feeding and arousal arises from molecular programming by the core clock, which is encoded by a transcription-translation feedback loop (TTFL) composed of two basic helix-loop-helix factors (CLOCK/BMAL1) in the forward limb that activate their own repressors (PERs/CRYs and REV-ERBs) in the negative limb, generating ~24-h rhythms of transcription and cell physiology (reviewed in Takahashi, 2017). Early studies in clock mutant mice (Clock∆19, for circadian locomotor output cycles kaput) linked the clock transcription pathway to metabolism (Turek et al., 2005), although a gap remains in understanding how the clock programs energy-sensing neurons to time hunger across sleep/wake states.
The circadian system achieves daily alignment through light-induced induction of activity in central hypothalamic pacemaker neurons and entrainment of extra-pacemaker and peripheral tissue clocks to the day-night cycle (Herzog et al., 1998; Morris et al., 1998; Saini et al., 2013). Anatomic lesioning studies have established interconnections between pacemaker and energy-sensing neurons, indicating that central clock disruption may alter the phase of activity within cell types important in feeding and energetics (Chou et al., 2003; Silver et al., 1996). Further evidence that central and peripheral rhythms play a key role in organismal homeostasis is highlighted by the observation that consolidation of feeding to the proper phase of the sleep/wake cycle impacts long-term metabolic health (Arble et al., 2009; Hatori et al., 2012; Kohsaka et al., 2007).
Clues concerning molecular pathways linking the circadian system with energy-regulating pathways have emerged from two lines of investigation. First, studies in peripheral tissues have highlighted key roles for the molecular clock in cell-type-specific rhythmic regulation of peptidergic hormone secretion (Perelis et al., 2015) and intermediary metabolism (Guan et al., 2018), which arise from both transcriptional (Guan et al., 2018) and post-transcriptional mechanisms (Robles et al., 2017). Second, RNA profiling studies aimed at defining appetitive neuron molecular subtypes and function within the hypothalamus has unexpectedly revealed enrichment of circadian factors in response to food deprivation, although the role of core clock transcription factors (TFs) in energy-sensing neuron activity has not been determined (Henry et al., 2015; Mandelblat-Cerf et al., 2015). Here, we show that disruption of the hypothalamic molecular clock results in daytime hyperphagia and overproduction of hepatic glucose and demonstrate a requirement for the cell autonomous clock in AgRP neurons for timing peripheral metabolic and transcriptional rhythms in response to an altered energy state. By tandem profiling of whole-cell and ribosome-associated RNAs in energy-sensing neurons in response to fasting, feeding, and leptin administration in both morning and evening, we also reveal circadian control of the behavioral and transcriptomic responses to an altered energy state.
RESULTS
Hypothalamic Molecular Clock Drives Nighttime Feeding and Induces Gluconeogenesis during Sleep
To first determine the role of the hypothalamic molecular clock in the coordination of energetics with sleep/wake rhythms, we utilized mice with forebrain-specific ablation of the clock (brain clock knockout [BKO] mice), achieved by crossing Bmal1fx/fx and Camk2α-Cre mice, which have enriched postnatal CRE expression in the forebrain and suprachiasmatic nucleus (SCN) (Casanova et al., 2001; Izumo et al., 2014; Kim et al., 2011) (Figures S1A and S1B). Analysis of food intake rhythms in animals with genetic ablation of Bmal1 in the hypothalamus showed a significant reduction in food intake during the dark period and increased intake during the light (Figure 1A), with BKO mice consuming only 69% of their food at night compared with 81% in controls (p < 0.01) despite similar total daily food intake and locomotor activity rhythms in 12:12 light:dark (LD) conditions (Figures 1A and S1C). Loss of diurnal feeding and activity rhythms was exacerbated following release into constant darkness (DD), as BKO mice consumed even more food during the rest period than in the active period (57% versus 43%, respectively, in the BKOs compared with 31% versus 69% in controls) despite equivalent total daily food intake (Figures 1A and S1C). In parallel with disrupted feeding cycles, compared with controls, BKO mice had increased adiposity, reduced lean mass, and increased body weight (Figures S1D and S1E).
Figure 1. Neural Molecular Clock Regulates Feeding Time and Glucose Homeostasis.
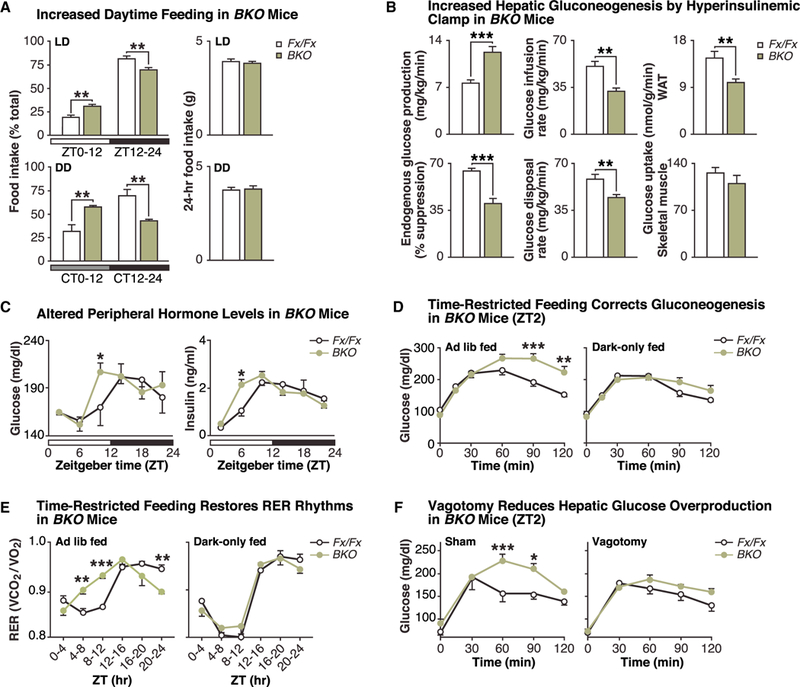
(A) Food intake (% of total daily intake) in Bmal1fx/fx (Fx/Fx) (white) and CamK2𝛼-Cre;;Bmal1fx/fx (BKO) (green) mice in normal light:dark (LD; 12:12 h) (top) and constant darkness (DD) (bottom) conditions (left panels). Total daily food intake (g) over the corresponding 24-h period in LD and DD (right panels) (n = 4–7). (B) Endogenous glucose production, glucose infusion rate, glucose disposal rate, and tissue-specific glucose uptake (in white adipose tissue [WAT] and skeletal muscle) during hyperinsulinemic-euglycemic clamping (n = 6). (C) Glucose and insulin levels measured every 4 h in ad-lib-fed Bmal1fx/fx and BKO mice (n = 3–5). (D) Time course of plasma glucose levels following an intraperitoneal injection of pyruvate (2 mg/kg) in fasted Bmal1fx/fx and BKO mice at ZT2, following either ad libitum feeding (n = 10–19) (left panel) or following two weeks of dark-only feeding (n = 7) (right panel). (E) Respiratory exchange ratio (RER) values (VCO2/VO2) over 24 h in either ad-lib-fed (n = 4/genotype) or dark-only fed (n = 4) BKO mice. (F) Time course of plasma glucose levels following pyruvate injection (2 mg/kg) in sham and vagotomized Bmal1fx/fx and BKO mice at ZT2 (n = 3–5). Data are represented as mean ± SEM (*p < 0.05, **p < 0.01, ***p < 0.001). See also Figures S1 and S2.
To further investigate how the neuronal clock regulates appetite across the day, we examined rebound feeding in the morning versus evening after food deprivation. Following a 24-h fast, we found that wild-type (WT) mice consumed significantly more food when provided the opportunity to eat at the beginning of the dark period (ZT12) rather than the beginning of the light (ZT0) in both 12:12 LD conditions (51% increase, p < 0.001) (Figure S1F, left) and also in DD (32% increase, p < 0.01) (Figure S1F, right). To control for differences in the nutrient prehistory prior to the withdrawal of food and refeeding at the onset of the light/rest (ZT0/CT0) versus dark/active (ZT12/CT12) period, we also included a control group with an extended food restriction time of 36 h prior to refeeding at the start of the light/rest (ZT0ʹ/CT0ʹ) period. Importantly, in both LD and DD, we still observed significantly greater rebound feeding at the onset of the active period (ZT12 compared with ZT0ʹ: 11% increase, p = 0.019; CT12 compared with CT0ʹ: 33% increase, p = 0.002) (Figure S1F). Regardless of time point, BKO mice demonstrated blunted rebound feeding (Figure S1G), indicating that disruption of the neuronal clock interferes with daytime and nighttime energy sensing.
Since appetite and glucose homeostasis is coordinated by overlapping neuronal circuits, we next performed hyperinsulinemic-euglycemic clamping to analyze whether neuronal ablation of Bmal1 alters peripheral metabolism. We found that BKO mice displayed a 60% increase in endogenous glucose production (EGP) compared with controls and a significantly reduced glucose infusion rate (GIR) during steady-state conditions to maintain euglycemia (Figure 1B). Furthermore, both suppression of EGP by insulin and the glucose disposal rate were significantly lower in the BKO mice, indicative of hepatic insulin resistance and decreased glucose utilization (Figure 1B). Finally, analysis of 2-deoxy-glucose uptake in peripheral tissues revealed that glucose uptake was significantly reduced in white adipose tissue (WAT) but not in skeletal muscle (Figure 1B), suggesting tissue-specific effects of neuronal clock ablation. Consistent with their altered peripheral glucose homeostasis, BKO mice displayed a phase advance and increase in daily glucose excursion and insulin rhythms (Figure 1C) in addition to increased glucose storage as glycogen during the daytime (ZT10) in liver (Figure S2A) (Marcheva et al., 2010). BKO mice also exhibited a phase advance in the respiratory quotient, consistent with increased eating during the subjective daytime (Figure 1E, left panel) and with an advance in the expression of metabolic TFs and lipogenic transcripts (such as Srebp-1c, Fasn, Ppara, and Pparγ) in liver, WAT, and brown adipose tissue (Figure S2B).
We next analyzed central clock control of liver glucose production by comparing glucose excursion in response to administration of the gluconeogenic substrate pyruvate either in the day or night. In WT animals, injection at the start of the light period (ZT2) resulted in significantly higher glucose excursion than at the start of the dark period (ZT14) (Figure S2C), consistent with the increased EGP when animals are normally resting. Interestingly, the pyruvate challenge response was markedly elevated in BKO compared with controls at ZT2 (Figures 1D, left panel, and S2D) but not at ZT14 (Figure S2E), indicating that rhythmic control of gluconeogenesis requires an intact neuronal clock. To determine the relationship between altered gluconeogenesis in BKO mice and mistimed feeding in these animals, we provided BKO mice with food either ad lib or restricted exclusively to the dark period (ZT12–24) for 2 weeks. Remarkably, we found that time-restricted feeding in the BKO mice normalized pyruvate tolerance at ZT2 (Figure 1D, right panel) in addition to rhythmic CO2 production and respiratory quotient (Figure 1E, right panel), consistent with beneficial effects of time-restricted feeding in WT mice (Arble et al., 2009; Hatori etal., 2012).
Hepatic glucose production is modulated by insulin-responsive hypothalamic and brainstem nuclei (Pocai et al., 2005), sympathetic MC4R signaling (Rossi et al., 2011), and autonomic nerve innervation of hepatic cells. To investigate whether the glucose overproduction in BKO mice is dependent on direct (nerve) versus indirect (such as hormonal) neuronally regulated signals, we selectively surgically resected the hepatic branch of the vagus nerve in BKO and control mice. We found that compared with sham surgery (Figure 1F, left panel), hepatic branch vagotomy normalized glucose excursion in response to pyruvate during the subjective daytime (ZT2) in BKO mice (Figure 1F, right panel). Notably, vagotomy had no effect on glucose excursion in control mice and did not impact body weight (BKO vagotomy: 31.9 ± 1.6; BKO sham: 32.8 ± 1.5 g; p = 0.96). Together, these findings indicate that neuronal clock gene ablation leads to deregulation of peripheral glucose homeostasis due to increased parasympathetic innervation of liver.
Morning and Evening Differences in Energy-State-Dependent Transcription in AgRP Neurons
We and others have found evidence for time-of-day-dependent variation of mRNA expression of AgRP/NPY-expressing neurons that regulate both food intake and hepatic glucose metabolism (Figure S3A) (Andermann and Lowell, 2017; Krashes et al., 2013; Xu et al., 2018). As additional evidence has pointed to circadian modulation of these neurons (Henry et al., 2015; Man-delblat-Cerf et al., 2015), we investigated the role of the cell autonomous clock in AgRP neurons in feeding and metabolism. We found that mice with AgRP-specific ablation of Bmal1 (AgRP-Cre;;Bmal1fx/fx, here called ABKO mice) exhibited increased daytime hepatic glucose production in the hyperinsu-linemic-euglycemic clamp (Figures 2Aand S3B). Despite normal locomotor activity rhythms (Figure S3C), ABKO mice showed increased 24-h food intake compared with controls because of significantly increased food consumption at each “meal,” with significantly greater intake per feeding bout during the nighttime (ZT0–24 ANOVA effects for 24-h food intake [p = 0.0362] and for feeding bout mass [p = 0.0184]) (Table S1A). Consistent with these findings, ABKO mice also exhibited an increased 24-h and daytime (ZT0–12)-specific respiratory exchange ratio (RER) (p = 0.0004 and 0.0060, respectively) (Figure S3D) as well as a trend toward increased body weight (p = 0.068) (Table S1A), collectively indicating an altered hunger profile in ABKO mice.
Figure 2. RNA Profiling Reveals Distinct Morning versus Evening Networks in Energy-Sensing AgRP Neurons by Whole-Cell and RiboTag Sequencing.
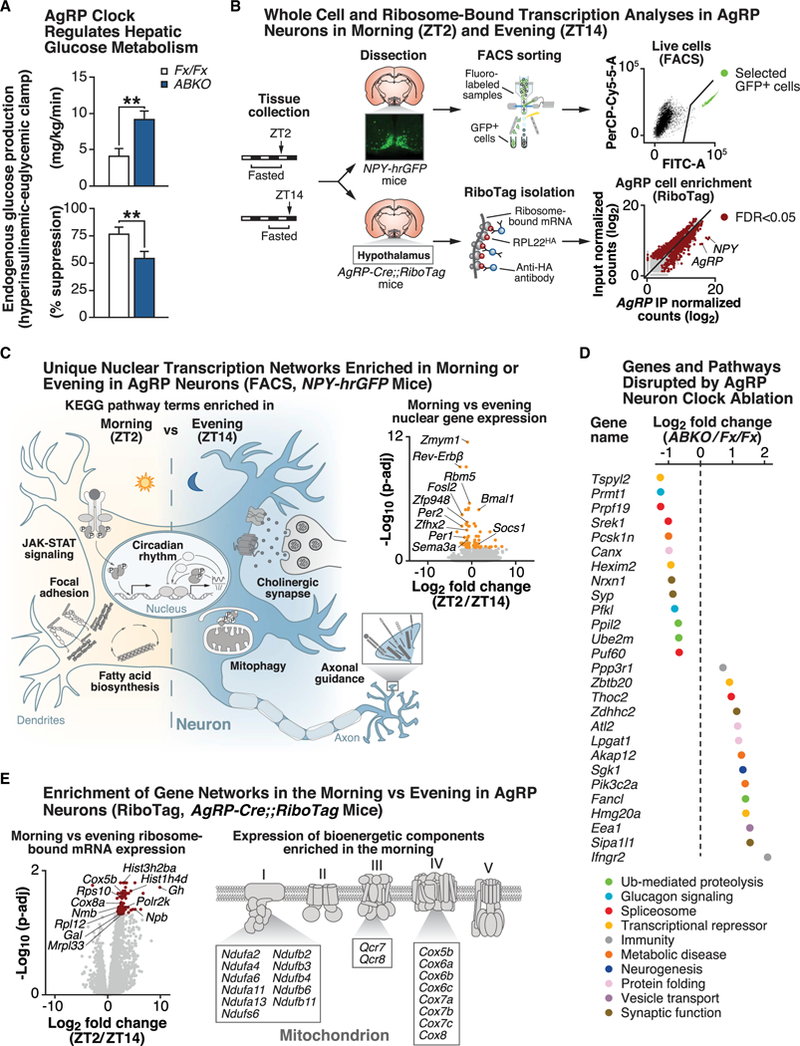
(A) Endogenous glucose production during hyperinsulinemic-euglycemic clamping in Bmal1fx/fx (Fx/Fx) (white) and AgRP-Cre;;Bmal1fx/fx (ABKO) (blue) mice (n = 5–9). (**p< 0.01). (B) Experimental protocol outlining fluorescence-activated-cell-sorting (FACS)-based methods for whole-cell transcriptomics analyses (top row) and RiboTag-based methods for ribosome-bound transcriptomics analyses (bottom row) in AgRP neurons from fasted NPY-hrGFP and AgRP-Cre;;RiboTag mice, respectively, in morning (ZT2) and evening (ZT14) (see STAR Methods for specific details). (C) Representation of significant (FDR-adjusted p value < 0.05) gene networks identified from KEGG pathway analyses that are enriched in either the morning (ZT2) (i.e., JAK-STAT signaling, focal adhesion, and fatty acid biosynthesis) or evening (ZT14) (i.e., axonal guidance, mitophagy, and cholinergic signaling) in AgRP neurons by FACS (n = 7–8). Volcano plot comparing FDR-adjusted p values (y axis) and fold change (ZT2/ZT14) (x axis) displays the transcripts that are differentially expressed between morning and evening as orange dots (FDR-adjusted p < 0.05). (D) Log2-fold change in gene expression in AgRP neurons from ABKO mice compared with Bmal1fx/fx controls (both lines crossed with NPY-hrGFP for FACS) for indicated genes, color-coded for the associated KEGG (or literature-defined) pathways that each gene is associated with (n = 2–3). (E) Volcano plot comparing FDR-adjusted p values (y axis) and fold change (ZT2/ZT14) (x axis) displays the transcripts that are differentially expressed between morning and evening in AgRP-Cre;;RiboTag mice as red dots (FDR-adjusted p < 0.05) (n = 5–7). Representative genes changed in the mitochondrial oxidative phosphorylation pathway are shown. See also Figure S3.
Given that fasting/feeding cycles are coordinated with the sleep/wake state, we examined mRNA transcription in the morning versus evening in AgRP cells in response to restricted fasting, thereby eliminating differences in energy state associated with ad lib feeding. We utilized fluorescence-assisted cell sorting (FACS) to isolate AgRP-expressing neurons in both morning (ZT2) and evening (ZT14) from the arcuate hypothalamic nucleus of fasted mice that expressed an AgRP-specific fluorescent reporter (NPY-hrGFP mice) (Figure 2B). Single adult brains were used as replicates, from which the arcuate nuclei were dissected (fluorescence-assisted), followed by an optimized short dissociation time to minimize neuronal stress from the dissociation process (see STAR Methods for details and Figure S3E for purity assessed against other CNS-specific cell types). Subsequent low-input mRNA sequencing (RNA-seq) revealed differential expression of 88 genes in morning compared with evening (47% increased) (false discovery rate [FDR] < 0.05) (Figure 2C; Table S1B). Circadian-rhythm-related transcripts emerged as one of the most dynamically changed networks in morning and night, revealing that Bmal1 (Arntl) was increased while the repressor elements Rev-erbβ (Nr1d2), Per1, and Per2 were decreased in the morning (Figure 2C; Table S1C). Immediate early genes, such as Fosl2, as well as genes encoding DNA-and RNA-binding proteins, including Zmym1, Rbm5, Zfp948, andZfhx2, were reduced at ZT2 compared with ZT14, suggesting a role for the AgRP molecular clock in driving neuronal activity and, thus, feeding behavior during the evening in mice (Figure 2C). Induction of immediate early genes restricted to a single isolation time point indicates that our FACS-based RNA-seq method did not cause stress related to the isolation process (Henry et al.,2015). The axon guidance pathway was enriched at ZT14 (e.g., via Sema3a), while focal adhesion (e.g., via Pdgfa) was enriched at ZT2, suggesting circadian rhythmicity of these leptin-responsive remodeling processes (Pinto et al., 2004) (Figure 2C; Table S1C). Finally, the leptin-responsive JAK-STAT signaling pathway was increased in the morning, indicating that leptin signaling in AgRP neurons may be enhanced during the daytime when animals are normally at rest (Figure 2C; Table S1C).
AgRP Clock Regulates Activity-Dependent Transcription
Having established time-of-day-dependent transcriptional regulation in AgRP neurons of WT mice, we next tested the role of the cell autonomous clock in genome-wide transcription in AgRP neurons by performing RNA-seq in fasted ABKO mice at ZT5, the time of maximal BMAL1 activity in mice (Maywood et al., 2003). Loss of a functional clock in AgRP neurons resulted in the up-and down-regulation of 41 and 22 genes, respectively, in the fasted state (FDR < 0.05) (Figure 2D; Table S1D). Several RNAs encoding transcriptional repressors were significantly altered (Hexim2, Zbtb20, Tspyl2, and Hmg20a), and of these, Tspyl2 and Hmg20a modulate neuronal function and development through interaction with the REST/NRSF repressive complex that also controls glucocorticoid-regulated genes (Abramovitz et al., 2008; Epping et al., 2015). Consistent with thisfinding, ABKO mice displayed increased Sgk1, a glucocorticoid-respon- sivegene involved in neurogenesis (Anackeretal., 2013). Intriguingly, Bmal1 ablation in AgRP neurons also altered levels of several genes encoding factors involved in protein folding (Canx and Atl2, endoplasmic reticulum membrane proteins, and Lpgat1, a lysophosphatidylglycerol acyltransferase), vesicle transport (Eea1, endocyte trafficking), and synaptic function (Zdhhc2, regulator of receptor density; Syp, Nrxn1, and Sipa1l1, modulators of synaptic morphology), suggesting that the clock in AgRP neurons may modulate signaling events within the secretory pathway. Given the role of AgRP neurons in stimulating hunger, we also noted that several of the differentially expressed genes have been associated with human obesity and type 2 diabetes, such as Akap12, Pfkl, Pik3c2a, and Pcsk1n (Stijnen et al., 2016). For instance, Pcsk1n encodes a protein that is part of the prohormone convertase family (PC1–3), which is involved in the cleavage of both orexigenic and anorexigenic substrates, such as of CART, POMC, and pre-AGPR (Burnett et al., 2017; Stijnen et al., 2016). Finally, KEGG (Kyoto Encyclopedia of Genes and Genomes) pathway analysis revealed alterations in glucometabolic and post-transcriptional regulatory pathways, such as glucagon signaling (via Pfkl, Ppp3r1, and Prmt1), spliceosome (Prpf19, Puf60, and Thoc2), and ubiquitin-mediated proteolysis (Fancl, Ppil2, and Ube2m) as well as in immunity, such as T cell differentiation (Ifngr2, Ppp3r1) (Figure 2D).
The Ribosome-Associated Transcriptome Exhibits Exaggerated Response to Fasting in the Morning
Dynamic synaptic reorganization enables neurons to respond appropriately to changes in the environment and depends on the ability to locally translate mRNAs into proteins in dendrites and axons (Shigeoka et al., 2016). Indeed, hypothalamic neuronal response to fasting plays a central role in coordinating energy state with neuroendocrine homeostasis (Ahima, 2008). With respect to molecular profiling, neuronal activity indicated by immediate early genes such as cFos overlaps with ribosomal activation (as indicated by phosphorylation of the ribosomal S6 protein), providing evidence that identification of day-night rhythms in ribosome-bound mRNAs more directly mirrors the activity state of neurons (Knight et al., 2012). We therefore next assessed whether genome-wide transcription at the level of ribosome-bound mRNAs in AgRP neurons of fasted AgRP-Cre;;RiboTag mice in the morning (ZT2) compared with that in the evening (ZT14) (Sanz et al., 2009) (Figures 2B and 2E). Immediately following dissection of the medial basal hypothalamus, samples were harvested for immunoprecipitation and RNA isolation (see STAR Methods for details) (Figures 2B and S3E). Subsequent RNA-seq of ribosome-associated mRNAs revealed differential expression of 143 genes (FDR < 0.05) between morning and evening (Figure 2E; Table S1E). Surprisingly, almost all (142) were increased in the morning compared with the evening (Figure 2E), in contrast to the transcriptional dynamics of FACS-based whole-cell RNA-seq of AgRP neurons (Figure 2C).
Interestingly, KEGG analyses revealed a significant increase in oxidative phosphorylation (e.g., cytochrome c oxidase subunits Cox5b and Cox8a) during the morning specifically in ribosome-associated RNAs (Figures 2E and S3F), supporting the concept that mitochondrial function modulates activity of AgRP neurons (Dietrich et al., 2013). We also observed a morning-time increase in ribosome subunit expression (Mrpl33, Rpl12, and Rps10) (Figure 2E), analogous to liver clock control of ribosome biogenesis (Jouffe et al., 2013; Sinturel et al., 2017). Since neuronal activity and synaptic remodeling have been strongly associated with induction of translation, these findings raise the possibility that AgRP-regulated alterations in hunger and metabolism likewise involve clock-dependent translational regulation (Knight et al., 2012). Of note, while we did not find any significant time-of-day difference for leptin receptor mRNAs, we observed temporal variation in ribosome-bound mRNA expression of several neuropeptides and their receptors, such as growth hormone (Gh), neuromedin B (Nmb), neuropeptide B (Npb), and galanin (Gal) (Figure 2E), which did not demonstrate morning versus evening differences at the level of whole-cell RNA analyses (Figure 2C). Several of these, including Nmb and Gal, are known to modulate organismal energy and glucose metabolism via AgRP-neuron-specific actions, possibly separately from its central sleep-promoting role (Kroeger et al., 2018) but have never been described in the context of day-night rhythms in genetically defined appetitive neurons (Knight et al., 2012; van den Pol et al., 2009). Finally, we also note that 98% of the genes significantly altered at the ribosome-bound mRNA level (141/143) exhibited ≥ 2-fold (log2) changes between morning and evening, whereas this only was the case for 19% of the genes at the transcriptional level (17/88). Our analyses thus reveal robust transcriptional dynamics across the sleep/wake cycle in AgRP neurons in the fasted state, with enrichment of bioenergetic and peptidergic transcripts detected by ribosome-associated RNA-seq in the morning.
Fasting-Feeding Cycle Associated with Distinct Transcription Patterns in Morning and Nighttime
While previous studies showed that AgRP neurons display alterations in gene expression following starvation or after ghrelin administration (Henry et al., 2015; Knight et al., 2012), the transcriptional mechanisms by which AgRP neurons respond to fasting compared with ad libitum feeding at the same time in the light-dark cycle have not been examined. Thus, while our day/night studies above assessed transcription in the fasted state (Figure 2), we next investigated how the transition between the fed and fasted states alters genome-wide transcription (i.e., log2-fold change [fasted/fed]) in the morning (ZT2) and evening (ZT14) by tandem FACS and RiboTag analyses (Figure 3A) (see STAR Methods and Figures S3E–S3G). First, by FACS analyses, we found differential expression of 6,234 genes (53.7% up-regulated) at ZT2 in AgRP neurons but only 2,818 genes (61.6% up-regulated) at ZT14 (Figure 3B; Tables S2A and S2B). While 2,405 of these genes were commonly regulated between the two time points, the remaining 3,829 and 413 of the fasting-responsive genes at ZT2 and ZT14, respectively, displayed unique time-of-day-dependent differences (Figure 3B), suggesting that the dynamic response to fasting is greater in the morning compared with the evening. Examination of the fold change between the fasting and fed states in ribosome-bound mRNA expression in AgRP neurons similarly revealed significantly more differentially expressed transcripts in the morning (2,668, 70% up-regulated) than in the evening (1,950, 60% up-regulated) (Figure 3B; Tables S2C and S2D). Unexpectedly, wholecell and RiboTag datasets were found to only exhibit partial overlap in terms of altered genes at ZT2 and ZT14 (20% and 25% overlap, respectively). Moreover, genome-wide hierarchical clustering analysis of genes induced by fasting compared with the fed state revealed clear time-of-day differences and a greater dynamic range in ribosome-bound compared with whole-cell RNAs in the morning compared with the evening (Figure 3C).
Figure 3. Dynamic Whole-Cell and RiboTag Energy State Transcriptional Response in Energy-Sensing AgRP Neurons across the Sleep/ Wake Cycle.
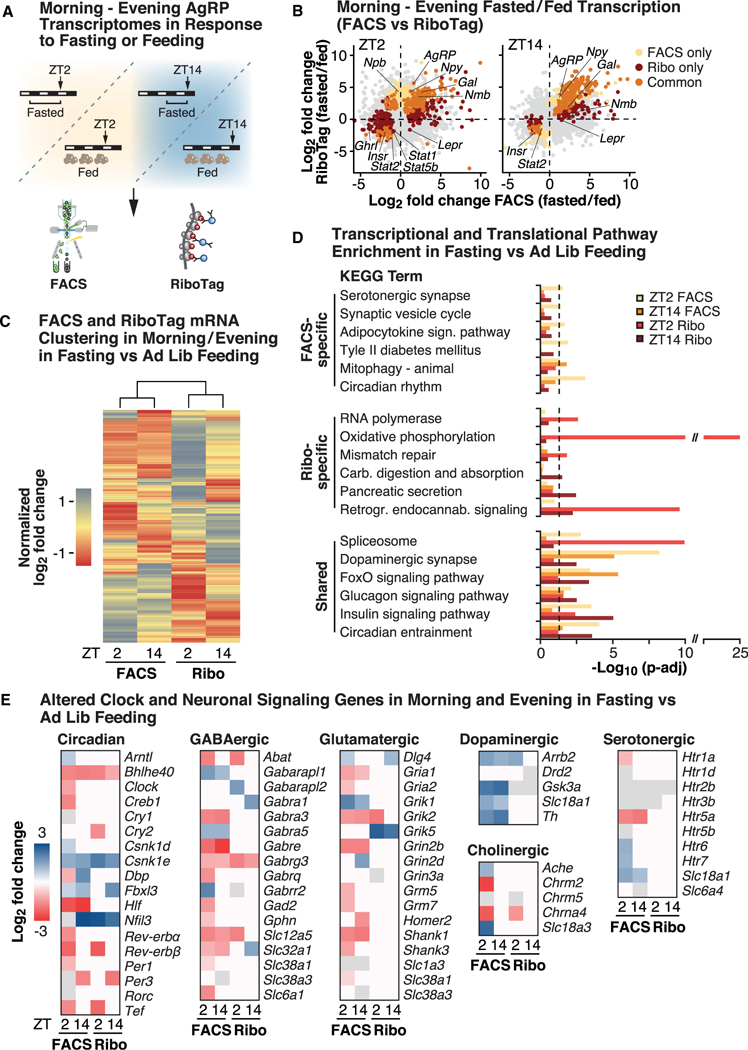
(A) Overview of sample collection paradigm in the morning (ZT2) and evening (ZT14). Mice were either ad libitum fed or fasted at ZT12 for subsequent collection, using both FACS (NPY-hrGFP mice) and RiboTag (“Ribo” AgRP-Cre;;RiboTag mice) approaches. (B) Quadrant plot of transcriptional responses at ZT2 and ZT14, comparing log2-fold changes induced by fasting (versus the fed state) in samples collected by FACS (x axis) (n = 3–8) and RiboTag (y axis) (n = 3–7) (showing significant genes; FDR-adjusted p values < 0.05). (C) Hierarchical clustering of normalized log2-fold changes in gene expression across all identified transcripts in AgRP neurons across morning and evening, comparing changes induced by fasting (versus the fed state), in animals collected by both FACS and RiboTag. (D) Significant pathway enrichment (FDR-adjusted p < 0.05) in fasted versus adlibitum-fed animals across time points and comparing whole-cell (by FACS) and ribosome-bound (RiboTag) mRNAs, showing pathways that are either specific in terms of significance to FACS (top panel) or RiboTag (middle panel) or that are shared by both methods. (E) Heatmaps of significantly altered (FDR-adjusted p < 0.05) genes in significantly enriched pathways, across time points (ZT2 and ZT14) and utilized methods (FACS and RiboTag). Shown as log2-fold changes (cutoff at ± 3) in response to fasting versus ad libitum feeding. See also Figures S3 and S4.
Ontology analysis of genes differentially expressed upon fasting revealed both distinct and shared KEGG pathways at the whole-cell and ribosome levels in the morning versus the evening. First, among shared pathways, there was enrichment of spliceosome, insulin, glucagon, and dopaminergic signaling networks (i.e., those enriched at the level of both whole-cell and ribosome-bound RNAs) (Figure 3D; Tables S2E–S2H). Second, uniquely, pathways exhibiting enrichment in FACS but not in RiboTag included serotonergic synapses, synaptic vesicle cycling, and adipocytokine signaling (Figure 3D). Third, pathways uniquely enriched at the RiboTag level included oxidative phosphorylation and RNA processing (Figure 3D). Together with our detection of morning versus evening differences in RNAs encoding factors involved in ribosomal biogenesis, peptidergic secretion, and mitochondrial function uniquely by using ribosome-associated profiling, this suggests that the circadian clock also may be involved in dynamically regulating bioenergetic pathways through post-transcriptional mechanisms.
As the circadian clock is composed of a TTFL, our concurrent whole-cell and RiboTag analyses afforded us the ability to survey how clock genes are dynamically regulated in response to fasting. Intriguingly, we observed that far more clock genes were significantly altered in the morning (18/19) compared with the evening (7/19) when examining the log2-fold change of fasted/ fed gene expression (Figures 3E and S3G) (Henry et al., 2015). At ZT2, AgRP neurons exhibited up-regulation of positive arm elements such as Bmal1, Rorc, and Csnk1d/e, while negative arm elements including Rev-Erbα, Rev-Erbβ, and Per1 were down-regulated (Figures 3E and S3G). While some of these genes (e.g., Csnk1e, and Fbxl3) were altered in the same direction at ZT14, most exhibited no change at ZT14 (e.g., Bmal1 and Rev-Erbα/β) or were altered in the opposite direction compared with the morning time point (e.g., Dbp and Per3) (Figures 3E and S3G). In our RiboTag data, we observed only a handful (8) of significantly altered clock genes, consistent with our previous observation in fasted mice that time-of-day-dependent differences in canonical clock genes were more prevalent at the whole-cell versus ribosome-bound mRNA level (Figure 3E). However, we noted that there was a more even distribution in core clock genes that were significantly altered in the morning (6 genes, e.g., Cry2) versus the evening (5, e.g., Per3) in the ribosome-bound compared with whole-cell RNA data (Figure 3E). Together, these data raise the possibility that AgRP neurons regulate molecular clock expression in response to an altered energy state through distinct transcriptional and post-transcriptional processes.
Since AgRP neurons convey both acute and long-term signaling, we also investigated how transitioning from the fed to fasted state altered canonical neuropeptides and neurotransmitter networks (Heisler et al., 2006; Krashes et al., 2013). First, we noted that leptin receptors only were up-regulated at the whole-cell RNA level in response to fasting versus ad lib feeding, whereas the insulin receptor was down-regulated both at the whole-cell and ribosome-bound RNA level (Figure 3B; Tables S2A and S2B). Both GABAergic and glutamatergic pathways were primarily down-regulated at ZT2 in fasted versus ad lib-fed mice, and again, these changes were primarily observable at the whole-cell and not ribosome-bound RNA level (Figure 3E; Tables S2A–S2H). As the GABAergic output from AgRP neurons is essential for AgRP-mediated feeding (Wu et al., 2009), daytime reduction of this pathway, even in fasted mice, supports our finding that mice have a lower circadian feeding drive during the light period. Some genes within the GABAergic (e.g., Gabra1, and Slc32a1) and glutamatergic (e.g., Grik2 and Grin3a) signaling cascades, however, only exhibited time-of-day differences in response to fasting versus ad lib feeding at the ribosome-bound RNA level (Figure 3E). We also observed that dopaminergic genes were up-regulated in response to fasting versus feeding in both morning and evening, whereas cholinergic and serotonergic components were primarily altered in the morning by FACS (Figure 3E). Together, this argues for significant morning versus evening regulation of signaling pathways that are known to regulate synaptic modulation and feeding in AgRP neurons (Krashes et al., 2013; Liu et al., 2012; Wu et al., 2009).
To uncover possible transcriptional mechanisms that may underlie the observed gene expression changes in response to an altered energy state, we also performed consensus-motif-based TF analyses based on our significant gene targets across FACS and RiboTag at the two time points. In FACS, we observed morning-specific enrichment of TFs involved in cell growth and mitochondrial function (SP1, GFY, and RONIN) as well as for clock-mediated transcription (USF½ and TFE3 for E-boxes; E-BOX; bHLHE40, KLF14) and immediate early genes (ELK¼, USF½). Several of these energy-state-dependent TF motifs (e.g., ELK¼) were also morning specific in RiboTag analyses and encompassed other TFs that regulate mitochondrial function (e.g., GABPA) (Figure S4A).
Time-of-Day-Dependent Transcriptional Response to Feeding in AgRP Neurons
Previous electrophysiologic studies indicate that AgRP neurons exhibit increased firing in the afternoon, prior to the onset of feeding, while time-restricted feeding studies indicate marked differences in the metabolic effects of feeding at different times of day (Hatori et al., 2012; Mandelblat-Cerf et al., 2015). We thus sought to analyze whether transcriptional profiles of AgRP neurons exhibit distinct repertoires when animals are only provided the opportunity to eat in either the morning or at night. To do so, we performed whole-cell RNA profiling (by FACS) of mice that had been refed 1 h prior to collection at ZT2 and ZT14 compared with mice that had been fasted until the time of collection. We found that in the morning, refeeding compared with fasting altered expression of 3,315 transcripts (46% up-regulated), whereas a smaller set of 1,896 transcripts (44% up-regulated, 1,410 genes shared with ZT2) were altered when mice were refed in the evening (Tables S3Aand S3B). Directional (specific to up- or down-regulated pathways) KEGG analyses identified several pathways—such as focal adhesion (down- regulated)—that were significantly altered in response to refeeding across both time points (Tables S3C and S3D). Given that fasting induces spinogenesis in AgRP neurons (Liu et al., 2012), down-regulation of focal adhesion as mice transition to an early postprandial state could signify that this process can be rapidly terminated. KEGG analyses also identified pathways that were significantly altered only in the morning, such as GABAergic synapse and ribosome (up-regulated) and fatty acid metabolism and serotonergic synapse (down-regulated) pathways (Figure 4A). Some pathways were instead only altered in the evening in response to refeeding, such as the spliceosome pathway (down-regulated) (Figures 4A and 4B), similar to circadian control of splicing in liver (McGlincy et al., 2012). Of note, motif analyses indicated that the same TF motifs that were morning specific in fasted versus fed FACS samples (GFY-STAF, GFY, and RONIN) were also enriched following rebound feeding in the morning (Figure S4B), suggesting that some of the acute versus more long-lasting transitions to and from the postprandial state engage the same transcription mechanisms. In sum, these findings raise the possibility that differences in the transcriptional response to morning versus evening following restricted feeding may underlie beneficial effects linked to eating at specific times during the light-dark cycle.
Figure 4. Clock Timing of AgRP Neuron Transcriptional Response to Restricted Feeding and Leptin.
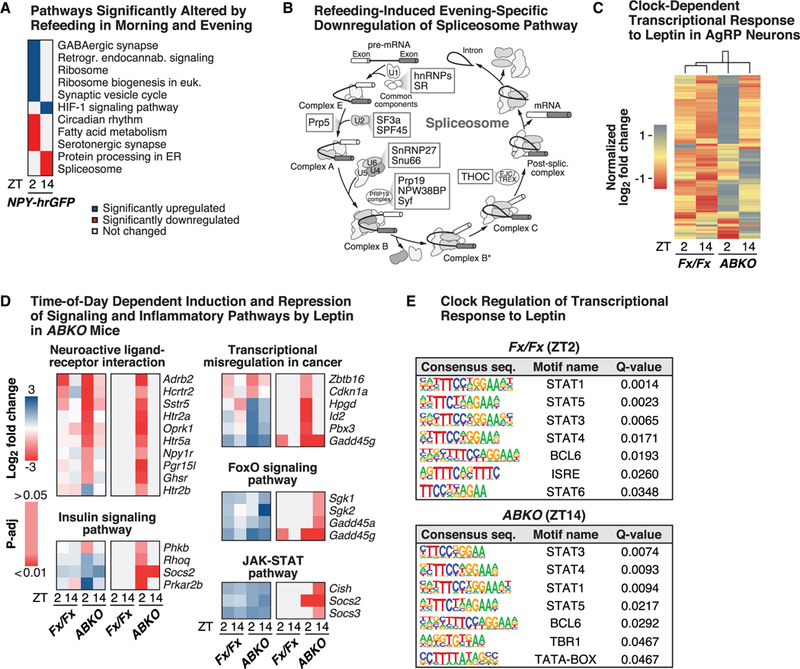
(A) Selected KEGG pathways that were significantly enriched (FDR-adjusted p < 0.05) based on genes that were up- or down-regulated in morning (ZT2) and evening (ZT14) in AgRP neurons of mice (NPY-hrGFP) that were refed 1 h prior to collection, compared with fasted mice (all collected by FACS) (n = 4–8). (B) Significantlydown-regulated components (highlighted in boxes) ofcomplexesalong thespliceosome KEGG pathway in response to restricted feedingversus fasting at ZT14. (C) Hierarchical clustering of normalized log2-fold changes in gene expression inAgRP neurons at ZT2 and ZT14in Bmal1fx/fx (Fx/Fx) versus AgRP-Cre;;Bmal1fx/fx (ABKO) mice (lines crossed with NPY-hrGFP for FACS) (n = 3–4), showing all transcripts that were significantly different in response to leptin versus vehicle administration across the time points and genotypes. (D) Log2-fold change in expression ofgenesin significantlyenriched KEGG pathwaysin ABKO mice at ZT2 andZT14in responseto leptinversusvehicle, showing log2-fold changes (± 3) across time points and genotypes (significant genes with FDR-adjusted p < 0.05 highlighted in the right column for each pathway). (E) Motif analysis with significantly enriched (q value < 0.05) consensus sequences and the associated transcription factors, based on the transcriptional response (for up-regulated genes) to acute leptin versus vehicle administration in Fx/Fx and ABKO mice at the specified time points (no significant motifs found for other time points). See also Figures S3 and S4.
Leptin-Mediated Transcriptional Responses in AgRP Neurons Are Modulated by the Molecular Clock
AgRP neurons respond to the circulating hormone leptin, which we found peaked earlier in the BKO mice (in the middle of the light period) compared with ad-lib-fed control mice (Figure S4C). We also found absolute leptin levels to be higher at ZT12 in fasted WT mice (Figure S4D) and that leptin suppressed rebound feeding after fasting only when given during the day (ZT0) and not at night (ZT12) (Figure S4E), which corresponded with a 23% increase in leptin-mediated phosphorylation of STAT3 at ZT0 versus ZT12 (p = 0.043) in arcuate nucleus (Buettner et al., 2006) (Figure S4F). Our observations that leptin response varied across the day and that RNAs encoding JAK-STAT signaling pathway were more robustly induced at ZT2 versus ZT14 led us to analyze the temporal dynamics of the genome-wide transcriptional response to leptin and the role of the AgRP clock in this process. We therefore performed RNA-seq in fasted ABKO and control mice that had been injected with leptin (2 mg/kg) or vehicle 1 h prior to collection at ZT2 and ZT14. In control mice, leptin altered the expression of 33 genes at ZT2 but only 9 genes at ZT14 (Figure S4G; Tables S4A and S4B), in line with our observation of morning-specific leptin-induced appetite suppression in mice that undergo rebound feeding. Notably, 5 of the 9 genes that changed at ZT14 were also changed at ZT2 and included both characterized (Arid5a and Steap4) as well as uncharacterized (Rnf122, Ptger2, and Gcc1) genes in relation to leptin signaling (Allison et al., 2018), suggesting both time-dependent and time-independent transcriptional responses to leptin. Of note, we observed morning versus evening enrichment of circadian rhythms in control but not ABKO mice (Tables S4C and S4D), as control mice exhibited over seven times more genes as ABKO mice that were significantly different between morning and evening (187 genes versus 25 genes) (Tables S4E and S4F). The rhythmic genes specific to controls included canonical clock genes (e.g., Rev-Erbα, Rev-Erbβb, Arntl) as well as neurotransmitter and neuropeptide receptors, such as those for Arginine vasopressin (Avp1ra), acetylcholine (Chrna1, Chma6), histamine (Hrh3), and serotonin (Htr2b).
Surprisingly, however, whereas control mice exhibited greater rhythmic gene transcription than ABKO mice, we instead found that ABKO mice exhibited a markedly greater number of significantly differentially expressed genes in response to leptin (compared with vehicle) than their littermate controls, both in the morning (170 genes) and evening (65 genes) (Figure S4G; Tables S4G and S4H), raising the possibility that absence of BMAL1 in AgRP neurons results in derepression in response to a neuronal stimulus. Supporting this notion, out of a total of 265 altered genes, we observed reduced expression of the core clock repressor elements (Rev-Erbα, Rev-Erbβ, and Per3) in the evening in ABKO versus control mice and, concordantly, increased levels of the core clock activator elements (Npas2) (Figures S4C–S4G; Tables S4I and S4J). The de-repression of leptin-induced transcription in ABKO mice supports the idea that leptin both activates and represses many of its functional target genes (Soukas et al., 2000).
Another pathway induced by leptin specifically in the ABKO mice and only in the evening (ZT14) was the FOXO signaling pathway (Figure 4D) through genes belonging to the Serum/ Glucocorticoid Regulated Kinase family (Sgk1 and Sgk2). In contrast, specifically ABKO mice exhibited the greatest induction of KEGG gene networks involved in neuronal signaling in the morning (at ZT2), such as receptors for serotonin (Figure 4D) and opioid-receptor-mediated signaling (Penk and Oprkl) as well as genes involved in potassium signaling (Kcnab1 and Kcnv1) and in neurite growth and neurogenesis (Gpr6 and Gprc5a). Suggesting that the molecular clock is involved in leptin-mediated exocytosis and protein transport, we also noted that leptin administration induced genes involved in the Golgi, endoplasmatic reticulum function, and vesicle transport (Rtp4 and Myrip), in ABKO mice (Tables S4G and S4H).
Intriguingly, in addition to the core clock repressors, we also noted that leptin altered the expression of immediate early genes (such asFosb and Junb) as well as several leptin signaling factors in the evening in ABKO mice, such as Arid5a, Atf3, Cish, Socs2, and Socs3 (Allison et al., 2018). The three latter genes are part of the JAK-STAT signaling cascade, which includes the established inhibitory factor Socs3 (Figure 4D; Table S4D). In addition to the aforementioned gene expression changes, we also noted genotype differences in motif enrichment in response to leptin. Specifically, whereas control mice exhibited a ZT2-specific enrichment of transcription mediated by leptin-responsive STAT TFs (e.g., STAT1, STAT5, and STAT3) (Figure 4E), these TF motifs were instead only enriched at ZT14 in ABKO mice, altogether consistent with the notion that AgRP-specific ablation shifted the transcriptional leptin responsiveness to the evening.
DISCUSSION
Here, we reveal that the cell autonomous clock in AgRP neurons regulates organismal behavior and physiology, building upon our observation in BKO mice showing that the forebrain clock is required for the alignment of feeding rhythms with the light/ dark cycle. Moreover, BKO mice also reveal that loss of neuronal clock leads to increased peripheral glucose levels because of sustained vagal innervation of liver, which can be reversed by either vagotomy or feeding restricted to the dark period. Our data suggest that the AgRP clock is critical in the central regulation of hepatic glucose production, and our transcriptional analyses at the whole-cell and ribosomally bound mRNA levels reveal dynamic day/night transcriptional rhythms in these energy-sensing neurons. By analyzing the dynamic response to an altered nutrient state, we furthermore reveal distinct modes of transcriptional control in AgRP neurons across the light/dark cycle. Surprisingly, our molecular profiling revealed that temporal control of bioenergetic factors was unique to the ribosome-associated RNAs. Finally, we found that the behavioral and neuronal transcriptional response to leptin varies from morning to evening, establishing that the AgRP clock is critical for regulating both the timing and magnitude of the transcriptional response to neuropeptide signaling.
Cell-type-specific analyses herein identify clock expression in NPY/AgRP neurons as critical both in peripheral glucose production and respiratory rhythms, further localizing the site of molecular clock action in energy balance. As the appetitive drive peaks during the active phase each day, with increased afternoon firing of AgRP neurons (Mandelblat-Cerf et al., 2015), the daily transition between fed and fasted states represents a highly dynamic challenge that induces not only changes in the activity but also the morphology of AgRP neurons (Aponte et al., 2011; Beutler et al., 2017; Liu et al., 2012; Mandelblat-Cerf et al., 2015). However, even though AgRP neuronal activity diminishes rapidly after meal initiation, sustained firing of AgRP neurons suggests that these cells are also involved in the homeostatic control of feeding and metabolism (Mandelblat-Cerf et al., 2015). Notably, feeding restricted to either the dark or light cycle modulates metabolic homeostasis (Hatori et al., 2012), potentially related to differential programming in AgRP neurons (Könner et al., 2007). Our present findings also show time-of-day-dependent changes in circadian and synaptic pathways specifically at the level of whole-cell RNA analyses within AgRP neurons. We also find a highly dynamic response to an altered energy state during the transition from states predominated by sleep versus wakefulness (Glock et al., 2017; Liu et al., 2012). Our results indicate the importance of considering not only hormones as being affected by fasting or starvation but they also implicate circadian control of bioenergetics as a potential regulator of neuronal activity in response to an altered nutrient state (Cheng et al., 2012; Dietrich et al., 2013; Liu et al., 2012). How this regulation occurs remains to be explored (Robles et al., 2017), as does whether these ribosome-bound mRNA repertoires exhibit single-cell heterogeneity (Campbell et al., 2017).
Among the neuropeptides acting on AgRP neurons that are dynamically controlled by fasting and feeding, leptin is an adipostatic hormone that exhibits a circadian rhythm (Ahima et al., 1998; Schoeller et al., 1997; Xu et al., 2018). Our combined behavioral and sequencing data together provide further strong evidence that central leptin signaling is circadian in nature (Kettner et al., 2015), being elevated in the morning when animals typically are resting and in a fasted state. Our results further suggest that leptin signaling is modulated by the cell autonomous clock in AgRP neurons, as leptin induces significantly more genes in AgRP neurons of ABKO compared with control mice. Our findings raise the possibility that loss of repressors such as REV-ERB in the ABKO mice contributes to this phenomenon, which has implications for understanding how the cell autonomous clock may determine both gene activation and repression in response to leptin at different times of day. Indeed, the absence of leptin also plays a key role in orchestrating the neuroendocrine response to starvation and food restriction, and our results likewise indicate that clock-orchestrated rhythms in AgRP neurons participate in the stimulation of mitochondrial bioenergetic pathway under such conditions (Ahima, 2008; Chan et al., 2003; Soukas et al., 2000). Notably, diet-induced obese mice retain central leptin signaling (Ottaway et al., 2015), suggesting that transcriptional signatures of increased leptin signaling—e.g., as a result of a disrupted neuronal clock—may underlie disrupted metabolic homeostasis.
The physiological decrease in appetitive drive that we observed during the daytime in mice, which is typical of healthy humans during the nighttime, is strongly suggestive of circadian modulation of feeding centers (Saper et al., 2002; Scheer et al., 2013;Tureketal., 2005). Our genetic BKO model of central clock disruption reveals clock control of feeding and hepatic glucose production, with evidence that the latter is vagally mediated and can be ameliorated by imposing a “corrected” feeding window. This may reduce gluconeogenic efferent signaling emanating from neurons downstream of the SCN, including NPY/AgRP circuits that encompass both MC4R-and leptin-responsive neurons, including those in the dorsomedial, paraventricular, and arcuate hypothalamic nuclei (Garfield et al., 2016; Shi et al., 2017). Our findings suggest that clock expression within AgRP neurons participate in synchronizing hepatic metabolic oscillations with the sleep/wake cycle.
Disruption of the circadian system, as occurs in shiftwork, sleep loss, and night eating, has been implicated in the epidemic rise in obesity and its co-morbidities, including type 2 diabetes mellitus (Bass and Lazar, 2016; Turek et al., 2005). Our present findings of how the central clock regulates feeding time and hepatic glucose production, in parallel with our cell-type-specific analyses of energy-sensing hypothalamic neurons across a variety of diurnally regulated nutrient states, together demonstrate a transcriptional mechanism through which disruption of the neuronal clock leads to metabolic disease. Our concurrent whole-cell and ribosome profiling across multiple time points reveal the potential for expanding our understanding of how divergent transcriptional mechanisms regulate activity-induced signaling in energy-sensing neurons and how phases of sleep versus wakefulness may interlock with and drive states of fasting versus feeding.
Limitations of the Study
AgRP and POMC neurons within the arcuate nucleus promote and suppress appetite, respectively, and have opposing effects on peripheral glucose metabolism and energy expenditure. While a previous study by Henry et al. found that arcuate AgRP, but not POMC, neurons exhibit an enrichment of core clock genes in response to fasting in the afternoon (Henry et al., 2015), future studies will be required to examine the transcriptional changes in POMC neurons across the day and in response to dynamic nutrient challenges and how these modulate the response of AgRP and other downstream energy-sensing neurons. Furthermore, we cannot exclude the possibility of single-cell heterogeneity in the morning versus evening responses of AgRP cells, both at the transcriptional whole-cell and post-transcriptional levels; such heterogeneity may be related to different degrees of expression of key neurotransmitters, such as GABA or glutamate, and their respective receptors. Moreover, the observation of time-of-day differences in RiboTag and whole-cell RNA profiling requires further investigation into the role of circadian translation in the rhythmic control of hunger. Given that AgRP and POMC neurons have also been implicated in hunger-mediated sleep regulation (Goldstein et al., 2018), it will be interesting to untangle the extent to which the sleep/wake state interacts with the hunger state to drive transcriptional and post-transcriptional morning versus evening output in AgRP and POMC neurons. Finally, as AgRP neurons are embedded within a circuit downstream of the master pacemaker neurons, future elucidation of input and output connections linking SCN and AgRP neurons will be necessary to understand how hunger is coordinated with the sleep/wake cycle.
STAR☆METHODS
KEY RESOURCES TABLE
| REAGENT or RESOURCE | SOURCE | IDENTIFIER |
|---|---|---|
| Antibodies | ||
| Goat anti-Rabbit IgG, Alexa Fluor 546 | Thermo Fisher Scientific | Cat #A-11035; RRID: AB_2534093 |
| Rabbit anti Bmal1 (MOP) | Novus Biologicals | Cat #NB100–2288; RRID: AB_10000794 |
| Rabbit anti p-STAT3 | Cell Signaling | Cat #9131; RRID: AB_331586 |
| Chemicals, Peptides, and Recombinant Proteins | ||
| B27 Supplement | Gibco | Cat #17504–001 |
| Deoxy-D-glucose, 2-[1-14C]- | PerkinElmer | Cat #NEC495050UC |
| DL-Dithiothreitol | Millipore-Sigma | Cat #D0632 |
| Glucose, D-[3-3H]- | PerkinElmer | Cat #NET331C005MC |
| Heparin sodium salt | Millipore-Sigma | Cat #H3393–250KU |
| Hibernate™-A Medium | Thermo Fisher Scientific | Cat #A1247501 |
| Hibernate A minus Calcium | BrainBits | Cat #HACA |
| Humulin R (Insulin) | Lilly | Humulin R U-100 |
| ImmPACT DAB peroxidase substrate | Vector laboratories | Cat #SK-4105 |
| L-Glutamine (200 mM) | Thermo Fisher Scientific | Cat #25030081 |
| Pierce Anti-HA Magnetic Beads | Thermo Fisher Scientific | Cat #88836 |
| Recombinant Mouse Leptin (1-mg vials) | National Hormone and Peptide Program | http://www.humc.edu/hormones/ |
| RNAsecure™ RNase Inactivation Reagent | Thermo Fisher Scientific | Cat #AM7005 |
| RNasin Ribonuclease Inhibitors | Promega | Cat #N2515 |
| Sodium deoxycholate | Millipore-Sigma | Cat #D6750–100G |
| Sodium dodecyl sulfate | Millipore-Sigma | Cat #L3771–500G |
| Sodium Pyruvate (for neuronal dissociation) | Thermo Fisher Scientific | Cat #11360070 |
| Sodium Pyruvate (for pyruvate challenge) | Sigma | Cat #P2256–25G |
| TERGITOL solution Type NP-40 | Millipore-Sigma | Cat #NP40S-500ML |
| Tri Reagent | Molecular Research Center | Cat #NC9277980 |
| Trizma hydrochloride solution, pH 7.4, 1 M | Millipore-Sigma | Cat #T2319–1L |
| Critical Commercial Assays | ||
| High-Capacity cDNA Reverse Transcription Kit | Thermo Fisher Scientific | Cat #4368813 |
| Insulin | Thermo Fisher Scientific | KAQ1251 |
| Mouse Leptin ELISA Kit | Crystal Chem | Cat #90030 |
| Nextera Index Kit (96 indexes, 384 samples) | Illumina | Cat #FC-121–1012 |
| Nextera XT DNA Library Preparation Kit | Illumina | Cat #FC-131–1024 |
| NextSeq 500/550 v2 75 cycle high output Kits | Illumina | Cat #FC-404–2005 |
| Papain Dissociation System | Worthington Biochemical Corporation | Cat #LK003153 |
| Precision Xtra Blood Glucose & Ketone Monitoring System | Abbott | Cat #9881465 |
| RNeasy Mini Kit | QIAGEN | Cat #74104 |
| SMART-Seq HT Kit | Takara Bio | Cat #634437 |
| Vectastain Elite ABC Kit | Vector laboratories | Cat #PK-6100 |
| Software and Algorithms | ||
| ClockLab | Actimetrics software | v. 6.0 |
| GraphPad Prism | GraphPad Software | v 7.0, https://www.graphpad.com/scientific-software/prism |
| R software environment v. 3.5.1 | R core team | v. 3.5.1,https://www.r-project.org/ |
| Deposited Data | ||
| RNA-seq data from NPY-hrGFP mice | NCBI GEO | GEO. GSE124693 (at https://www.ncbi.nlm.nih.gov/geo/) |
| Experimental Models | ||
| Agrp-Ires-Cre ftgrptm1(cre)Lowl/J) | The Jackson Laboratory (JAX) | JAX stock #012899 |
| Camk2a ::iCreBAC | Joseph T. Takahashi | B6.FVB-Tg(Camk2a-cre)2Gsc/Cnrm (EM.01153 at EMMA; https.//www.infrafrontier.eu/) |
| C57 Black (C57BL/6J) | The Jackson Laboratory (JAX) | JAX stock #000664 |
| Bmal1fx/fx | Chris Bradfield | MGI.4819968 |
| NPY-hrGFP | The Jackson Laboratory (JAX) | JAX stock #006417 |
CONTACT FOR REAGENT AND RESOURCE SHARING
Further information and request for resources and reagents should be directed to and will be fulfilled by the Lead Contact, Joseph Bass (j-bass@northwestern.edu).
EXPERIMENTAL MODEL AND SUBJECT DETAILS
Mice
Camk2a-iCreBAC transgenic mice (provided by Dr. Joseph Takahashi, University of Texas Southwestern Medical Center) (Casanova et al., 2001; Izumo et al., 2014), AgRP-Ires-Cre (from Jackson Laboratories), and Bmal1fx/fx mice (provided by Dr. Christopher Bradfield, University of Wisconsin) were backcrossed for more than six generations onto the C57BL6/J background, followed by the generation of the cross Camk2a-iCre;;Bmal1fx/fx (BKO mice), and AgRP-Cre;;Bmal1fx/fx (ABKO mice), RiboTag mice (Rpl22tm1.1Psam), enabling Cre-mediated tagging of ribosomes using a hemagglutinin epitope, were obtained from Jackson laboratories. 3–6 month-old male mice were used for all experiments, and all mice were housed at 23–25°C in the Center for Comparative Medicine at Northwestern University and maintained under 12hr light:12hr dark (LD) cycles with ad lib access to regular chow and water unless otherwise indicated. All animal care and use procedures were in accordance with guidelines of the Northwestern University Institutional Animal Care and Use Committee.
METHOD DETAILS
Immunohistochemistry
Camk2a-iCre;;Bmal1fx/fx and control mice were first anesthetized with an intraperitoneal injection of phenobarbital prior to being perfused with ice-cold phosphate-buffered saline (PBS) with heparin (10 U/⎧L), followed by 4% paraformaldehyde in PBS. Brains were then removed and cryoprotected in sucrose (first in 20%, later in 30%) overnight, and sections (25–30 μM thickness) were obtained using a cryostat. Immunostaining was performed with an anti-BMAL1 primary antibody (1:500, Novus Biological) and an Alexa Fluor 546-conjugated secondary antibody (1:500, Life Technologies). For analysis of diurnal leptin signaling in the arcuate nuclei (ARN) of the hypothalamus, immunohistochemistry staining for pSTAT3 were performed as previously reported (Münzberg et al., 2004). Briefly, 30 minutes after injection of either leptin (10 mg/kg) or vehicle (saline) at ZT2 or ZT14, the mice underwent transcardiac perfusion with 4% paraformaldehyde and 25-μm thick sections containing the ARN were collected. Free floating sections were then stained with pSTAT3 (1:4000, Cell Signaling) and nuclei were counter-stained with DAPI. Images were acquired with PictureFrame 1.0 using a Zeiss Axioskop 50. In each animal, three sections with corresponding landmarks from rostral to caudal ARN according to Paxino’s mouse brain atlas were analyzed and all positive nuclei from both sides of the ARN were counted. Investigators were blinded to the genotypes during the data collection. The results were expressed as the total number of pSTAT3 positive nuclei per animal.
Whole-Tissue Collection and Glucose and Metabolic Hormone Measurements
Mediobasal hypothalamus (MBH), liver, and blood samples (for rhythms of metabolic hormones) were collected every 4 h for 24 h, and processed as described below for RNA. Blood samples were kept on ice. Then serum was obtained by centrifugation of blood samples at 2,000 × g for 10 min at 4°C, followed by storage at –80°C until subsequent analysis. Glucose levels were measured every 4 h for 24 h with a hand-held glucometer (Precision Xtra, Abott Diabetes Care), and insulin and leptin levels were determined from collected serum by ELISA (Crystal Chem) according to the manufacturers’ instructions.
Hyperinsulinemic-Euglycemic Clamp Studies
Under isoflurane anesthesia, mice were first inserted with an indwelling catheter in the right internal jugular vein. Following four days of recovery, mice were fasted for 5 h (ZT0–5) prior to receiving a bolus injection of 5 μCi of [3-3H]-glucose, followed by continuous intravenous infusion at 0.05 μCi/min. After 60 min of baseline glucose measurements, a 120-min hyperinsulinemic-euglycemic clamp was performed with continuous insulin infusion at 2.5 mU/kg/min after a 20 mU/kg bolus. Blood glucose was maintained between 120 and 140 mg/dl by infusing 20% glucose at a variable rate during the clamp study. We note that AgRP-Cre mice were not significantly different from control mice (Bmal1fx/fx) in terms of hepatic glucose production during the clamp (p=0.15) or in terms of percent suppression of hepatic glucose production (p=0.36) (data not shown).
Pyruvate Challenge
Pyruvate (2g/kg body weight) was administered intraperitoneally following a 14-h fast at either ZT2 or ZT14. Blood glucose levels from the tail vein were determined at 0,15, 30, 60, 90, and 120 min following pyruvate injection, using a hand-held glucometer (Precision Xtra, Abbott). For dark-only feeding studies, mice were fed exclusively during the dark period for 2 weeks prior to the pyruvate challenge at ZT2.
Refeeding Experiments at Light Onset and Offset
Nine-week old wild-type male C57BL/6J mice (Jackson Laboratories) were individually housed in standard cages, and food was manually removed at ZT12, 24 or 36 h prior to the re-introduction of food at, respectively, either the start of the light/rest (ZT0) or dark/activity (ZT12) periods. Food weights were recorded prior to refeeding, as well as 12 h after refeeding, to calculate food intake during the initial 12 h of refeeding. For refeeding in constant darkness (DD), the animals were first released into DD for at least 36 h. Mice were then fasted at ZT12 for either 36 or 24 h, respectively, prior to assessing the refeeding response at the normal onset of rest (CT0) or activity (CT12). For ZT0/ZT12 refeeding assessment following leptin administration, leptin (10 mg/kg) or vehicle (saline) was injected intraperitoneally immediately prior to initiation of refeeding at ZT0 or ZT12.
Behavioral Analyses and Indirect Calorimetry
Mice were singly housed in combined feeding and activity cages (Phenomaster, TSE Systems or the Promethion system, Sable Systems International), at 23–25°C. After at least three days of acclimation prior to data collection, food intake, RER (VCO2/VO2), and locomotor activity (beam breaks) were continuously monitored throughout the experiment, both at baseline and subsequently during time-restricted feeding (i.e., restricted to feeding at ZT12–24) and during refeeding experiments. Food intake bouts (number and mass per bout in g) in the Promethion system were calculated from the general data processing macro provided by Sable Systems International.
Body Composition Analysis
The percentage of lean and fat mass was analyzed using the EchoMRI-100 for mice and rats (EchoMRI™, Houston, TX).
RNA Extraction and Quantitative Real-Time PCR for Whole-Tissue Analyses
Total RNA was extracted from snap-frozen liver, hypothalamus, white adipose and brown adipose tissue using TRI Reagent (Molecular Research Center). Real-time quantitative PCR was performed and analyzed using Applied Biosystems 7900HT with 1x SYBR green master mix (Applied Biosystems) and 1 μM primers. PCR conditions were 10 min at 95°C, followed by 35 cycles of 10 sec at 95°C and 15 sec at 60°C. Relative mRNA expression levels were normalized to Gapdh or Actb using the comparative CT method.
Hepatic Branch Vagotomy
Animals were provided analgesics (Buprenorphine SR, 1 mg/kg; Meloxicam, 2 mg/kg), and after initiating isoflurane anesthesia and removing the fur, the skin was sterilized, and mice were placed in a sterile surgical field. A laparotomy incision was performed on the ventral midline, followed by a second incision to open the abdominal muscle wall. The gastro-hepatic ligament was severed using fine forceps, followed by gentle retraction of the stomach to reveal the descending ventral esophagus and the ventral subdiaphragmatic trunk of the vagus nerve. The hepatic branch of this vagal trunk was identified as the nerve fiber traversing laterally along the esophago-hepatic ligament. Subsequently, this branch was transected using fine scissors and the abdominal wall was closed in two sequential separate layers.
Fluorescence Assisted Cell Sorting (FACS)-Based Low-Input RNA Capture for cDNA Synthesis for Sequencing
Animals were collected either in the fasted, refed, or adlib condition. Animals were fasted at ZT12 to avoid stress and extended wake-fulness due to daytime cage changes, and also to control for nutrient prehistory. Refed or leptin-injected animals were also fasted at ZT12, but were provided standard chow again or injected with leptin (2 mg/kg) at ZT1 (forZT2 collection) or ZT13 (for ZT14 collection). Adlib-fed animals were maintained under adlib conditions, but similar to fasted animals, the bedding was changed at ZT12 as animal littermates were fasted. We note that our nutrient-controlled fasting paradigm improved detection of morning versus evening differences across transcriptional levels in AgRP neurons compared with when similar analyses were performed in the ad lib state. For example, while ad lib-fed samples from both FACS and RiboTag exhibited changes in core clock genes (e.g. Nr1d1 and Per2) between morning and evening (FDR<0.05), there were otherwise only 27 and 5 genes changed in the whole cell and ribosome-bound transcriptional analyses, respectively (data not shown), suggesting that fasting as a dynamic challenge elicits more pronounced transcriptional differences than the baseline ad lib state. Moreover, an analysis of neuronal cell type purity (compared with other CNScell type-specific markers (Avey et al., 2018; Haimon et al., 2018; Sun et al., 2017; Zhang et al., 2014)) indicated robust selection for AgRP neurons across all samples and experimental paradigms used for FACS and, separately, RiboTag (Figure S3E).
Following the cage change (and removal of food for fasted animals), animals were anesthetized 38 or 26 hours later, respectively, at ZT2 or ZT14, using isoflurane. For FACS, single animal brains were sectioned using a vibratome into coronal 600 μm-thick slices, which continued to be kept in ice-cold hibernate A (HibA) medium with B27 (1x), L-glutamine (1x) and pyruvate (1x) (HBGP solution). The slices were subsequently cut under microscope fluorescence-assisted visualization, dissecting out (~0.50×0.35 mm pieces) that contained just the arcuate nucleus of the hypothalamus (ARH), and avoided the ventro-and dorsomedial hypothalamic nuclei. The dissected tissue pieces were subsequently placed in papain dissolved in HibA without calcium (BrainBits LLC) for dissociation, according to the manufacturer’s instructions (Papain dissociation system). Tissue pieces were dissociated for an optimized minimum period of time to avoid the influence of heat-activated (post-mortem) transcriptional activity: first at 37C for 8 min, followed by 90 s of manual dissociation using a P1000 pipette - thus the dissociation time was less than a third of what is used in many other recent comparable publications. This was followed by a second 8-min round of dissociation at 37°C and 60 s of even gentler manual dissociation (Campbell et al., 2017; Henry et al., 2015). The dissociated cells were subsequently pelleted by centrifugation (300g, 5 min, 4°C), resuspended in a mix of ice-cold HBGP (2.7 mL) with 300 μl ovomucoid albumin inhibitor (OAI; dissolved in HibA) and 150 μl of DNase, and layered onto 5 mL of OAI in HibA, followed by another round of centrifugation. The resuspended pellet was then filtered through a 70 μm filter, and after another centrifugation step (6 min), cells were resuspended in 800 μl of HibA. Prior to FACS, DAPI was added to enable identification of dead cells. The cell suspension was then immediately sorted using a BD Aria 5-laser FACS machine; during the sort the sample was agitated and kept at 4°C. The software settings were set to filter cells through two single cell gates based on forward and side scatter values, followed by a live cell gate using DAPI staining intensity. The final cell filtering was done against GFP signal intensity: only cells that clustered by separate strong GFP signal intensity were sorted into the sample well, as these cells in separate analyses also had higher post-FACS viability when collected in HBGP solution (viability >84% as assessed by trypan blue staining of GFP-positive cells, assessed up to two hours after FACS collection) compared with the less GFP signal-intense, GFP-positive cells (~64% viability) (data not shown). Cells for RNA-seq were sorted by FACS directly into 1 μl 10x reaction buffer (with RNase inhibitor) from the v4 SMART-Seq kit (Clontech Laboratories) mixed with 7.5 μl of water. Following FACS of 300 (range ~100–300) cells per sample, and verification that the sample had been successfully sorted into the well’s buffer solution, the sample was immediately frozen on dry ice.
Isolation of Ribosomally-Bound RNAs from AgRP Neurons for cDNA Synthesis for Sequencing
A homogenization buffer (filtered; 1% sodium deoxycholate, 1% Tergitol (NP-40), 150 mM KCl, 50 mM Tris-HCl (pH 7.4), 1x RNAsecure (Thermo Fisher Scientific), 0.10% sodium dodecyl sulfate, 100 μg/mL Cycloheximide, 5 mM MgCl2; 3 mM Dithiothreitol (DTT), 200 U/mL RNasin® Ribonuclease Inhibitors (Promega), 1 mg/mL Heparin, in RNAse-free water) was prepared within hours of sacrificing AgRP-Cre;;Rpl22tm1.1Psam (AgRP-Cre;;RiboTag) mice according to the feeding and fasting conditions and timepoints described above, for analysis of ribosome-bound mRNAs. For each technical replicate, 3–6 animals were pooled by dissecting out each animal’s hypothalamus (<10 min in total per dissection of each technical replicate). Pooled dissected hypothalami were quickly dounce-homogenized in 1 mL of homogenization buffer. The homogenate was spun thereafter at 16,000 G for 10 min at 4°C. 100 μl of the spun homogenate was saved as input (RNA from whole hypothalamus) by adding it to Buffer RLT (Qiagen; with added beta-mercaptoethanol; RLT-BME). The remaining non-pelleted homogenate was washed and rotated while incubating with anti-HA magnetic beads (pre-washed in homogenization buffer) for 30 min at 4°C. This was followed by another wash of the bead-bound ribosome with homogenization buffer and two washes with a high-salt buffer (50 mM Tris-HCl (pH 7.4), 300 mM KCl, 5 mM MgCl2,1% NP-40,3 mM DTT, 100 μg/mL Cycloheximide, in RNase- and DNase-free water). After removing the high-salt buffer from the second wash, 100 μL of RLT-BME was then added to the beads for final sample elution. The sample was subsequently frozen at −80C until extraction using the RNeasy micro kit (Qiagen). Prior to cDNA library generation, sample RNA quality was assessed using the Agilent 2100 Bioanalyzer (Agilent Technologies). In silico analysis of cell type purity (based on normalized counts for neuronal and other CNS cell type-specific markers) indicated consistent neuron-specific ribosome-bound RNA purity across samples (Figure S3).
cDNA Library Generation, RNA-Sequencing, and Sequencing Analysis
For cDNA library generation for RNA-seq, the v4 SMART-seq chemistry was used according to the manufacturer’s instructions (Clontech laboratories). Once the sample had thawed on ice, additional RNase inhibitor was immediately added prior to subsequent steps. cDNA library fragment size was assessed using the Agilent 2100 Bioanalyzer (Agilent Technologies), and the Nextera XT kit (Illumina) with appropriate Nextera XT indexes were used according to the manufacturer’s instructions to generate cDNA libraries for RNA-seq. Prior to RNA-seq, size distribution and quantity were once more assessed to determine appropriate library pooling using the Bioanalyzer combined with the Qubit fluorometer (Thermo Fisher Scientific). De-multiplexed RNA-seq fastq files were input into STAR for alignment (using GRCm38/mm10), followed byfeatureCounts (from the Subread R package), to count reads of mapped mRNA transcripts. The R package limma was used to query KEGG pathways as specified in the main text; the HOMER perl package (v. 3.12) was used to discover enriched consensus sequences for transcription factors. All RNA-seq data sets have been deposited into NCBI’s GEO with accession number GSE124693.
QUANTITATION AND STATISTICAL ANALYSES
Results are presented as mean ± standard error of the mean (S.E.M.) for all animals included in each analysis. Statistical analyses were carried out using Prism v7.0. Normal distribution was assessed using the Shapiro-Wilk test prior to proceeding with either with the unpaired two-tailed Student’s t-test (or the Mann-Whitney test for non-parameteric data) or two-way analysis of variance (ANOVA) with repeated measures (time of day * genotype) followed by post hoc tests corrected for multiple comparisons (non- parametric repeated measures data was log2-transformed prior to running ANOVAs). P-values below 0.05 were considered to be statistically significant. Custom scripts for the R software environment (v. 3.5.1) were used with packages DeSeq2 (v. 1.20.0), limma (v. 3.36.3), pathview (v. 1.20.0), pheatmap (v. 1.0.10), ggplot2 (v. 2.3.0.0), and biomaRrt (v. 2.36.1) for differential gene expression and pathway analyses. Analysis of cell type purity (compared with other CNS cell type-specific markers (Avey et al., 2018; Haimon et al., 2018; Sun et al., 2017; Zhang et al., 2014)) was done against published FACS- and RiboTag-specific datasets (Figure S3E), using normalized Transcripts Per Kilobase Million (TPM). Statistical parameters can be found in each figure legend.
Supplementary Material
Highlights.
The hypothalamic clock network aligns hunger and metabolism with sleep and wakefulness
The AgRP neuron clock remodels transcription in response to energy state
AgRP RiboTag profiling uncovers post-transcriptional control of bioenergetics
The transcriptional response to leptin requires an intact molecular clock
ACKNOWLEDGMENTS
WethankGrant Barish and members ofthe Bass laboratoryfor helpful discussions and Mia Andreoli, Varun Mehta, Celestine He, Paul Brandfonbrener, and Weimin Song for technical assistance. This research was supported by the National Institute of Diabetes and Digestive and Kidney Diseases (NIDDK) grants R01DK090625, R01DK113011, R01DK100814, and P01DK049210; the National Institute on Aging grant P01AG011412; the National Institute of Mental Health grant R01MH110556; the Chicago Biomedical Consortium S-007; the University ofChicago Diabetes Research and Training Centergrant P60DK020595 (J.B.); the NIDDK award K01DK105137–02 (C.B.P.); the Swedish Research Council grant 2014–6888 (J.C.); and the Swedish Society for Medical Research (J.C.). Research by J.C. is also supported by the Swedish Brain Foundation. This research was also supported by the Northwestern University RHLCCC Flow Cytometry Facility and a Cancer Center Support Grant (NCI CA060553).
Footnotes
AUTHOR CONTRIBUTIONS
Conceptualization, J.C., W.H., K.M.R., and J.B.; Formal Analysis, J.C., W.H., and N.W.; Investigation, J.C., W.H., N.W., D.C.L., C.B.P., C.O., L.C., Y.K., R.D., and M.M.; Resources, C.A.B, X.A.W., and J.S.T.; Writing, J.C., W.H., K.M.R., and J.B.; Visualization, B.M.; Supervision, J.C., W.H., R.A., and J.B.; Funding Acquisition, J.C., C.B.P., and J.B.
DECLARATION OF INTERESTS
The authors declare no competing interests.
SUPPLEMENTAL INFORMATION
Supplemental Information includes four figures and four tables and can be found with this article online at https://doi.org/10.1016/j-cmet.2019.01.023.
REFERENCES
- Abramovitz L, Shapira T, Ben-Dror I, Dror V, Granot L, Rousso T, Landoy E, Blau L, Thiel G, and Vardimon L (2008). Dual role of NRSF/ REST in activation and repression of the glucocorticoid response. J. Biol. Chem. 283, 110–119. [DOI] [PubMed] [Google Scholar]
- Ahima RS (2008). Revisiting leptin’s role in obesity and weight loss. J. Clin. Invest. 118, 2380–2383. [DOI] [PMC free article] [PubMed] [Google Scholar]
- Ahima RS, Prabakaran D, and Flier JS (1998). Postnatal leptin surge and regulation of circadian rhythm of leptin by feeding. Implicationsfor energy homeostasis and neuroendocrine function. J. Clin. Invest. 101, 1020–1027. [DOI] [PMC free article] [PubMed] [Google Scholar]
- Allison MB, Pan W, MacKenzie A, Patterson C, Shah K, Barnes T, Cheng W, Rupp A, Olson DP, and Myers MG Jr. (2018). Defining the transcriptional targets of leptin reveals a role for Atf3 in leptin action. Diabetes 67, 1093–1104. [DOI] [PMC free article] [PubMed] [Google Scholar]
- Anacker C, Cattaneo A, Musaelyan K, Zunszain PA, Horowitz M, Molteni R, Luoni A, Calabrese F, Tansey K, Gennarelli M, et al. (2013). Role for the kinase SGK1 in stress, depression, and glucocorticoid effects on hippocampal neurogenesis. Proc. Natl. Acad. Sci. USA 110, 8708–8713. [DOI] [PMC free article] [PubMed] [Google Scholar]
- Andermann ML, and Lowell BB (2017). Toward a wiring diagram understanding of appetite control. Neuron 95, 757–778. [DOI] [PMC free article] [PubMed] [Google Scholar]
- Aponte Y, Atasoy D, and Sternson SM (2011).AGRP neuronsaresufficient to orchestratefeeding behavior rapidly and withouttraining. Nat. Neurosci. 14, 351–355. [DOI] [PMC free article] [PubMed] [Google Scholar]
- Arble DM, Bass J, Laposky AD, Vitaterna MH, and Turek FW (2009). Circadian timing of food intake contributes to weight gain. Obesity (Silver Spring) 17,2100–2102. [DOI] [PMC free article] [PubMed] [Google Scholar]
- Avey D, Sankararaman S, Yim AKY, Barve R, Milbrandt J, and Mitra RD (2018). Single-cell RNA-seq uncovers a robust transcriptional response to morphine by glia. Cell Rep. 24, 3619–3629.e4. [DOI] [PMC free article] [PubMed] [Google Scholar]
- Bass J, and Lazar MA (2016). Circadian time signatures of fitness and disease. Science 354, 994–999. [DOI] [PubMed] [Google Scholar]
- Beutler LR, Chen Y, Ahn JS, Lin YC, Essner RA, and Knight ZA(2017). Dynamics of gut-brain communication underlying hunger. Neuron 96, 461–475.e5. [DOI] [PMC free article] [PubMed] [Google Scholar]
- Buettner C, Pocai A, Muse ED, Etgen AM, Myers MG Jr., and Rossetti L (2006). Critical role of STAT3 in leptin’s metabolic actions. Cell Metab. 4, 49–60. [DOI] [PMC free article] [PubMed] [Google Scholar]
- Burnett LC, LeDuc CA, Sulsona CR, Paull D, Rausch R, Eddiry S, Carli JF, Morabito MV, Skowronski AA, Hubner G, et al. (2017).Deficiency in prohormone convertase PC1 impairs prohormone processing in Prader-Willi syndrome. J. Clin. Invest. 727, 293–305. [DOI] [PMC free article] [PubMed] [Google Scholar]
- Campbell JN, Macosko EZ, Fenselau H, Pers TH, Lyubetskaya A, Tenen D, Goldman M, Verstegen AM, Resch JM, McCarroll SA, et al. (2017). A molecular census of arcuate hypothalamus and median eminence cell types. Nat. Neurosci. 20, 484–496. [DOI] [PMC free article] [PubMed] [Google Scholar]
- Casanova E, Fehsenfeld S, Mantamadiotis T, Lemberger T, Greiner E, Stewart AF, and Schütz G (2001). A CamKIIalpha iCre BAC allows brain-specific gene inactivation. Genesis 31, 37–42. [DOI] [PubMed] [Google Scholar]
- Chan JL, Heist K, DePaoli AM, Veldhuis JD, and Mantzoros CS (2003). The role of falling leptin levels in the neuroendocrine and metabolic adaptation to short-term starvation in healthy men. J. Clin. Invest. 777, 1409–1421. [DOI] [PMC free article] [PubMed] [Google Scholar]
- Cheng A, Wan R, Yang JL, Kamimura N, Son TG, Ouyang X, Luo Y, Okun E, and Mattson MP (2012). Involvement of PGC-1alpha in the formation and maintenance of neuronal dendritic spines. Nat. Commun. 3, 1250. [DOI] [PMC free article] [PubMed] [Google Scholar]
- Chou TC, Scammell TE, Gooley JJ, Gaus SE, Saper CB, and Lu J (2003). Critical role of dorsomedial hypothalamic nucleus in a wide range of behavioral circadian rhythms. J. Neurosci. 23, 10691–10702. [DOI] [PMC free article] [PubMed] [Google Scholar]
- Dietrich MO, Liu ZW, and Horvath TL (2013). Mitochondrial dynamics controlled by mitofusins regulate Agrp neuronal activity and diet-induced obesity. Cell 755, 188–199. [DOI] [PMC free article] [PubMed] [Google Scholar]
- Epping MT, Lunardi A, Nachmani D, Castillo-Martin M, Thin TH, Cordon-Cardo C, and Pandolfi PP (2015). TSPYL2 is an essential component of the REST/NRSF transcriptional complex for TGFbeta signaling activation. Cell Death Differ. 22, 1353–1362. [DOI] [PMC free article] [PubMed] [Google Scholar]
- Garfield AS, Shah BP, Burgess CR, Li MM, Li C, Steger JS, Madara JC, Campbell JN, Kroeger D, Scammell TE, et al. (2016). Dynamic GABAergic afferent modulation of AgRP neurons. Nat. Neurosci. 79, 1628–1635. [DOI] [PMC free article] [PubMed] [Google Scholar]
- Glock C, Heumüller M, and Schuman EM (2017). mRNAtransport & local translation in neurons. Curr. Opin. Neurobiol. 45, 169–177. [DOI] [PubMed] [Google Scholar]
- Goldstein N, Levine BJ, Loy KA, Duke WL, Meyerson OS, Jamnik AA, and Carter ME (2018). Hypothalamic neurons that regulate feeding can influence sleep/wake states based on homeostatic need. Curr. Biol. 28, 3736–3747.e3. [DOI] [PMC free article] [PubMed] [Google Scholar]
- Guan D, Xiong Y, Borck PC, Jang C, Doulias PT, Papazyan R, Fang B, Jiang C, Zhang Y, Briggs ER, et al. (2018). Diet-induced circadian enhancer remodeling synchronizes opposing hepatic lipid metabolic processes. Cell 774, 831–842.e12. [DOI] [PMC free article] [PubMed] [Google Scholar]
- Haimon Z, Volaski A, Orthgiess J, Boura-Halfon S, Varol D, Shemer A, Yona S, Zuckerman B, David E, Chappell-Maor L, et al. (2018). Re-evaluating microglia expression profiles using RiboTag and cell isolation strategies. Nat. Immunol. 79, 636–644. [DOI] [PMC free article] [PubMed] [Google Scholar]
- Hatori M, Vollmers C, Zarrinpar A, DiTacchio L, Bushong EA, Gill S, Leblanc M, Chaix A, Joens M, Fitzpatrick JA, et al. (2012). Time-restricted feeding without reducing caloric intake prevents metabolic diseases in mice fed a high-fat diet. Cell Metab. 75, 848–860. [DOI] [PMC free article] [PubMed] [Google Scholar]
- Heisler LK, Jobst EE, Sutton GM, Zhou L, Borok E, Thornton-Jones Z, Liu HY, Zigman JM, Balthasar N, Kishi T, et al. (2006). Serotonin reciprocally regulates melanocortin neurons to modulate food intake. Neuron 57, 239–249. [DOI] [PubMed] [Google Scholar]
- Henry FE, Sugino K, Tozer A, Branco T, and Sternson SM (2015). Cell type-specific transcriptomics of hypothalamic energy-sensing neuron responses to weight-loss. Elife 4. [DOI] [PMC free article] [PubMed] [Google Scholar]
- Herzog ED,Takahashi JS, and Block GD (1998). Clock controls circadian period in isolated suprachiasmatic nucleus neurons. Nat. Neurosci. 7, 708–713. [DOI] [PubMed] [Google Scholar]
- Izumo M, Pejchal M, Schook AC, Lange RP, Walisser JA, Sato TR, Wang X, Bradfield CA, and Takahashi JS (2014). Differential effects of light and feeding on circadian organization of peripheral clocks in a forebrain Bmal1 mutant. Elife 3. [DOI] [PMC free article] [PubMed] [Google Scholar]
- Jouffe C, Cretenet G, Symul L, Martin E, Atger F, Naef F, and Gachon F (2013). The circadian clock coordinates ribosome biogenesis. PLoS Biol. 11, e1001455. [DOI] [PMC free article] [PubMed] [Google Scholar]
- Kettner NM, Mayo SA, Hua J, Lee C, Moore DD, and Fu L (2015). Circadian dysfunction induces leptin resistance in mice. Cell Metab. 22, 448–459. [DOI] [PMC free article] [PubMed] [Google Scholar]
- Kim KW, Zhao L, Donato J Jr., Kohno D, Xu Y, Elias CF, Lee C, Parker KL, and Elmquist JK (2011). Steroidogenic factor 1 directs programs regulating diet-induced thermogenesis and leptin action in the ventral medial hypothalamic nucleus. Proc. Natl. Acad. Sci. USA 108, 10673–10678. [DOI] [PMC free article] [PubMed] [Google Scholar]
- Knight ZA, Tan K, Birsoy K, Schmidt S, Garrison JL, Wysocki RW, Emiliano A, Ekstrand MI, and Friedman JM (2012). Molecular profiling of activated neurons by phosphorylated ribosome capture. Cell 151, 1126–1137. [DOI] [PMC free article] [PubMed] [Google Scholar]
- Kohsaka A, Laposky AD, Ramsey KM, Estrada C, Joshu C, Kobayashi Y, Turek FW, and Bass J (2007). High-fat diet disrupts behavioral and molecular circadian rhythms in mice. Cell Metab. 6, 414–421. [DOI] [PubMed] [Google Scholar]
- Könner AC, Janoschek R, Plum L, Jordan SD, Rother E, Ma X, Xu C, Enriori P, Hampel B, Barsh GS, et al. (2007). Insulin action in AgRP-expressing neurons is required for suppression of hepatic glucose production. Cell Metab. 5, 438–449. [DOI] [PubMed] [Google Scholar]
- Krashes MJ, Shah BP, Koda S, and Lowell BB (2013). Rapid versus delayed stimulation of feeding by the endogenously released AgRP neuron mediators GABA, NPY, and AgRP. Cell Metab. 18, 588–595. [DOI] [PMC free article] [PubMed] [Google Scholar]
- Kroeger D, Absi G, Gagliardi C, Bandaru SS, Madara JC, Ferrari LL, Arrigoni E, Münzberg H, Scammell TE, Saper CB, et al. (2018). Galanin neurons in theventrolateral preoptic area promote sleep and heat loss in mice. Nat. Commun. 9, 4129. [DOI] [PMC free article] [PubMed] [Google Scholar]
- Liu T, Kong D, Shah BP, Ye C, Koda S, Saunders A, Ding JB, Yang Z, Sabatini BL, and Lowell BB (2012). Fasting activation ofAgRP neurons requires NMDA receptors and involves spinogenesis and increased excitatory tone. Neuron 73, 511–522. [DOI] [PMC free article] [PubMed] [Google Scholar]
- Mandelblat-Cerf Y, Ramesh RN, Burgess CR, Patella P, Yang Z, Lowell BB, and Andermann ML (2015). Arcuate hypothalamic AgRP and putative POMC neurons show opposite changes in spiking across multiple timescales. Elife 4. [DOI] [PMC free article] [PubMed] [Google Scholar]
- Marcheva B, Ramsey KM, Buhr ED, Kobayashi Y, Su H, Ko CH, Ivanova G, Omura C, Mo S, Vitaterna MH, et al. (2010). Disruption of the clock components CLOCK and BMAL1 leads to hypoinsulinaemia and diabetes. Nature 466, 627–631. [DOI] [PMC free article] [PubMed] [Google Scholar]
- Maywood ES, O’Brien JA, and Hastings MH (2003). Expression of mCLOCK and other circadian clock-relevant proteins in the mouse suprachi- asmatic nuclei. J. Neuroendocrinol. 15, 329–334. [DOI] [PubMed] [Google Scholar]
- McGlincy NJ, Valomon A, Chesham JE, Maywood ES, Hastings MH, and Ule J (2012). Regulation ofalternative splicing bythe circadian clock and food related cues. Genome Biol. 13, R54. [DOI] [PMC free article] [PubMed] [Google Scholar]
- Morris ME, Viswanathan N, Kuhlman S, Davis FC, and Weitz CJ (1998). A screen for genes induced in the suprachiasmatic nucleus by light. Science 279, 1544–1547. [DOI] [PubMed] [Google Scholar]
- Münzberg H, Flier JS, and Bjørbaek C (2004). Region-specific leptin resistance within the hypothalamus of diet-induced obese mice. Endocrinology 145, 4880–889. [DOI] [PubMed] [Google Scholar]
- Ottaway N, Mahbod P, Rivero B, Norman LA, Gertler A, D’Alessio DA, and Perez-Tilve D (2015). Diet-induced obese mice retain endogenous leptin action. Cell Metab. 21, 877–882. [DOI] [PMC free article] [PubMed] [Google Scholar]
- Perelis M, Marcheva B, Ramsey KM, Schipma MJ, Hutchison AL, Taguchi A, Peek CB, Hong H, Huang W, Omura C, et al. (2015). Pancreatic beta cell enhancers regulate rhythmic transcription of genes controlling insulin secretion. Science 350, aac4250. [DOI] [PMC free article] [PubMed] [Google Scholar]
- Pinto S, Roseberry AG, Liu H, Diano S, Shanabrough M, Cai X, Friedman JM, and Horvath TL (2004). Rapid rewiring of arcuate nucleus feeding circuits by leptin. Science 304, 110–115. [DOI] [PubMed] [Google Scholar]
- Pocai A, Lam TK, Gutierrez-Juarez R, Obici S, Schwartz GJ, Bryan J, Aguilar-Bryan L, and Rossetti L (2005). Hypothalamic K(ATP) channels control hepatic glucose production. Nature 434, 1026–1031. [DOI] [PubMed] [Google Scholar]
- Robles MS, Humphrey SJ, and Mann M (2017). Phosphorylation is a central mechanism for circadian control of metabolism and physiology. Cell Metab. 25, 118–127. [DOI] [PubMed] [Google Scholar]
- Rossi J, Balthasar N, Olson D, Scott M, Berglund E, Lee CE, Choi MJ, Lauzon D, Lowell BB, and Elmquist JK (2011). Melanocortin-4 receptors expressed by cholinergic neurons regulate energy balance and glucose homeostasis. Cell Metab. 13, 195–204. [DOI] [PMC free article] [PubMed] [Google Scholar]
- Saini C, Liani A, Curie T, Gos P, Kreppel F, Emmenegger Y, Bonacina L, Wolf JP, Poget YA, Franken P, et al. (2013). Real-time recording of circadian liver gene expression in freely moving mice revealsthe phase-setting behavior of hepatocyte clocks. Genes Dev. 27, 1526–1536. [DOI] [PMC free article] [PubMed] [Google Scholar]
- Sanz E, Yang L, Su T, Morris DR, McKnight GS, and Amieux PS (2009). Cell-type-specific isolation of ribosome-associated mRNA from complex tissues. Proc. Natl. Acad. Sci. USA 106, 13939–13944. [DOI] [PMC free article] [PubMed] [Google Scholar]
- Saper CB, Chou TC, and Elmquist JK (2002). The need to feed: homeostatic and hedonic control of eating. Neuron 36, 199–211. [DOI] [PubMed] [Google Scholar]
- Scheer FA, Morris CJ, and Shea SA (2013). The internal circadian clock increases hunger and appetite in the evening independent of food intake and other behaviors. Obesity (Silver Spring) 21, 421–423. [DOI] [PMC free article] [PubMed] [Google Scholar]
- Schoeller DA, Cella LK, Sinha MK, and Caro JF (1997). Entrainment of the diurnal rhythm of plasma leptin to meal timing. J. Clin. Invest. 100, 1882–1887. [DOI] [PMC free article] [PubMed] [Google Scholar]
- Shi Z, Madden CJ, and Brooks VL (2017). Arcuate neuropeptide Yinhibits sympathetic nerve activity via multiple neuropathways. J. Clin. Invest. 127, 2868–2880. [DOI] [PMC free article] [PubMed] [Google Scholar]
- Shigeoka T, Jung H, Jung J, Turner-Bridger B, Ohk J, Lin JQ, Amieux PS, and Holt CE (2016). Dynamic axonal translation in developing and mature visual circuits. Cell 166, 181–192. [DOI] [PMC free article] [PubMed] [Google Scholar]
- Silver R, LeSauter J, Tresco PA, and Lehman MN (1996). A diffusible coupling signal from the transplanted suprachiasmatic nucleus controlling circadian locomotor rhythms. Nature 382, 810–813. [DOI] [PubMed] [Google Scholar]
- Sinturel F, Gerber A, Mauvoisin D, Wang J, Gatfield D, Stubblefield JJ, Green CB, Gachon F, and Schibler U (2017). Diurnal oscillations in liver mass and cell size accompany ribosome assembly cycles. Cell 169, 651–663.e14. [DOI] [PMC free article] [PubMed] [Google Scholar]
- Soukas A, Cohen P, Socci ND, and Friedman JM (2000). Leptin-specific patterns of gene expression in white adipose tissue. Genes Dev. 14, 963–980. [PMC free article] [PubMed] [Google Scholar]
- Stijnen P, Ramos-Molina B, O’Rahilly S, and Creemers JW (2016). PCSK1 mutations and human endocrinopathies: from obesity to gastrointestinal disorders. Endocr. Rev. 37, 347–371. [DOI] [PubMed] [Google Scholar]
- Sun W, Cornwell A, Li J, Peng S, Osorio MJ, Aalling N, Wang S, Benraiss A, Lou N, Goldman SA, et al. (2017). SOX9 is an astrocyte-specific nuclear marker in the adult brain outside the neurogenic regions. J. Neurosci. 37, 4493–4507. [DOI] [PMC free article] [PubMed] [Google Scholar]
- Takahashi JS (2017). Transcriptional architecture of the mammalian circadian clock. Nat. Rev. Genet. 18, 164–179. [DOI] [PMC free article] [PubMed] [Google Scholar]
- Turek FW, Joshu C, Kohsaka A, Lin E, Ivanova G, McDearmon E, Laposky A, Losee-Olson S, Easton A, Jensen DR, et al. (2005). Obesity and metabolic syndrome in circadian Clock mutant mice. Science 308, 1043–1045. [DOI] [PMC free article] [PubMed] [Google Scholar]
- van den Pol AN, Yao Y, Fu LY, Foo K, Huang H, Coppari R, Lowell BB, and Broberger C (2009). Neuromedin B and gastrin-releasing peptide excite arcuate nucleus neuropeptide Y neurons in a novel transgenic mouse expressing strong Renilla green fluorescent protein in NPY neurons. J. Neurosci. 29, 4622–4639. [DOI] [PMC free article] [PubMed] [Google Scholar]
- Wu Q, Boyle MP, and Palmiter RD (2009). LossofGABAergic signaling by AgRP neurons to the parabrachial nucleus leads to starvation. Cell 137, 1225–1234. [DOI] [PMC free article] [PubMed] [Google Scholar]
- Xu J, Bartolome CL, Low CS, Yi X, Chien CH, Wang P, and Kong D(2018). Genetic identification of leptin neural circuits in energy and glucose homeostases. Nature 556, 505–509. [DOI] [PMC free article] [PubMed] [Google Scholar]
- Zhang Y, Chen K, Sloan SA, Bennett ML, Scholze AR, O’Keeffe S, Phatnani HP, Guarnieri P, Caneda C, Ruderisch N, et al. (2014). An RNA-sequencing transcriptome and splicing database of glia, neurons, and vascular cells of the cerebral cortex. J. Neurosci. 34, 11929–11947. [DOI] [PMC free article] [PubMed] [Google Scholar]
Associated Data
This section collects any data citations, data availability statements, or supplementary materials included in this article.