

Abstract
Objectives:
In patients with non-ischemic dilated cardiomyopathy (NIDCM), native T1, partition coefficient (λGd), and extracellular volume fraction (ECV) mapping may offer prognostic values beyond late gadolinium enhancement (LGE), by scaling the range of myocardial changes.
Background:
In patients with NIDCM, LGE is seen in 30% of patients and it indicates adverse prognosis.
Methods:
We mapped 6 anatomical locations using all 4 CMR tissue characterizing methods and associated with outcome. We performed T1 mapping of the myocardium and the blood pool, before and serially after contrast injection, using a look-locker cine gradient-echo technique to obtain T1 and the corresponding reciprocal R1 values. λGd values were derived from the slopes of the least-squares regression lines for myocardial versus blood R1, then adjusted to serum hematocrit to yield ECV.
Results:
Consecutive 240 NIDCM patients (49±16years; 38%female) underwent CMR for cardiac function, LGE, native T1, λGd, and ECV. After a median of 3.8 years, 36 (15%) experienced adverse events (MACE) including 22 heart failure hospitalizations and 14 deaths. Non-ischemic LGE was detected in 34% whereas ECV was elevated (≥1 location) in 58%. Comparing the 4 methods, mean ECV and λGd both demonstrated strong association with MACE (both p<0.001). In contrast to native T1 and LGE, ECV values from all 6 locations were associated with MACE and death, with the anteroseptum being the most significant (p<0.0001). The number of abnormal ECV locations correlated linearly with annual MACE rates (p=0.0003). Mean ECV (%) was the only predictor to enter a prognostic model that contained age, gender, NYHA, and LVEF. For every 10% increase, mean ECV portended to a 2.8-fold adjusted increase risk to MACE (p<0.001).
Conclusions:
In this study of patients with NIDCM, mapping the myocardial extent of abnormality using ECV offers prognostication towards heart failure outcomes incremental to LGE or native T1 mapping.
Keywords: ECV, native T1, NIDCM, Dilated Cardiomyopathy, Partition Coefficient
Introduction
Risk stratification of patients with non-ischemic dilated cardiomyopathy (NIDCM) relies primarily on left ventricular ejection fraction (LVEF) and it inadequately reflects myocardial pathophysiology. Patients with NIDCM at risk of heart failure decompensation may benefit from novel noninvasive risk stratification.(1) Diffuse fibrosis plays a key role altering mechanical, electrical and vasomotor functions in this condition.(2) Prior work had shown that mid-wall fibrosis detected on late gadolinium enhancement (LGE) by cardiac magnetic resonance (CMR) imaging is detected in approximately one third of NIDCM patients and it had strong association with patient mortality.(3) However, LGE imaging does not capture the full spectrum of diffuse fibrosis in NIDCM. Newer noninvasive imaging techniques, namely serial T1 mapping imaging characterizing extracellular volume fraction (ECV) has been validated against diffuse interstitial fibrosis by histology in NIDCM.(4,5) Previous studies (6,7) have demonstrated a correlation between ECV and cardiac events in general patient cohort but the prognostic value of ECV and measurement of the partition coefficient (λGd) in a consecutive cohort of patients with NIDCM remains limited. In addition, left ventricular (LV) myocardial anatomical location patterns of high risk of these respective methods had not been systemically compared. In the current study, we first tested the hypothesis that various CMR tissue characterization methods, namely LGE, native T1 mapping, λGd, and ECV, provide different strengths of prognostic association with major adverse cardiovascular events (MACE) in patients with NIDCM. In addition, we compared the strengths of prognostic association from 6 LV anatomical locations (anterior, anteroseptal, inferoseptal, inferior, inferolateral, and anterolateral) of abnormal tissue characteristics across these 4 methods, with MACE.
Methods
Study population
Subjects were enrolled at our center between January 2009 and December 2015. The study cohort included consecutive patients who fulfilled all of the following inclusion criteria: a) CMR referral primarily for assessing for etiology of cardiomyopathy, b) symptoms or signs consistent of heart failure as identified by the referring physician, c) LVEF < 60%, and d) left ventricular end-diastolic volume index (LVEDVi) > 80 ml/m2. Exclusion criteria included any of the following: a) any medical documentation of coronary artery disease (by angiography or history) including imaging evidence of myocardial infarction or ischemia, b) any history or imaging evidence of cardiac amyloidosis, cardiac sarcoidosis, hypertrophic cardiomyopathy, and Chagas disease, c) moderate to severe valvulopathy, and d) any absolute contraindications to performing a CMR.
CMR Imaging Protocol and Post-processing
A 3T CMR system (Siemens Tim Trio, Erlangen, Germany) was used for imaging of all subjects. The CMR protocol consisted of cine steady-state free precession (SSFP) imaging (TR 3.4 ms; TE 1.2 ms; in-plane spatial resolution 1.6 × 2 mm) for left ventricle (LV) function and mass, LGE and serial T1 mapping. Cine imaging was obtained in 8 to 14 matching short-axis (8 mm thick with no gap) and 3 radial long-axis planes. LGE imaging (TR 4.8 ms; TE 1.3 ms; inversion time 200 to 300 ms) was performed to detect focal myocardial scars, using a segmented inversion-recovery pulse sequence starting 10 to 15 min after a weight-based injection (cumulative dose 0.15 mmol/Kg) of gadolinium diethylenetriamine pentaacetic acid (Magnevist, Bayer HealthCare Pharmaceuticals Inc., Wayne, New Jersey). In patients with eGFR <60 (mL/min/1.73m2), contrast dose was restricted to 0.1 mmol/kg or 20 ml, whichever lower in volume based on our institutional policy.(8) T1 measurements were acquired in a 3 LV short-axis cuts covering the 18-segment model using a validated cine Look-Locker sequence, (5,9) with a non-slice-selective adiabatic inversion pulse, followed by segmented gradient-echo acquisition for 17 cardiac phases/times after inversion (TE 2.5 ms; TR 5.5 ms; flip angle = 10°; 192 × 128 matrix; 6 mm slice), spread over 2 cardiac cycles (TI increments for T1 measurements of 100 ms pre-contrast, and 55 ms post-contrast, slice thickness 8 mm, temporal resolution > RR intervals pre-contrast and 3 RR intervals post-contrast). T1 mapping imaging was acquired once before and 3 times after the injection of gadolinium spanning across a post-contrast period of approximately 30 minutes, in order to reduce the variance of the mean ECV values.(9) A commercially available software (MASS v15, 2008, Medis, Leiden, The Netherlands) was used to post-process and quantify all CMR images. Epicardial and endocardial contours were placed manually on all LGE images, then LGE mass (in grams) was quantified by using signal intensity threshold cutoff of 2, 3, 4 and 6-standard deviations above the mean intensity of remote myocardium in the same slice.
Native T1, λGd, and ECV Measurements
Figure 1 demonstrates the method of native T1, λGd, and ECV measurements. Endo- and epicardial borders of the LV of all T1 mapping images were traced with care to exclude any epicardial fat and endocardial blood. For each of LGE, native T1, λGd, and ECV, the 18 myocardial segments from 3 short-axis cuts were grouped and averaged into 6 anatomical locations (anterior, anteroseptal, inferoseptal, inferior, inferolateral, and anterolateral) for purpose of comparison across these methods. Using commercial available software (QMASS MR, Leiden, the Netherlands), signal intensity versus time curves were generated from regions of interest in the LV and blood pool. The signal intensity versus time curves for each myocardial segments and the blood pool were used for fitting to an analytical expression for the inversion recovery to obtain T1*, and correction for the effects of radiofrequency pulse during inversion recovery to calculate T1. The reproducibility of native T1 was tested and resulted in an intraclass coefficient for the intra-observer T1 measurement of 0.979 (n=20, 95% CI, 0.945-0.992). Septal vs. lateral wall mean native T1 values of the whole cohort were significant different (1102±134 vs. 1080±136, p<0.0001). The reciprocal of T1 (R1=1/T1) was used to plot the myocardial R1 against the R1 in the blood pool. Subsequently, the slope of least-squares regression line for R1 in tissue versus R1 in blood (limited data points with R1 in blood less than 3.5 s−1) was used to estimate λGd. This represents an extension of the formula: λGd = (1/T1Myo Post − 1/T1Myo Pre) / (1/T1Blood Post − 1/T1Blood Pre). λGd was then multiplied by blood plasma fraction (1 minus the hematocrit expressed as value between 0 and 1), to obtain anatomical location myocardial ECV. The global mean ECV was calculated by averaging the ECV values across all segments. Hematocrit was derived from routine blood laboratory testing within 60 days to the CMR examination without any interval clinical event. The native T1 normal values were derived from a group of healthy volunteers who underwent research 3T CMR studies at our center. The normal mean native T1 was 947.5 ± 62.1 ms. A cut-off of 1072 ms (2 standard deviations) was used for a normal T1 value. Further, the normal reference value of ECV was reported to be 28±3% and we defined abnormal elevation of ECV by a 2SD cutoff of >34%.(9) The observers who performed the CMR analyses of LGE and T1 mapping were blinded to the clinical parameters, clinical outcome, and other CMR variables such as LV size and function.
Figure 1. Image Processing of Look-Locker T1 Imaging.

Look-Locker T1 imaging using a low flip-angle segmented gradient echo pulse sequence (flip=10°, TR/TE=5.5/2.8 ms). Images for a total of 17 times after inversion (TI) were acquired and every second one is displayed in this montage (a). Three short-axis cuts were imaged for 1 pre- and 3 post-contrast T1 measurements. Bullseye view representing color-encoded T1 values for mid ring locations by Look-Locker imaging as shown in (b). The average signal intensity for each of the 18 segments was used, with IR phase restoration, for fitting to a parametrized representation of the inversion recovery, A + B∙exp(−TI/T1*), where A, B, and T1* are adjustable parameters, and TI the time after application of the adiabatic inversion pulse. T1 was calculated from A, B, and T1 * to correct for radio-frequency pulse effects during the Look-Locker read-outs. The data and best fit IR curve are shown in magnitude mode (c). A total of four T1 measurements were used for estimation of ECV by least-squares linear regression (d). ECV corresponds to the slope of the regression line, multiplied by (1-hematocrit). ECV values estimated as shown in (e) are color-encoded and displayed in the 6 anatomical locations.
Follow-up of Clinical Endpoints
Clinical events of all subjects were assessed by review of the Social Security Death Index of the United States, then followed by a detailed review of all available electronic medical records. When electronic medical record were insufficient, subjects were evaluated by a standardized checklist-based patient questionnaire by mail and/or a scripted telephone interview based on the same standardized checklist. An informed consent was sent to subjects before initiation of any telephone contact. We defined MACE based on first heart failure related outcomes: a) death from any cause or b) heart failure decompensation requiring hospitalization. Heart failure hospitalization was defined, in accord with prior trials,(10,11) when all of the following criteria were met: a) worsening of heart failure signs/symptoms with at least one of: dyspnea on exertion, orthopnea, nocturnal dyspnea, pulmonary edema, increasing peripheral edema, increasing fatigue or decreasing exercise tolerance, raised jugular venous pressure, and radiological signs of heart failure, b) inpatient hospitalization, and c) any addition or increase of any heart failure intravenous treatments including diuretics, inotropes, or afterload-reducing vasodilator drugs.(12) All study procedures were reviewed and approved by our Institutional Review Board in accordance with institutional guidelines.
Statistical Analysis
Continuous variables were compared by T-tests or Wilcoxcon rank-sum tests as appropriate whereas categorical variables by the Fisher exact test. A two-sided p-value of <0.05 was used. Univariable and multivariable associations of risk covariates with clinical events were determined by Cox proportional hazards regression with time to event measured from the day of CMR. Survival curves were displayed using Kaplan-Meier estimates. Event rates were compared using Chi-Squared or Cochran-Armitage Trend tests as appropriate. We performed 3 multivariable models by inclusion of key risk variables including patient age, NYHA class, and LVEF, and each of mean T1, LGE presence, and LGE mass. Mean ECV was then added to each model to determine the incremental prognostic value of mean ECV. Proportional hazards assumption of each covariate was assessed by visualization of a log-log plot then tested by including an interaction term of the covariate with time. SAS was used for all statistical analysis (version 9.4, SAS Institute Inc., Cary).
Results
Patient Demographics and CMR Characteristics
The study included 289 consecutive patient subjects. Ten subjects were excluded due to imaging failure: breath-holding problem (N=3), failure in cardiac gating (N=4), and severe imaging artifacts (N=3). Another 39 subjects were excluded due to CMR findings of a myocardial infarction (N=25), cardiac amyloidosis (N=8), or hypertrophic cardiomyopathy (N=6).The remaining 240 subjects formed the study cohort. Baseline characteristics are summarized in Table 1. Mean age of the cohort was 49±16 years and 62% of subjects were men. Ischemic causes were ruled out by: coronary angiography 154 (64%), 27 (11%) had a negative exercise/pharmacologic stress nuclear imaging, 18 (8%) by a negative stress CMR, and 41 (17%) by the clinical evaluation of the referring cardiologists before CMR study. No patient had thyroid or inflammatory causes of cardiomyopathy by available serological tests ordered by the caring physicians. Prevalence of coronary risk factors in the cohort was low, with hypertension, dyslipidemia, and diabetes occurring in 30%, 21%, and 13%, respectively. The median hematocrit was 40% (IQR 4%) and the median time between hematocrit and CMR acquisition was 0 days (IQR 4). In 40 patients (17%), hematocrit values were not available from clinical testing and they were imputed to 41%. The cohort resembles patients with moderate left ventricular dysfunction and dilatation, evident by a mean LVEF of 43±15% and LVEDVi of 114±31 ml/m2, respectively.
Table 1.
Patient Demographics
| Variable | All Patient (n=240) | MACE (n=36) | No MACE (n=204) | P Value |
|---|---|---|---|---|
| Clinical Demographics | ||||
| Age (year) | 49 ± 16 | 57 ± 15 | 47 ± 16 | <0.001 |
| Female gender | 92 (38%) | 12 (33%) | 80 (39%) | 0.578 |
| Body mass index, kg/m2 | 28 ± 7 | 28 ± 9 | 28 ± 7 | 0.745 |
| Hypertension | 72 (30%) | 15 (42%) | 57 (28%) | 0.119 |
| Tobacco | 38 (16%) | 6 (17%) | 32 (16%) | 1.0 |
| Diabetes | 31 (13%) | 7 (19%) | 24 (12%) | 0.279 |
| Dyslipidemia | 51 (21%) | 12 (33%) | 39 (19%) | 0.077 |
| NYHA HF Classification (I-IV) | ||||
| NYHA HF – I | 167 (70%) | 18 (50%) | 149 (73%) | <0.001 |
| NYHA HF – II | 53 (22%) | 9 (25%) | 44 (22%) | |
| NYHA HF – III-IV | 20 (8%) | 9 (25%) | 11 (5%) | |
| Hematocrit, % | 40 [IQR 4] | 39 [IQR 7] | 40 [IQR 4] | 0.530 |
| Medications | ||||
| Aspirin | 74 (31%) | 16 (44%) | 58 (28%) | 0.077 |
| ACE inhibitors | 134 (56%) | 26 (72%) | 108 (53%) | 0.044 |
| Angiotensin Receptor Antagonists | 9 (4%) | 3 (8%) | 6 (3%) | 0.137 |
| ACE inhibitors or Angiotensin Receptor Antagonists | 143 (60%) | 29 (81%) | 114 (56%) | 0.006 |
| Beta-blockers | 121 (50%) | 26 (72%) | 95 (47%) | 0.006 |
| Diuretics | 82 (34%) | 26 (72%) | 56 (27%) | <0.001 |
| Digitalis | 11 (5%) | 6 (17%) | 5 (2%) | 0.002 |
| Statin | 54 (23%) | 12 (33%) | 42 (21%) | 0.129 |
| ECG* | ||||
| Atrial fibrillation | 14 (6%) | 3 (8%) | 11 (5%) | 0.550 |
| Left bundle branch block | 21 (11%) | 3 (10%) | 18 (11%) | 1.0 |
| Right bundle branch block | 29 (15%) | 4 (13%) | 25 (16%) | 1.0 |
| QRS interval (msec) | 105 ± 27 | 105 ± 19 | 105 ± 29 | 0.890 |
| Significant Q waves | 32 (13%) | 8 (22%) | 4 (2%) | 0.060 |
| Cardiac MRI | ||||
| LVEF (%) | 43 ± 15 | 31 ± 14 | 45 ± 14 | <0.001 |
| LVEF < 30% | 50 (21%) | 16 (44%) | 34 (17%) | <0.001 |
| LVEDVi, (ml/m2) | 114 ± 31 | 126 ± 35 | 112 ± 30 | <0.001 |
| LVEDV, (ml) | 224 ± 67 | 250 ± 83 | 219 ± 63 | <0.001 |
| LVESVi, (ml/m2) | 68 ± 34 | 89 ± 37 | 65 ± 33 | <0.001 |
| LVESV, (ml) | 134 ± 70 | 177 ± 78 | 126 ± 65 | <0.001 |
| LV mass index (g/m2) | 64 ± 20 | 73 ± 27 | 62 ± 19 | 0.005 |
| Wall motion abnormalities at rest | 37 (15%) | 7 (19%) | 30 (15%) | 0.520 |
| LVSV/LV mass (ml/g) | 0.8 ± 0.3 | 0.6 ± 0.3 | 0.8 ± 0.3 | <0.001 |
| LV mass/LVEDV (g/ml) | 0.6 ± 0.2 | 0.6 ± 0.2 | 0.6 ± 0.1 | 0.170 |
| RVEF (%) | 45 ± 11 | 37 ± 11 | 46 ± 10 | <0.001 |
| RVEF < 40% | 54 (23%) | 21 (58%) | 33 (16%) | <0.001 |
| RVEDVi, (ml/m2) | 85 ± 21 | 84 ± 26 | 85 ± 20 | 0.903 |
| RVEDV, (ml) | 166 ± 48 | 165 ± 52 | 166 ± 47 | 0.937 |
| RVESVi, (ml/m2) | 48 ± 19 | 54 ± 23 | 47 ± 17 | 0.026 |
| RVESV, (ml) | 94 ± 38 | 106 ± 45 | 91 ± 37 | 0.036 |
| LGE presence** | 81 (35%) | 19 (54%) | 62 (31%) | 0.012 |
| LGE mass (4-SD, g), in patients with LGE presence | 2.9 [IQR 5.8] | 2.7 [IQR 10.5] | 3.2 [IQR 5.1] | 0.83 |
| LGE % (4-SD, %), in patients with LGE presence | 2.8 [IQR 3.4] | 1.9 [IQR 7.4] | 2.9 [IQR 3.4] | 0.83 |
| ECV mean (%)** | 31.7 ± 7.0 | 37.8 ± 9.8 | 30.8 ± 6.0 | <0.001 |
| ECV mean (>34%) | 69 (29%) | 16 (50%) | 53 (26%) | 0.011 |
| Native T1, mean (msec) | 1092 ± 127 | 1121 ± 160 | 1087 ± 122 | 0.166 |
| λGd, mean | 0.5 ± 0.1 | 0.6 ± 0.2 | 0.5 ± 0.1 | <0.001 |
NYHA, New York Heart Association Class; HF, heart failure; ACE, angiotensin-converting enzyme; MRI, magnetic resonance imaging; LVEF, left ventricular ejection fraction; LVEDVi, left ventricular end diastolic volume indexed; LVEDV, left ventricular end diastolic volume; LVESVi, left ventricular end systolic volume index; LVESV, left ventricular end-systolic volume; LVSV, left ventricular stroke volume; RVEF, right ventricular ejection fraction; RVEDVi, right ventricular end-diastolic volume index; RVEDV, right ventricular end-diastolic volume; RVESVi, right ventricular end-systolic volume index; RVESV, right ventricular end-systolic volume; ECV, extracellular volume. λGd, partition coefficient;
LGE and ECV were available in 239 and 233 patients, respectively.
Similar to published reports, non-ischemic LGE was seen in 81 of 239 patients (34%) with septal LGE seen in 68 (28%).(3) The myocardial extent of LGE (4-SD method) was small at median 2.9 g (IQR 5.8 g) in LGE positive patients. By comparison, ECV and native T1 were abnormal in at least 1 anatomical location in 58% and 77% of patients, respectively.
Clinical contact for assessing MACE was successful in 238 of the 240 subjects (0.8% lost to follow-up). Although, the remaining 2 lost to follow-up patients were reported alive based on interrogation of Social Security Death Index. During the mean follow-up of 3.8±1.6 years, 36 subjects (15%) experienced MACE including first events of heart failure hospitalizations (n=22, 9%) and deaths (n=14, 6%). As shown in Table 1, a hypertensive history was noted in 42% of patients who experienced MACE and it demonstrated a trend association with MACE. patients who experienced MACE had higher LGE extent and mean ECV than those free from MACE (4.9 g and 38% vs.1.7g and 31%, p=0.03 and p<0.001, respectively), but not mean native T1. Kaplan-Meier curves for event-free survival, stratified by the ECV tertiles, are shown in Figure 2. ECV tertiles corresponded to a progressive reduction of cardiac event-free survival (p=0.004). Table 2 demonstrate the associations of clinical and CMR variables with MACE. Patient age, NYHA class, LVESV, LVEF, and RVEF demonstrated association with MACE. Both mean ECV and mean λGd were associated with MACE (all p<0.001). For every 10% increase in mean ECV, hazard of MACE increased by 2.8-fold (p<0.001). LGE presence was a significant covariate in the associations with MACE. Native T1 was not a significant covariate in the association with MACE. Figure 3 shows the annualized event rates by ECV tertiles stratified by a 30% LVEF cutoff. Annualized MACE rates escalated from 1.4%, 2.9% to 6.6%, across the first, second, and third ECV tertile, respectively (p<0.001). Annualized MACE rates among patients with LVEF ≥30% escalated modestly from 1.5%, 1.9% to 3.7%. On the other hand, in patients with LVEF <30%, annualized event rates escalated from 2.6%, 5.9% and 18.3% from the lowest to the highest ECV tertile, respectively (p<0.001). Subjects with LVEF <30% suffered markedly high rates of MACE amongst those in the second and third ECV tertiles.
Figure 2. Kaplan-Meier Curve Stratified by ECV Tertiles.
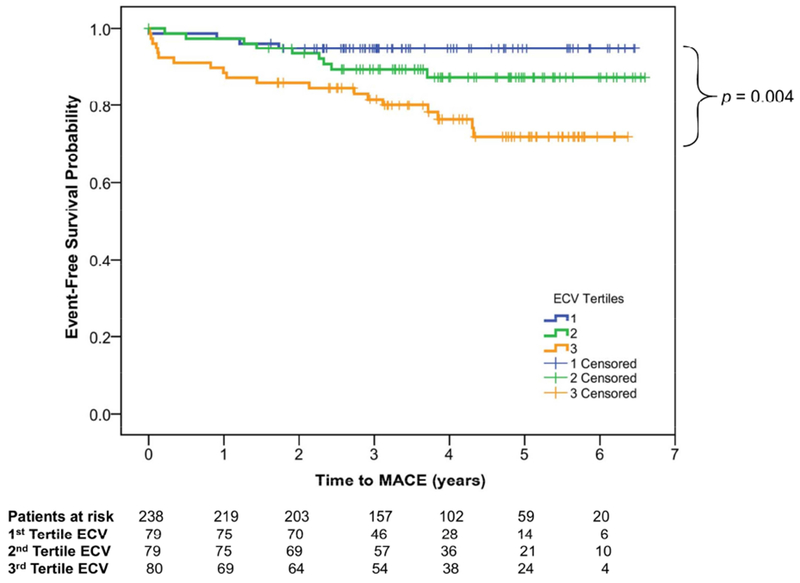
Kaplan–Meier survival curves demonstrating progressive reduction of MACE-free survival from the lowest to the highest ECV tertiles.
Table 2.
Univariable Association with MACE in the Whole Cohort
| Parameter | MACE | ||
|---|---|---|---|
| Chi-Sq | HR (95% CI) | P-Value | |
| Clinical Demographics | |||
| Age (year) | 10.74 | 1.04 (1.02 -1.06) | 0.001 |
| Female Gender | 0.48 | 0.78 (0.39 -1.57) | 0.489 |
| Body mass index (kg/m2) | 0.11 | 0.99 (0.95 - 1.04) | 0.745 |
| NYHA Class | 8.54 | 1.84 (1.22 -2.77) | 0.003 |
| NYHA Class III and IV | 15.49 | 4.57 (2.14 – 9.74) | <0.001 |
| Hypertension | 2.80 | 1.76 (0.91 – 3.42) | 0.094 |
| Diabetes mellitus | 1.07 | 1.55 (0.68 – 3.54) | 0.300 |
| Dyslipidemia | 3.83 | 2.00 (1.00 – 4.00) | 0.050 |
| Smoking > 10 packed years | 0.01 | 1.03 (0.43 – 2.49) | 0.944 |
| Family history of coronary artery disease | 1.38 | 0.43 (0.10 – 1.77) | 0.240 |
| Serum Creatinine - Log, (mg/dl) | 8.51 | 7.21 (1.91 – 27.17) | 0.004 |
| Medications | |||
| Aspirin | 3.18 | 1.82 (0.94 – 3.51) | 0.075 |
| Beta-blocker | 6.79 | 2.64 (1.27 – 5.47) | 0.009 |
| ACE-Inhibitors | 3.97 | 2.10 (1.01 – 4.36) | 0.046 |
| ACE-Inhibitors or Angiotensin Receptor Antagonists | 6.83 | 3.01 (1.32 – 6.87) | 0.009 |
| Digitalis | 11.40 | 4.54 (1.89 – 10.93) | 0.001 |
| Diuretics | 21.30 | 5.57 (2.69 – 11.56) | <0.001 |
| Statins | 2.89 | 1.82 (0.91 – 3.65) | 0.089 |
| Aldosterone Blockers | 3.20 | 3.18 (0.89 – 11.28) | 0.074 |
| ECG | |||
| Atrial fibrillation | 0.55 | 1.57 (0.48 – 5.19) | 0.457 |
| PR interval (msec) | 0.75 | 1.00 (0.99 – 1.02) | 0.388 |
| QRS interval (msec) | 0.04 | 1.00 (0.99 – 1.01) | 0.837 |
| QT interval (msec) | 8.36 | 0.99 (0.98 – 1.00) | 0.004 |
| Left Bundle Branch Block | 0.11 | 0.82 (0.25 – 2.71) | 0.743 |
| Right Bundle Branch Block | 0.07 | 0.87 (0.30 – 2.50) | 0.797 |
| Increased Voltage for LVH | 0.26 | 0.79 (0.32 – 1.94) | 0.610 |
| Q Wave | 2.15 | 1.83 (0.82 – 4.12) | 0.143 |
| ST Abnormalities | 11.81 | 4.81 (1.96 – 11.78) | 0.001 |
| T Wave Inversions | 2.55 | 1.83 (0.87 – 3.85) | 0.110 |
| Cardiac MRI | |||
| LVEF (%) | 23.32 | 0.94 (0.92 – 0.97) | <0.001 |
| LVEF < 30% | 12.45 | 3.36 (1.71 – 6.60) | <0.001 |
| LVEF < 40% | 19.94 | 6.09 (2.76 – 13.46) | <0.001 |
| LV Mass (grams) | 8.89 | 1.01 (1.00 – 1.01) | 0.003 |
| LV Mass Index (g/m2) | 8.73 | 1.02 (1.01 – 1.03) | 0.003 |
| LVEDD (mm) | 2.92 | 1.03 (1.00 – 1.07) | 0.088 |
| LVEDV (ml) | 5.70 | 1.01 (1.00 – 1.01) | 0.017 |
| LVEDVi (ml/m2) | 5.07 | 1.01 (1.00 – 1.02) | 0.024 |
| LVESV (ml) | 14.05 | 1.01 (1.00 – 1.01) | <0.001 |
| LVESVi (ml/m2) | 13.23 | 1.02 (1.01 – 1.02) | <0.001 |
| LV Mass Vol (ml) | 2.75 | 4.50 (0.76 – 26.57) | 0.097 |
| Wall Motion Abnormalities | 0.41 | 1.31 (0.57 – 3.00) | 0.524 |
| Myocardial Contractile Fraction (ml/g) | 20.26 | 0.04 (0.01 – 0.17) | <0.001 |
| RVEF (%) | 20.29 | 0.94 (0.92 – 0.97) | <0.001 |
| RVEF < 40% | 26.60 | 6.21 (3.10 – 12.42) | <0.001 |
| RVEDV (ml) | 0.01 | 1.00 (0.99 – 1.01) | 0.931 |
| RVEDVi (ml/m2) | 0.00 | 1.00 (0.98 – 1.02) | 0.971 |
| RVESV (ml) | 5.45 | 1.01 (1.00 – 1.02) | 0.020 |
| RVESVi (ml/m2) | 6.04 | 1.02 (1.00 – 1.03) | 0.014 |
| LGE presence | 5.80 | 2.26 (1.16 – 4.40) | 0.016 |
| LGE Mass 2-SD (g) | 4.44 | 1.02 (1.00 – 1.04) | 0.035 |
| LGE Mass 3-SD (g) | 5.05 | 1.03 (1.00 – 1.05) | 0.025 |
| LGE Mass 4-SD (g) | 4.60 | 1.03 (1.00 – 1.06) | 0.032 |
| LGE Mass 6-SD (g) | 3.92 | 1.04 (1.00 – 1.09) | 0.048 |
| LGE (%) 2-SD | 2.18 | 1.02 (0.99 – 1.05) | 0.140 |
| LGE (%) 3-SD | 2.32 | 1.03 (0.99 – 1.06) | 0.128 |
| LGE (%) 4-SD | 2.17 | 1.03 (0.99 – 1.07) | 0.141 |
| LGE (%) 6-SD | 1.73 | 1.04 (0.98 – 1.09) | 0.189 |
| Native T1, mean (msec) | 3.06 | 1.00 (1.00 – 1.01) | 0.080 |
| λGd, mean (per 0.1 increment) | 25.68 | 1.87 (1.47 – 2.38) | <0.001 |
| ECV mean (%) | 27.92 | 1.11 (1.07 – 1.15) | <0.001 |
| ECV mean > 34 % | 5.80 | 2.35 (1.17 – 4.70) | 0.016 |
| ECV mean, per 10% | 27.92 | 2.80 (1.91 – 4.10) | <0.001 |
Figure 3. Annualized Event Rates of MACE stratified by LVEF < 30% and ECV Tertiles.

There was progressive increase in the annual MACE rates across the escalating ECV tertiles, regardless of patients’ status of LVEF <30%.
Multivariable Models for MACE
Table 3 shows the multivariable models. When mean ECV (in %) was added to the models that contained each of native T1, LGE presence, and LGE mass (mean+2SD), mean ECV maintained strong association with MACE adjusted to each of the 3 variables. Patient age, NYHA class, and LVEF were included in each of these 3 models so that the comparisons between mean ECV and each of 3 variables were properly adjusted. All 3 variables lost their significance in their respective models. Mean ECV did not maintain association with MACE when adjusted against λGd in the same model. In 156 patients with moderate LV dysfunction or dilatation defined by the recent published reference ranges (LVEF<45%, male with LVEDVI>112 ml/m2 or female with LVEDVI>99 ml/m2), mean ECV maintained strong association with MACE when added to a model containing patient age, NYHA class, and LVEF (adjusted HR 1.08, p=0.004). All covariates in these multivariable models fulfilled the proportional hazards assumption.
Table 3.
Multivariable Analysis of Association with MACE in the Whole Cohort
| Model 1 | Model 2 | Model 3 | |||
|---|---|---|---|---|---|
| Variables | HRs, P-values | Variables | HRs, P-values | Variables | HRs, P-values |
| Age (year) | 1.03, 0.06 | Age (year) | 1.03, 0.07 | Age (year) | 1.02, 0.13 |
| NYHA Class | 1.06, 0.83 | NYHA Class | 1.02, 0.95 | NYHA Class | 0.94, 0.84 |
| LVEF (%) | 0.94, 0.0002 | LVEF (%) | 0.95, 0.0003 | LVEF (%) | 0.94, 0.0003 |
| mean T1 (msec) | 1.00, 0.53 | LGE presence | 1.07, 0.87 | LGE mass (2SD) | 1.01, 0.34 |
| mean ECV (%) | 1.11, <0.0001 | mean ECV (%) | 1.11, <0.0001 | mean ECV (%) | 1.11, <0.0001 |
Comparing Anatomical Locations Across the Tissue Characterizing Methods
The association of anatomical locations with MACE by each of the 4 methods is shown in Figure 4. For LGE, both presence or absence and percentage extent by anatomical locations were analyzed. The anteroseptal segment represented the location of most closely associated with MACE across all 4 methods. Although ECV in the anteroseptal location had strongest association with MACE (chi-square 29.1, HR 1.11, 95%CI: 1.07-1.16, p<0.0001), ECV in all locations demonstrated strong association with MACE. Such prognostic association involving all anatomical locations was most robust by ECV when the 4 methods were compared.
Figure 4. Univariable Associations of the Anatomical Locations Across the Tissue Characterization Methods with MACE.

Mean ECV values in all 6 anatomical locations had robust association with MACE, which is in contrast to native T1 mapping and LGE presence. Abnormalities in anteroseptal and inferoseptal locations were more closely linked with MACE.
Figure 5 illustrates the annual MACE event rates between native T1 mean, λGd, and ECV, stratified by the number of abnormal anatomical locations. Mapping the number of abnormal ECV locations corresponded to a linear increase in annual MACE rates (p=0.0003 for trend), ranging from 2.4% in patients with only 1 location with abnormal ECV to 7.7% in patients with all 6 ECV locations abnormal. For each abnormal ECV location, the risk increasesd by 18% (HR 1.18, 95%CI: 1.01-1.39, p=0.035).
Figure 5. Annualized Event-Rates Based on the extent of Abnormal Anatomical locations in LGE, native T1 and ECV.

The total number of abnormal anatomical locations by LGE (panel a) and λGd(panel b) were not significantly associated with MACE. In panel c, the extent of abnormal ECV locations showed a linear trend towards the risk of MACE (p<0.01 for trend). This suggests the diffuse myocardial pattern mapped by ECV characterized the risk to MACE more closely than LGE or native T1. For every additional abnormal ECV myocardial location, the risk increases by 18% (HR 1.18, 95%CI: 1.01-1-39, p=0.0003 for trend).
Prognostic Values of Tissue Charactization in Patients with no LGE
The association of anatomical locations with MACE, by native T1 mean, λGd, and ECV, are shown in Figure 6. In the LGE negative patients, only ECV maintained its significant association, with MACE , in all anatomical locations. Such pattern of significant prognostication was not observed by native T1 mean and λGd.
Figure 6. Univariable Analysis Associations of the Anatomical Locations Across the Tissue Characterization Methods with MACE, in Patients with no LGE.

In LGE negative patients, all locations by ECV maintained robust prognostic association with MACE. In comparison, locations by native T1, λGd, and LGE were not associated with MACE regardless of the anatomical location of abnormality.
Discussion
In a consecutive cohort of patients with NIDCM, we observed that the extent of abnormality by ECV mapping portended to progressive increased risk to heart failure outcomes. ECV was significantly associated with MACE in any anatomical location (with highest association in the anteroseptal location). By increasing numbers of abnormal anatomical location, a corresponding increasing higher annualized event-rates for MACE was observed. In addition, ECV provides incremental prognostic association with MACE over native T1, LGE presence, and LGE mass, individually.
As heart failure hospitalization is costly, better risk stratification is imperatively needed and LGE presence might be a promising marker. Indeed, previous studies have reported that LGE was associated with adverse cardiac events and have incremental prognostic information beyond LVEF.(3,13–15) However, as LGE, in line with our study, is only present in 25-40% of patients with NIDCM, (3,16) potentially novel stratification tools to risk assess heart failure outcomes with the potential window of closer monitoring of high-risk patients and modify heart failure medication is needed. Mean ECV and λGd allows mapping of the entire heart and provided association with MACE, incremental to LVEF and LGE presence or size. LGE relies on regional contrast between normal and fibrotic myocardium, thus is an indirect measure of focal macroscopic myocardial scar. Our findings support the notion that LGE presence and size represent the “tip of the iceberg” of the underlying myocardial fibrosis and they are insensitive to characterizing the spectrum of diffuse myocardial fibrosis in NIDCM. Furthermore, we could show that anatomical location of involved abnormal anatomical locations helps in the risk stratification. Indeed, anteroseptal abnormal ECV, in line with antero-septal LGE presence from previous reports, seems to pose the patient at high risk.(17) Oloriz et al. showed that the anteroseptal location of scarring, based on endocardial unipolar voltage, is most associated with ventricular tachycardial recurrence in patients with NIDCM.(18) This is in line with our study, showing that fibrosis, based on ECV finding is mostly associated with MACE when located anteroseptal. It has been postulated that the combination of excess basal mechanical stress and underlying cardiomyopathic processes lead to increased arrhythmogenic substrate in this region.(15) Prior evidence supports our finding that ECV provides incremental prognostic association than native T1 mapping, in part due to ECV’s better estimation of myocardial collagen volume fraction. In a recent small study of patients with symptomatic severe aortic stenosis scheduled for surgical valve replacement, native T1 showed only a moderate correlation with histologically-defined fibrosis, whereas the λGd and ECV both showed strong correlations with fibrosis in histology.(19) It is important to note that ECV and all measures derived from pre- and post-contrast T1 mapping are sensitive to fibrosis and edema.(20) Compared to native T1 mapping, λGd and ECV is less sensitive to the effects of field strength and the inter-individual variability because it is normalized by the change of the T1 relaxation rate in blood between pre- and post-contrast imaging.(21)
Prior studies had reported a strong association of ECV with mortality and heart failure outcomes.(22) However, this was assessed in a large cohort of patients consecutively referred to undergo a clinical CMR study with diverse study indications and different underlying cardiac conditions. Puntmann et al studied 637 patients with NIDCM and found that native T1 and LGE, but not ECV, provided strong association with outcomes in their multivariable models for clinical outcomes and they commented on the logistic problems of obtaining hematocrit measurements.(14) In addition to Puntmann et al., we observed significant prognostic association of ECV (and λGd) with MACE in patients with NIDCM. Although there are discrepancies between the study, which are likely represented in differences in the CMR techniques, study cohort and designs at this stage of clinical adaptation of ECV imaging. As normal values differ between scanner types and are therefore not interchangeable, (23) the study by Puntmann et al. using two different field strengths (namely 1.5 and 3.0 Tesla scanners), make generalizability of the results difficult, whereas in our center, we used our own derived normal values of a single state of the art 3.0T scanner for all patients. However, based on the results of these two studies, they are in some way complementary on account of the differences in patient characteristics, and specifically differences in the extent of diffuse interstitial fibrosis (native T1 and ECV) vs. focal fibrosis (LGE), it seems that both native T1, ECV and LGE are likely to play a significant role in NICM patient for the prediction of outcomes.
Our study has several limitations. First, we were not able to adjudicate the cause of death in some patients followed in an outpatient setting. In addition, the number of mortality events was small, thus our study cannot inform regarding any association of ECV and sudden cardiac death or decision towards implantable cardioverter-defibrillator therapy. Furthermore, due to the small numbers of events, our results should be seen as preliminary results. Second, CMR has been a part of the clinical workup of cardiomyopathy at our center. Consequently, a subset of our current cohort were considered to have a nonischemic cause of cardiomyopathy based on combined clinical evaluation and CMR evidence alone without the confirmation from an invasive coronary angiography. Prior investigations had indicated that approach could reliably ascertain non-ischemic etiology of heart failure.(24,25) Third, different T1 mapping methods extract different tissue information. Thus generalization or comparison of results obtained by our cine look-locker gradient echo T1-mapping method, to other more commonly used T1 mapping methods, may not apply. Abnormal cutoff values of T1 and ECV remain investigational and cannot be universally applied across different pulse sequences. In addition, given that at the time of the study, our institution did not have the capability of performing hematocrit using a point-of-care bedside device and as a result 17% of subjects had missing hematocrit. Fourth, patients in our cohort represent a mild/early phenotype of heart failure. Thus, our results may not be applicable to those with severe phenotypes of heart failure. CMR referral itself introduced selection bias and our NIDCM patients were likely more hemodynamically stable and have less severe renal dysfunction or LVEF impairment given the exclusion of those with an implanted cardiac defibrillator. Our study thus cannot currently assess the impact from these referral biases onto the current results. Fifth, our cohort may have included patients with chronic myocarditis with fibrosis or scars which account for a higher T1 and ECV and may have influenced the outcomes. Finally, adjudication of heart failure hospitalization was subject to the clinical discretions of the admitting cardiologists. We minimized this bias by using standardized criteria of heart failure decompensation.(10,11)
Conclusion
In patients with NIDCM, mapping the myocardial extent of abnormality using ECV characterizes the risk of heart failure outcomes, incremental to LGE or native T1 mapping in this study.
Supplementary Material
Clinical Competency.
Competency in Medical Knowledge
Comparing 4 methods of tissue characterization, mapping the extent of ECV abnormality across all anatomical locations provides the high prognostic value to heart failure events in patients with NIDCM.
Translational outlook.
Extent of ECV abnormality as an estimate of diffuse myocardial fibrosis in patients with NIDCM provides significant incremental prognostic value over the current routine using LGE imaging.
Acknowledgments
Disclosures Statement
Dr. Vita was supported by the National Institutes of Health training grant T32-HL094301-05. Dr. Kwong was supported by the National Institutes of Health award 1UH2 TR000901 and research funding from GlaxoSmithKline and MyoKarida, Inc.. Dr. Gräni receives funding support from the Novartis Foundation for Medical-Biological Research, Bangerter-Rhyner Foundation, Swiss Sports Medicine Society and Kreislauf Kardiologie Foundation. Dr. Jerosch-Herold was supported by the National Institutes of Health award R01 HL090634.
List of abbreviations
- CMR
cardiac magnetic resonance imaging
- ECV
extracellular volume fraction
- NIDCM
non-ischemic dilated cardiomyopathy
- LGE
late gadolinium enhancement
- LVEF
left ventricular ejection fraction
Footnotes
Publisher's Disclaimer: This is a PDF file of an unedited manuscript that has been accepted for publication. As a service to our customers we are providing this early version of the manuscript. The manuscript will undergo copyediting, typesetting, and review of the resulting proof before it is published in its final citable form. Please note that during the production process errors may be discovered which could affect the content, and all legal disclaimers that apply to the journal pertain.
References
- 1.Heidenreich PA, Albert NM, Allen LA et al. Forecasting the impact of heart failure in the United States: a policy statement from the American Heart Association. Circ Heart Fail 2013;6:606–19. [DOI] [PMC free article] [PubMed] [Google Scholar]
- 2.Wu TJ, Ong JJ, Hwang C et al. Characteristics of wave fronts during ventricular fibrillation in human hearts with dilated cardiomyopathy: role of increased fibrosis in the generation of reentry. J Am Coll Cardiol 1998;32:187–96. [DOI] [PubMed] [Google Scholar]
- 3.Gulati A, Jabbour A, Ismail TF et al. Association of fibrosis with mortality and sudden cardiac death in patients with nonischemic dilated cardiomyopathy. Jama 2013;309:896–908. [DOI] [PubMed] [Google Scholar]
- 4.Kehr E, Sono M, Chugh SS, Jerosch-Herold M. Gadolinium-enhanced magnetic resonance imaging for detection and quantification of fibrosis in human myocardium in vitro. Int J Cardiovasc Imaging 2008;24:61–8. [DOI] [PubMed] [Google Scholar]
- 5.Coelho-Filho OR, Mongeon FP, Mitchell R et al. Role of transcytolemmal water-exchange in magnetic resonance measurements of diffuse myocardial fibrosis in hypertensive heart disease. Circ Cardiovasc Imaging 2013;6:134–41. [DOI] [PMC free article] [PubMed] [Google Scholar]
- 6.Wong TC, Schelbert EB. Many Paths Lead to CV Outcomes: A Potential Need for Image-Guided Precision Medicine. JACC Cardiovasc Imaging 2016;9:24–6. [DOI] [PubMed] [Google Scholar]
- 7.Wong TC, Piehler K, Meier CG et al. Association between extracellular matrix expansion quantified by cardiovascular magnetic resonance and short-term mortality. Circulation 2012;126:1206–16. [DOI] [PMC free article] [PubMed] [Google Scholar]
- 8.Kramer CM, Barkhausen J, Flamm SD, Kim RJ, Nagel E, Society for Cardiovascular Magnetic Resonance Board of Trustees Task Force on Standardized P. Standardized cardiovascular magnetic resonance (CMR) protocols 2013 update. J Cardiovasc Magn Reson 2013;15:91. [DOI] [PMC free article] [PubMed] [Google Scholar]
- 9.Neilan TG, Coelho-Filho OR, Shah RV et al. Myocardial extracellular volume fraction from T1 measurements in healthy volunteers and mice: relationship to aging and cardiac dimensions. JACC Cardiovasc Imaging 2013;6:672–83. [DOI] [PMC free article] [PubMed] [Google Scholar]
- 10.Pfeffer MA, Swedberg K, Granger CB et al. Effects of candesartan on mortality and morbidity in patients with chronic heart failure: the CHARM-Overall programme. Lancet 2003;362:759–66. [DOI] [PubMed] [Google Scholar]
- 11.Zannad F, Stough WG, Pitt B et al. Heart failure as an endpoint in heart failure and non-heart failure cardiovascular clinical trials: the need for a consensus definition. Eur Heart J 2008;29:413–21. [DOI] [PubMed] [Google Scholar]
- 12.Ponikowski P, Voors AA, Anker SD et al. 2016 ESC Guidelines for the diagnosis and treatment of acute and chronic heart failure: The Task Force for the diagnosis and treatment of acute and chronic heart failure of the European Society of Cardiology (ESC)Developed with the special contribution of the Heart Failure Association (HFA) of the ESC. Eur Heart J 2016;37:2129–200. [DOI] [PubMed] [Google Scholar]
- 13.Neilan TG, Coelho-Filho OR, Danik SB et al. CMR quantification of myocardial scar provides additive prognostic information in nonischemic cardiomyopathy. JACC Cardiovasc Imaging 2013;6:944–54. [DOI] [PMC free article] [PubMed] [Google Scholar]
- 14.Puntmann VO, Carr-White G, Jabbour A et al. T1-Mapping and Outcome in Nonischemic Cardiomyopathy: All-Cause Mortality and Heart Failure. JACC Cardiovasc Imaging 2016;9:40–50. [DOI] [PubMed] [Google Scholar]
- 15.Halliday BP, Gulati A, Ali A et al. Association Between Midwall Late Gadolinium Enhancement and Sudden Cardiac Death in Patients With Dilated Cardiomyopathy and Mild and Moderate Left Ventricular Systolic Dysfunction. Circulation 2017;135:2106–2115. [DOI] [PMC free article] [PubMed] [Google Scholar]
- 16.Iles L, Pfluger H, Phrommintikul A et al. Evaluation of diffuse myocardial fibrosis in heart failure with cardiac magnetic resonance contrast-enhanced T1 mapping. J Am Coll Cardiol 2008;52:1574–80. [DOI] [PubMed] [Google Scholar]
- 17.Castelvecchio S, Careri G, Ambrogi F et al. Myocardial scar location as detected by cardiac magnetic resonance is associated with the outcome in heart failure patients undergoing surgical ventricular reconstruction. Eur J Cardiothorac Surg 2018;53:143–149. [DOI] [PubMed] [Google Scholar]
- 18.Oloriz T, Silberbauer J, Maccabelli G et al. Catheter ablation of ventricular arrhythmia in nonischemic cardiomyopathy: anteroseptal versus inferolateral scar sub-types. Circ Arrhythm Electrophysiol 2014;7:414–23. [DOI] [PubMed] [Google Scholar]
- 19.Vassiliou VS, Wassilew K, Cameron D et al. Identification of myocardial diffuse fibrosis by 11 heartbeat MOLLI T 1 mapping: averaging to improve precision and correlation with collagen volume fraction. Magma 2018;31:101–113. [DOI] [PMC free article] [PubMed] [Google Scholar]
- 20.Moon JC, Messroghli DR, Kellman P et al. Myocardial T1 mapping and extracellular volume quantification: a Society for Cardiovascular Magnetic Resonance (SCMR) and CMR Working Group of the European Society of Cardiology consensus statement. J Cardiovasc Magn Reson 2013;15:92. [DOI] [PMC free article] [PubMed] [Google Scholar]
- 21.Arheden H, Saeed M, Higgins CB et al. Measurement of the distribution volume of gadopentetate dimeglumine at echo-planar MR imaging to quantify myocardial infarction: comparison with 99mTc-DTPA autoradiography in rats. Radiology 1999;211:698–708. [DOI] [PubMed] [Google Scholar]
- 22.Schelbert EB, Piehler KM, Zareba KM et al. Myocardial Fibrosis Quantified by Extracellular Volume Is Associated With Subsequent Hospitalization for Heart Failure, Death, or Both Across the Spectrum of Ejection Fraction and Heart Failure Stage. J Am Heart Assoc 2015;4:12. [DOI] [PMC free article] [PubMed] [Google Scholar]
- 23.Messroghli DR, Moon JC, Ferreira VM et al. Clinical recommendations for cardiovascular magnetic resonance mapping of T1, T2, T2* and extracellular volume: A consensus statement by the Society for Cardiovascular Magnetic Resonance (SCMR) endorsed by the European Association for Cardiovascular Imaging (EACVI). J Cardiovasc Magn Reson 2017;19:75. [DOI] [PMC free article] [PubMed] [Google Scholar]
- 24.Assomull RG, Shakespeare C, Kalra PR et al. Role of cardiovascular magnetic resonance as a gatekeeper to invasive coronary angiography in patients presenting with heart failure of unknown etiology. Circulation 2011;124:1351–60. [DOI] [PubMed] [Google Scholar]
- 25.McCrohon JA, Moon JC, Prasad SK et al. Differentiation of heart failure related to dilated cardiomyopathy and coronary artery disease using gadolinium-enhanced cardiovascular magnetic resonance. Circulation 2003;108:54–9. [DOI] [PubMed] [Google Scholar]
Associated Data
This section collects any data citations, data availability statements, or supplementary materials included in this article.