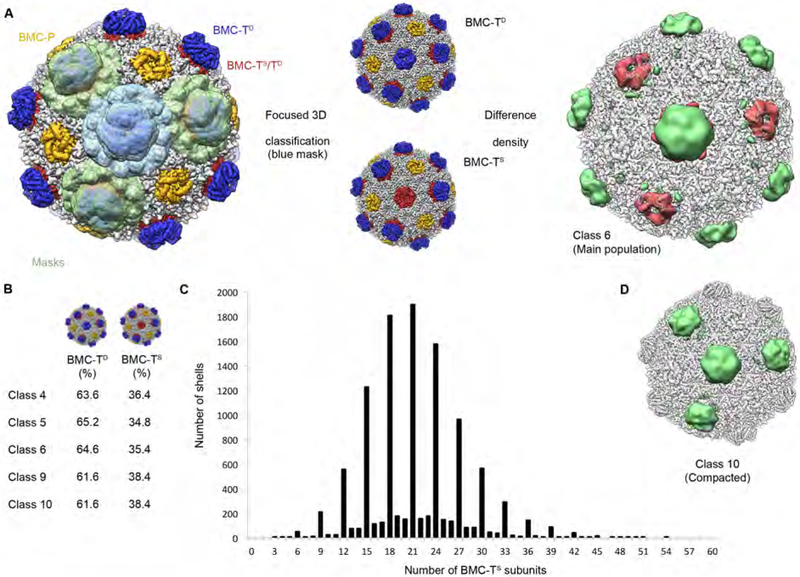
Fig. 7. Classification of four adjacent BMC-T positions and analysis of the distribution of BMC-TS or BMC-TD in the HO BMC shell.
(A) Left: Region of density showing the arrangement of classified BMC-T positions (masks used for classification shown in light green and light blue). Classification using the blue mask resulted in reconstructions sorted for the central BMC-T trimer (shown in the center). Right: Difference density obtained by subtracting the reconstruction classified for a central BMC-TD from the reconstruction classified for a central BMC-TS (the two reconstructions shown in the center).
(B) Average percentages of BMC-TS and BMC-TD in selected HO shell 3D classes.
(C) Histogram of number of BMC-TS subunits in HO shells (main population, class 6). The number of BMC-TS counts that are not divisible by 3 indicates that the error rate of the classification at the single BMC-T subunit level is on the order of 0.25 % (given approx. 16 % of shells with one classification error and 60 BMC-T monomer positions per shell).
(D) Visualization of difference density resulting from subtraction of BMC-TS maps from BMC-TD maps for the compacted class 10 (only positive difference density shown), revealing a different pattern for this class (compare to panel A, above). See also Figures S7, S8, Table S1.

