Abstract
PURPOSE
CALGB/SWOG 80405 was a randomized phase III trial that found no statistically significant difference in overall survival (OS) in patients with first-line metastatic colorectal cancer treated with chemotherapy plus either bevacizumab or cetuximab. Primary tumor DNA from 843 patients has been used to discover genetic markers of OS.
PATIENTS AND METHODS
Gene mutations were determined by polymerase chain reaction. Microsatellite status was determined by genotyping of microsatellites. Tumor mutational burden (TMB) was determined by next-generation sequencing. Cox proportional hazard models were used, with adjusting factors. Interaction of molecular alterations with either the bevacizumab or the cetuximab arms was tested.
RESULTS
Patients with high TMB in their tumors had longer OS than did patients with low TMB (hazard ratio [HR], 0.73 [95% CI, 0.57 to 0.95]; P = .02). In patients with microsatellite instability–high (MSI-H) tumors, longer OS was observed in the bevacizumab arm than in the cetuximab arm (HR, 0.13 [95% CI, 0.06 to 0.30]; interaction P < .001 for interaction between microsatellite status and the two arms). Patients with BRAF mutant tumors had shorter OS than did patients with wild-type (WT) tumors (HR, 2.01 [95% CI, 1.49 to 2.71]; P < .001). Patients with extended RAS mutant tumors had shorter OS than did patients with WT tumors (HR, 1.52 [95% CI, 1.26 to 1.84]; P < .001). Patients with triple-negative tumors (WT for NRAS/KRAS/BRAF) had a median OS of 35.9 months (95% CI, 33.0 to 38.8 months) versus 22.2 months (95% CI, 19.6 to 24.4 months ) in patients with at least one mutated gene in their tumors (P < .001).
CONCLUSION
In patients with metastatic colorectal cancer treated in first line, low TMB, and BRAF and RAS mutations are negative prognostic factors. Patients with MSI-H tumors benefited more from bevacizumab than from cetuximab, and studies to confirm this effect of MSI-H are warranted.
INTRODUCTION
Colorectal cancer (CRC) is the second-leading cause of cancer death in the United States.1 Over the past two decades, 13 drugs, including antibodies targeting vascular endothelial growth factor (bevacizumab) and the epidermal growth factor receptor (EGFR; cetuximab and panitumumab), have been approved for the treatment of metastatic CRC (mCRC). However, the optimal combination and sequence of these drugs is likely dependent on many factors including the mutational status of the tumor cells.
Cancer and Leukemia Group B (CALGB)/SWOG 80405 was designed initially to test whether the addition of either cetuximab or bevacizumab or both to fluorouracil and leucovorin with either oxaliplatin (FOLFOX) or irinotecan leads to superior outcomes as first-line therapy in advanced CRC or mCRC. The primary end point of the trial was overall survival (OS). In 1,137 patients with KRAS wild-type (WT; codons 12 and 13), there was no statistically significant difference in OS between the bevacizumab arm and the cetuximab arm.2 The regimens tested in CALGB/SWOG 80405 represent the current standard of care for first-line treatment in mCRC. CALGB is now part of the Alliance for Clinical Trials in Oncology (Alliance).
To individualize and optimize treatment, molecular analysis of tumors of patients, particularly those patients enrolled in clinical trials, is imperative. Outcome data and biospecimens collected from this relatively large study might provide an unprecedented opportunity for performing translational studies on molecular markers. We hypothesized that, in this context, novel somatic genetic alterations that drive tumor progression and/or resistance to therapy might affect patient outcome. Aside from our knowledge that the presence of any of a number of RAS mutations conveys resistance to EGFR inhibitors, and that microsatellite instability–high (MSI-H) tumors are more likely to respond to checkpoint inhibitors (which are under study in the first-line setting), there are no molecular markers to inform the selection of the most efficacious regimen for patients with mCRC.
This study aimed to determine the tumor mutational profile of patients with mCRC in CALGB/SWOG 80405, to evaluate the prognostic value of DNA mutations, and to determine the differential treatment effects of bevacizumab versus cetuximab in patients with a specific mutational profile.
PATIENTS AND METHODS
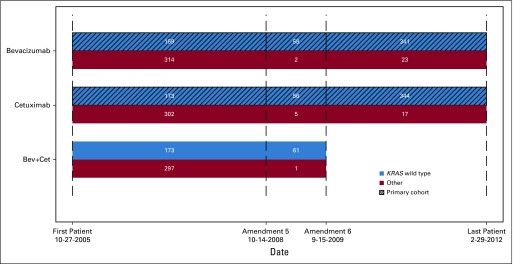
The trial was designed to compare chemotherapies plus either cetuximab, bevacizumab, or cetuximab and bevacizumab as first-line treatment of advanced CRC and mCRC. Within 3 years, data suggesting that dual antibody combinations compromised outcomes and the discovery of the lack of efficacy of EGFR antibodies in KRAS mutant tumors led to a restriction of eligibility to patients with KRAS WT (codons 12 and 13; KRAS amendment) and to closure of the dual antibody group. A revised two-arm trial (chemotherapy plus either cetuximab or bevacizumab) became the primary cohort (Appendix Fig A1, online only), and the OS results have been reported.2
Eligible patients had pathology-documented, untreated, locally advanced CRC or mCRC. Patients were 18 years or older with an Eastern Cooperative Oncology Group performance status of 0 to 1 and normal hepatic, renal, and hematologic laboratory values. Random assignment was stratified by chemotherapy, prior adjuvant chemotherapy, and prior pelvic radiation.
The primary end point of OS was defined as time of random assignment until death. Patients without reported deaths were censored at their last known follow-up. Progression-free survival (PFS) was measured from time of random assignment until first documented progression or death. Patients alive without documented tumor progression were censored for PFS at the most recent disease assessment. Median follow-up is 66.5 months (95% CI, 64.3 to 69.8 months).
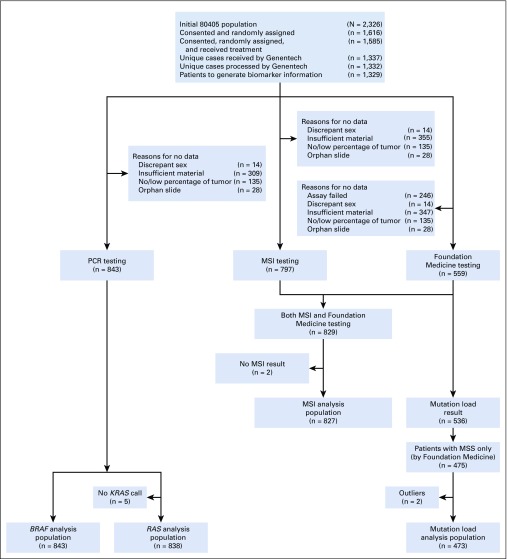
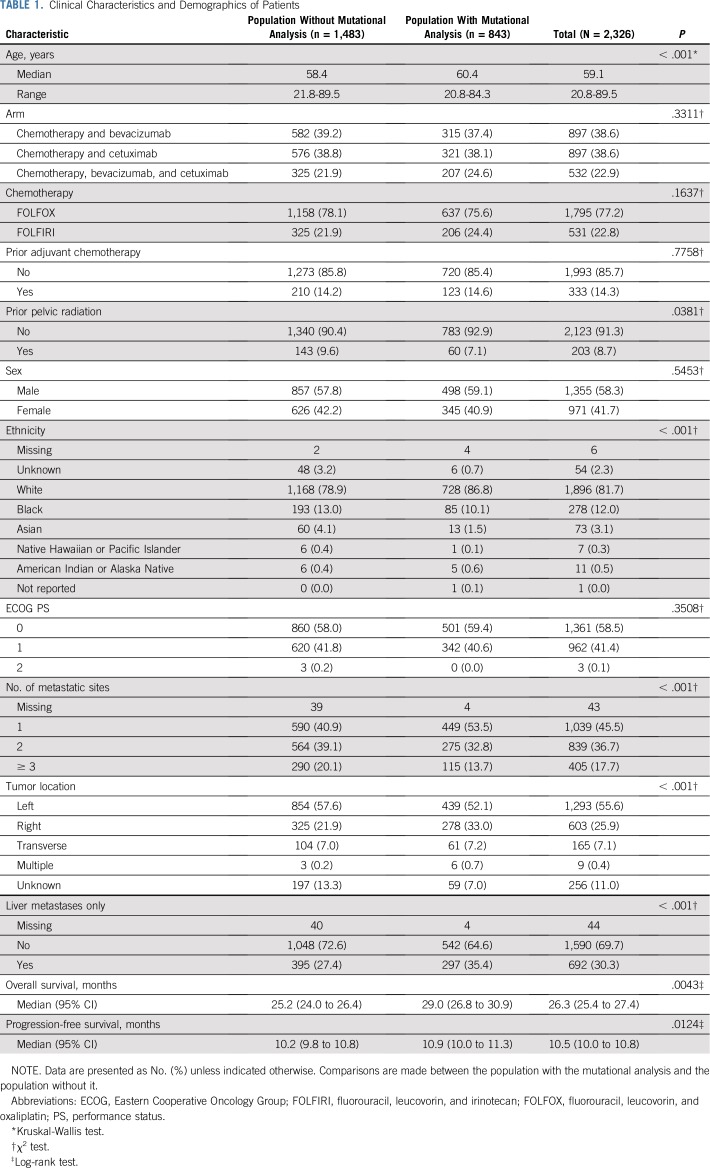
The numbers of patients enrolled in the trial and the specimens used for analyses are in Fig 1. Table 1 reports patient demographics and clinical characteristics. Institutional review board approval was required, and all participating patients provided written informed consent to the genetic analysis.
FIG 1.
CONSORT diagram. MSI, microsatellite instability; MSS, microsatellite stable; PCR, polymerase chain reaction.
TABLE 1.
Clinical Characteristics and Demographics of Patients
Genotyping of Mutation Hotspots
Tumor DNA was obtained from 843 formalin-fixed, paraffin-embedded tumor blocks (92% primary, 4% metastatic, 4% unknown). DNA was extracted by QIAamp DNA formalin-fixed, paraffin-embedded tissue kits (QIAGEN, Hilden, Germany). Allele-specific polymerase chain reaction has been used to genotype mutation hotspots in AKT, APC, BRAF, CTNNB1, EGFR, FBXW7, HRAS, KRAS, NRAS, PIK3CA, and TP53. The analysis was conducted at Genentech (South San Francisco, CA). Methods have been described previously.3 The genotyped mutations and their frequency are in Appendix Table A1 (online only).
Tumor Mutational Burden
Each tumor DNA underwent next-generation sequencing using the FoundationOne platform and was conducted at Foundation Medicine (Cambridge, MA) following standard procedures. The gene list is reported in Appendix Table A2 (online only).
The tumor mutational burden (TMB) in each tumor has been calculated per standard criteria by Foundation Medicine. TMB is reported as the number of mutations divided by the Mb of the genomic region being sequenced.
Microsatellite Instability
The MSI Analysis System (Promega, Madison, WI) has five mononucleotide repeat markers (BAT-25, BAT-26, NR-21, NR-24, MONO-27) and two pentanucleotide markers for sample identification and contamination (Penta C, Penta D). Samples with two or more altered markers were classified as MSI-high (MSI-H), samples with one altered marker were classified as microsatellite instability–low, and samples without altered markers were classified as microsatellite stable (MSS). In the outcome analysis, microsatellite instability–low tumors were grouped with MSS tumors.
Statistical Analysis
The main analysis tested the effect of mutational status on OS in all patients for whom mutational analysis was available, which includes patients enrolled before (59.7% of patients in this study) and after the KRAS amendment. A subgroup analysis was conducted in the primary cohort, such as patients with KRAS WT before the KRAS amendment and all patients after the KRAS amendment, who received either bevacizumab or cetuximab (plus chemotherapy). The distribution of time-to-event end points was estimated by Kaplan-Meier curves. Associations with OS and PFS were tested using the log-rank test. A multivariable stratified Cox model was used to identify the association between a biomarker and time-to-event end points.
Models were adjusted for age, treatment arm, sex, ethnicity, synchronous versus metachronous metastases, number of metastatic sites (0, 1, 2, 3, greater than or equal to 3), primary tumor location (right and transverse v left), MSI-H versus MSS, BRAF (mutant v WT), and extended RAS (mutant v WT) while stratifying for prior adjuvant chemotherapy and prior radiation. The proportional hazard assumption was examined by the Kolmogorov-type supremum test and graphical method using weighted residuals (Appendix).
Univariable, two-group comparisons were performed using Wilcoxon rank-sum, Kruskal-Wallis, and χ2 tests. The two groups are those in Table 1. For the TMB analysis, an optimized cutoff was selected using a previous method that was based on maximizing the log-rank statistics for comparing two groups.4 Interactions between the molecular alteration and treatment arms were also tested by the Wald test. The reported P values (interaction P) in the text are from interaction tests between the molecular alteration and two arms (bevacizumab v cetuximab) in the primary cohort.
A two-sided P value of < .05 was considered statistically significant, with the exception of the interaction test, in which P values < .1 were considered statistically significant. No adjustments were made for multiple comparisons, because some of the analyses (eg, TMB) were neither preplanned nor included in the protocol, and because the clinical study was not powered to detect associations with molecular markers. Data collection and statistical analyses were conducted by the Alliance Statistics and Data Center. All analyses were performed using SAS software version 9.4 (SAS Institute, Cary, NC).
RESULTS
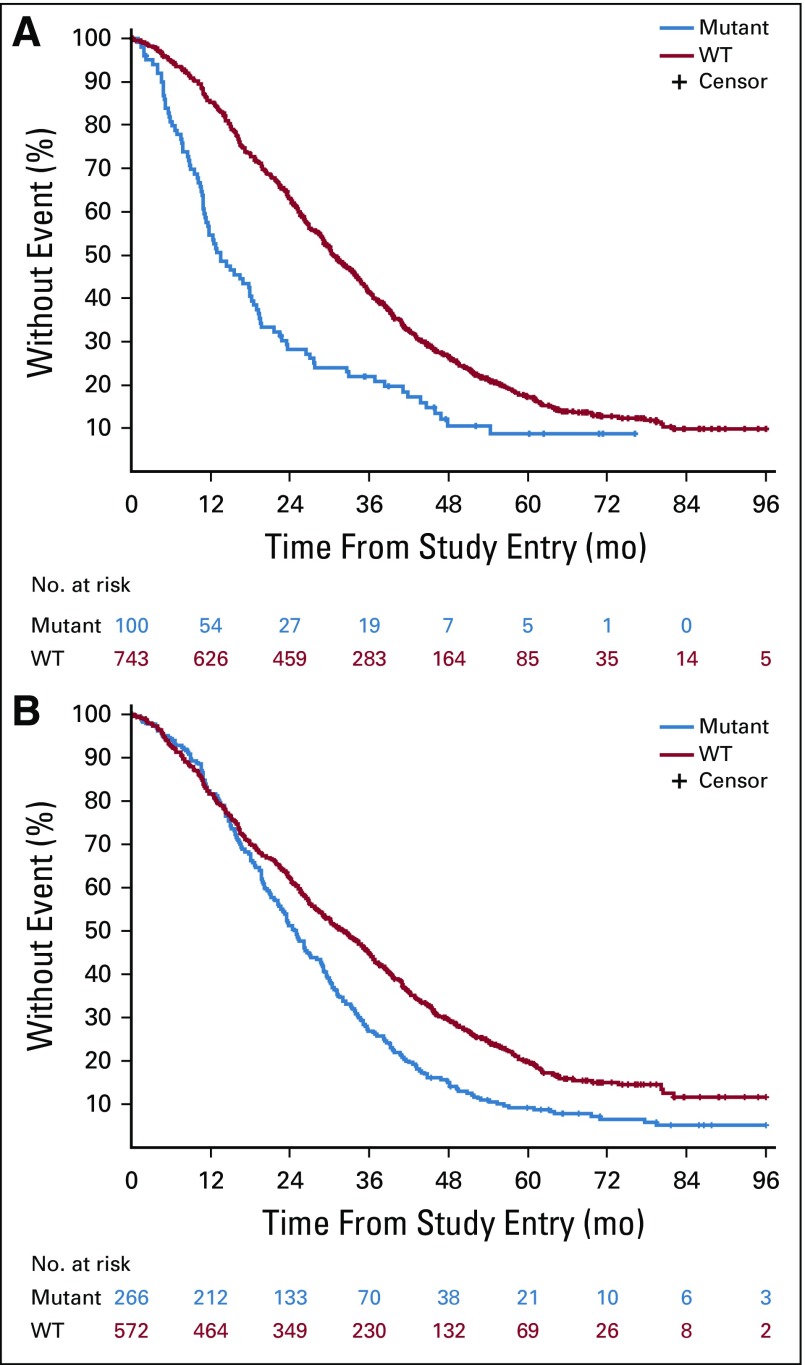
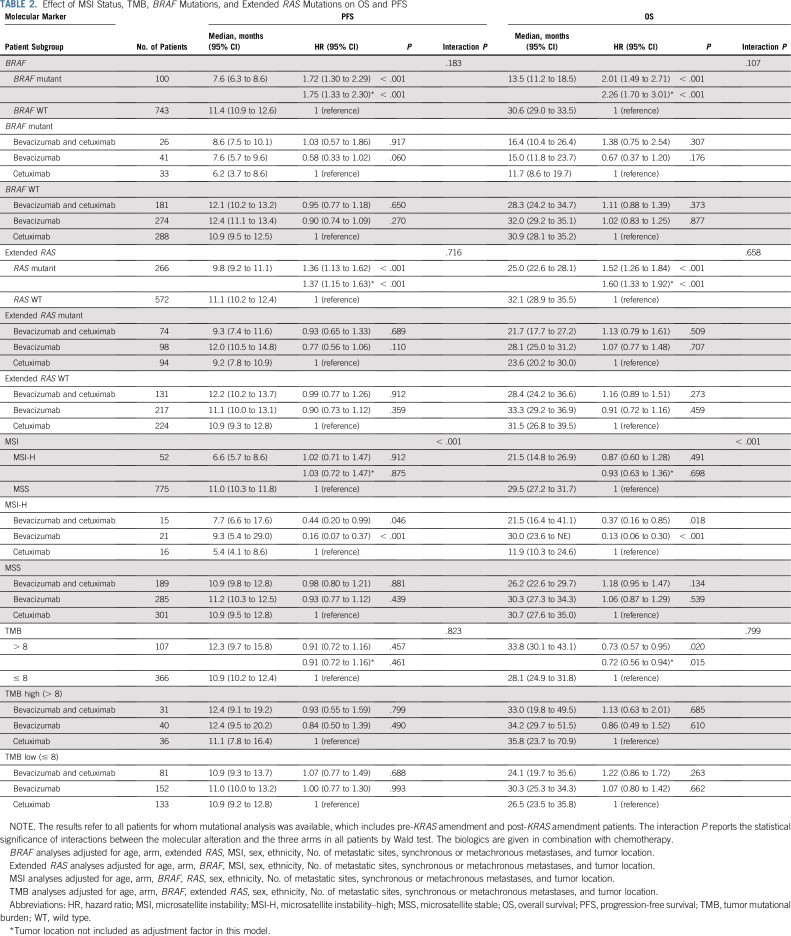
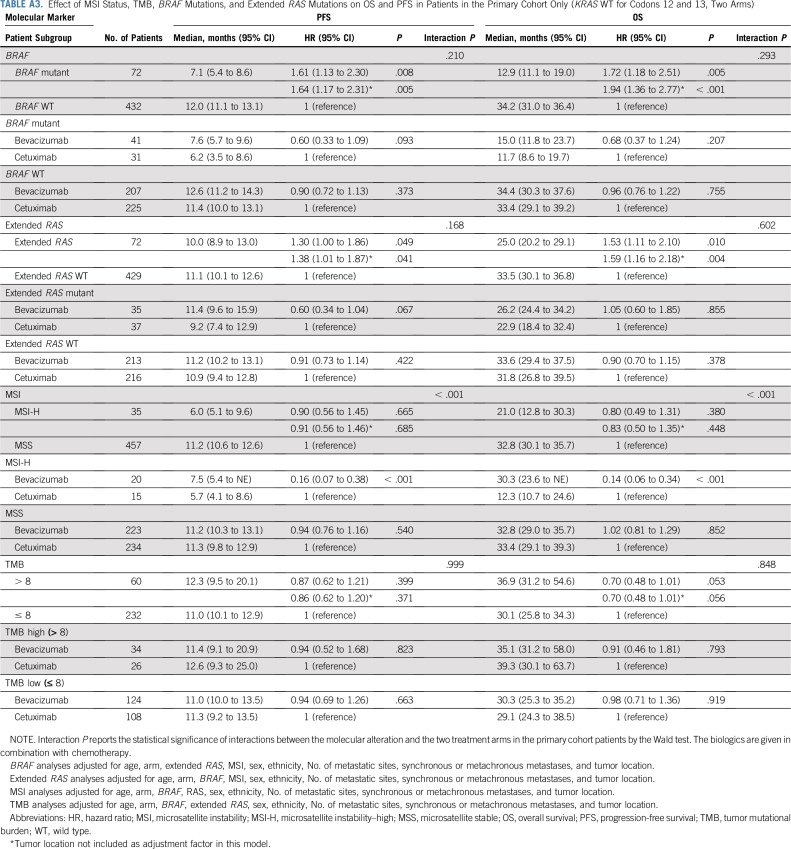
BRAF mutations (12% [100 of 843]) were almost exclusively V600E (98%). Patients with BRAF mutated tumors had a median OS of 13.5 months (95% CI, 11.2 to 18.5 months), and patients with BRAF WT tumors had a median OS of 30.6 months (95% CI, 29.0 to 33.5 months; hazard ratio [HR], 2.01 [95% CI, 1.49 to 2.71]; P < .001; Fig 2 [top]; Table 2). To evaluate the contribution of tumor location to the effect of BRAF mutations, tumor location was removed from the statistical model, and the resulting HR was 2.26 (95% CI, 1.70 to 3.01; P < .001; Table 2). No difference in OS was observed between the two treatment arms (primary cohort) on the basis of BRAF status (interaction P = .293; Appendix Table A3, online only).
FIG 2.
Kaplan-Meier plots of the effect of BRAF mutations (top) and extended RAS mutations (bottom) on overall survival. Log-rank P values are reported from an unadjusted analysis. The results refer to all patients for whom mutational analysis was available, which includes pre-KRAS amendment and post-KRAS amendment patients. WT, wild type.
TABLE 2.
Effect of MSI Status, TMB, BRAF Mutations, and Extended RAS Mutations on OS and PFS
Patients with extended RAS mutant tumors (32% [266 of 838]) had a median OS of 25.0 months (95% CI, 22.6 to 28.1 months), and patients with RAS WT tumors had a median OS of 32.1 months (95% CI, 28.9 to 35.5 months; HR, 1.52 [95% CI, 1.26 to 1.84]; P < .001; Fig 2 [bottom]; Table 2). Removing tumor location from the model does not affect this result (Table 2). No difference in OS was observed between the two treatment arms (primary cohort) on the basis of the RAS status (interaction P = .602; Appendix Table A3).
Patients with triple-negative tumors (WT for NRAS/KRAS/BRAF) had a median OS of 35.9 months (95% CI, 33.0 to 38.8 months) versus 22.2 months in patients with at least one mutated gene in their tumors (95% CI, 19.6 to 24.4 months; P < .001). In the primary cohort, this difference is even more pronounced (36.4 v 19.4 months; P < .001). The presence or absence of a PIK3CA mutation did not change the results of quadruple-negative (WT for NRAS/KRAS/BRAF/PIK3CA) compared with triple-negative tumors (results not shown).
In patients whose tumors were MSI-H (6% [52 of 827]) versus MSS, the HR was 0.87 (95% CI, 0.60 to 1.28; P = .491). Removal of tumor location from the model does not affect this result (Table 2).
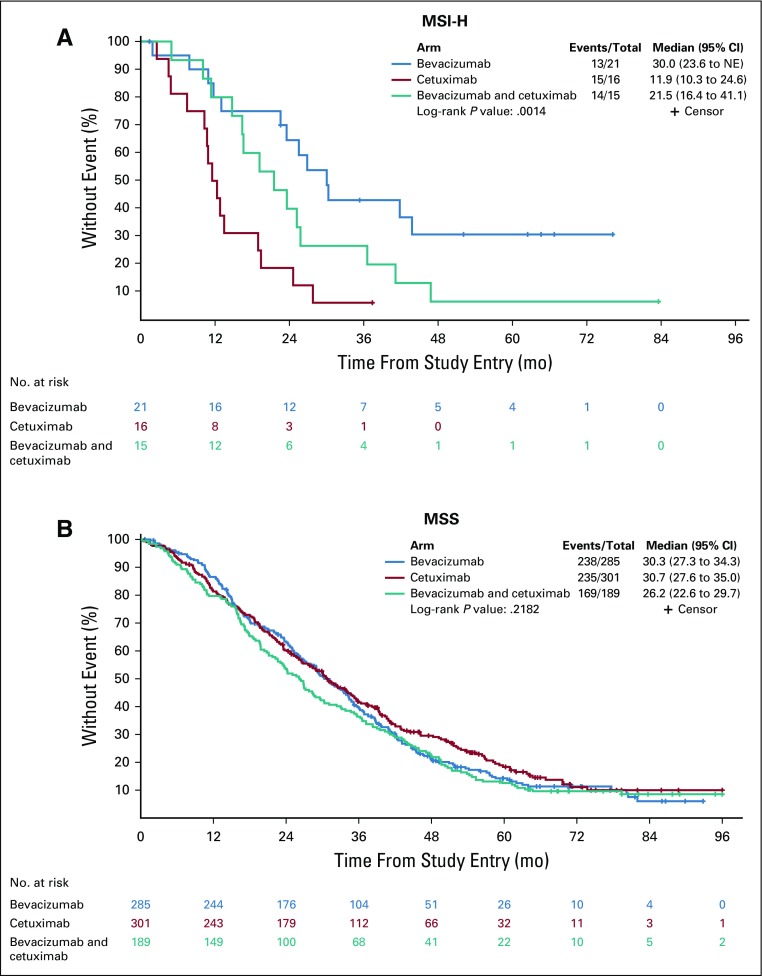
In patients with MSI-H tumors, longer OS was observed in the bevacizumab arm than in the cetuximab arm (HR, 0.13 [95% CI, 0.06 to 0.30]; P < .001; Table 2). In the bevacizumab arm, median OS was 30.0 months (95% CI, 23.6 months to NE) versus 11.9 (95% CI, 10.3 to 24.6 months) in the cetuximab arm (Fig 3). In patients with MSS tumors, no difference was observed between the two arms (P = .539; Table 2). There is a differential treatment effect across microsatellite instability status (interaction P < .001, primary cohort).
FIG 3.
Kaplan-Meier plots of the effect of microsatellite status on overall survival on the basis of treatment arm (microsatellite instability–high [MSI-H], top; microsatellite stable [MSS], bottom). Log-rank P values are reported from an unadjusted analysis. The results refer to all patients for whom mutational analysis was available, which includes pre-KRAS amendment and post-KRAS amendment patients. The proportions of right and transverse and left tumors in MSI-H tumors are 79.2% and 20.8%, respectively.
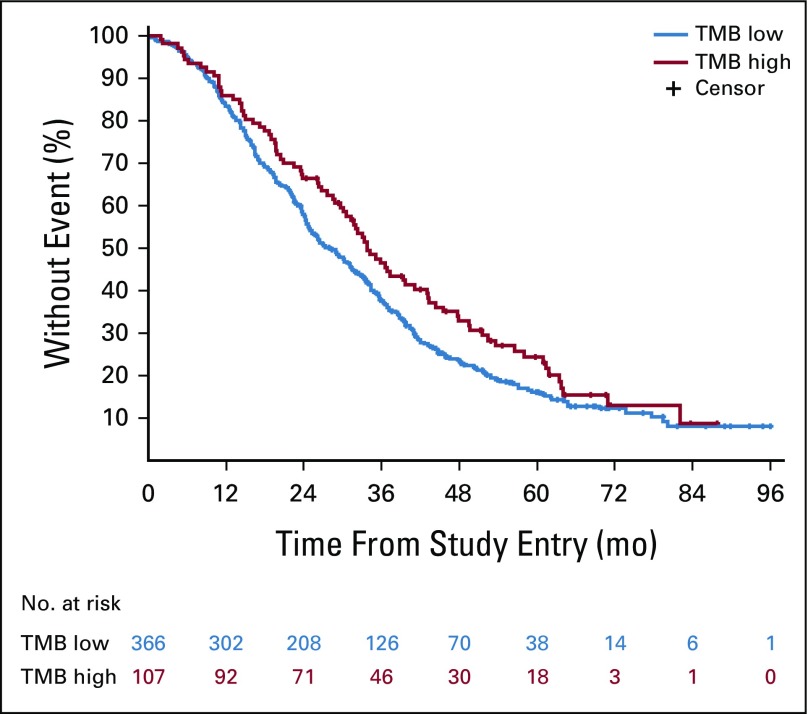
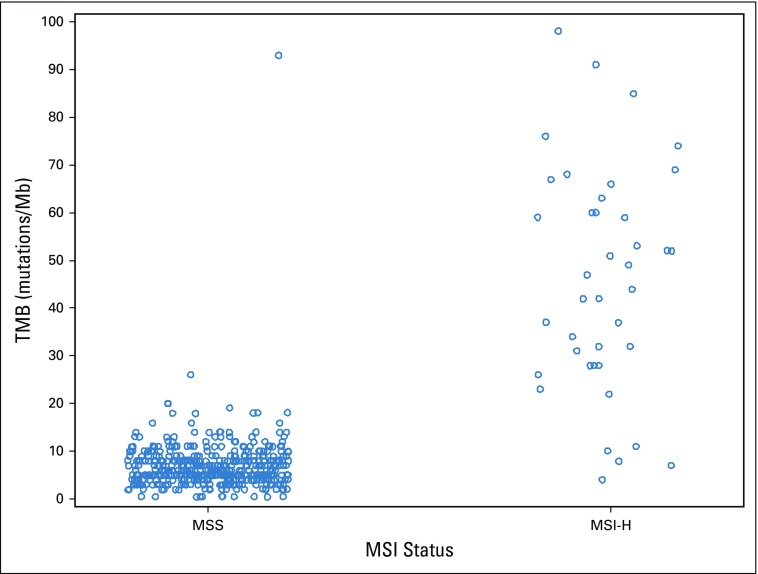
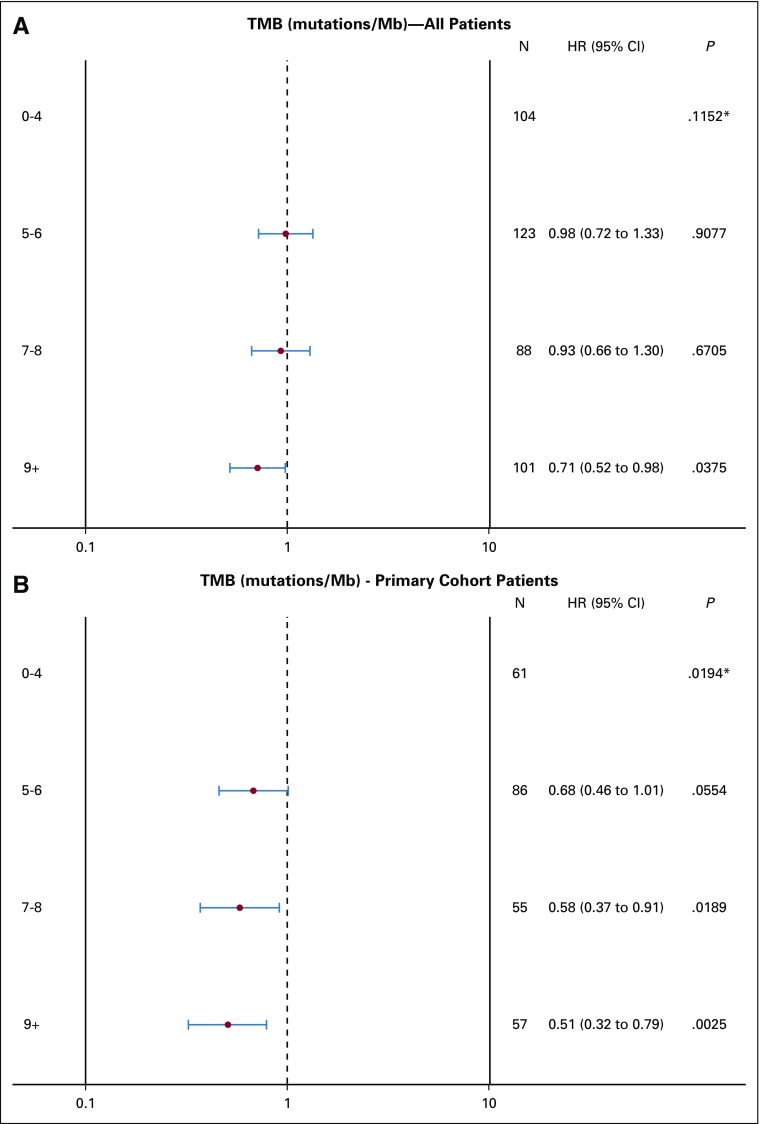
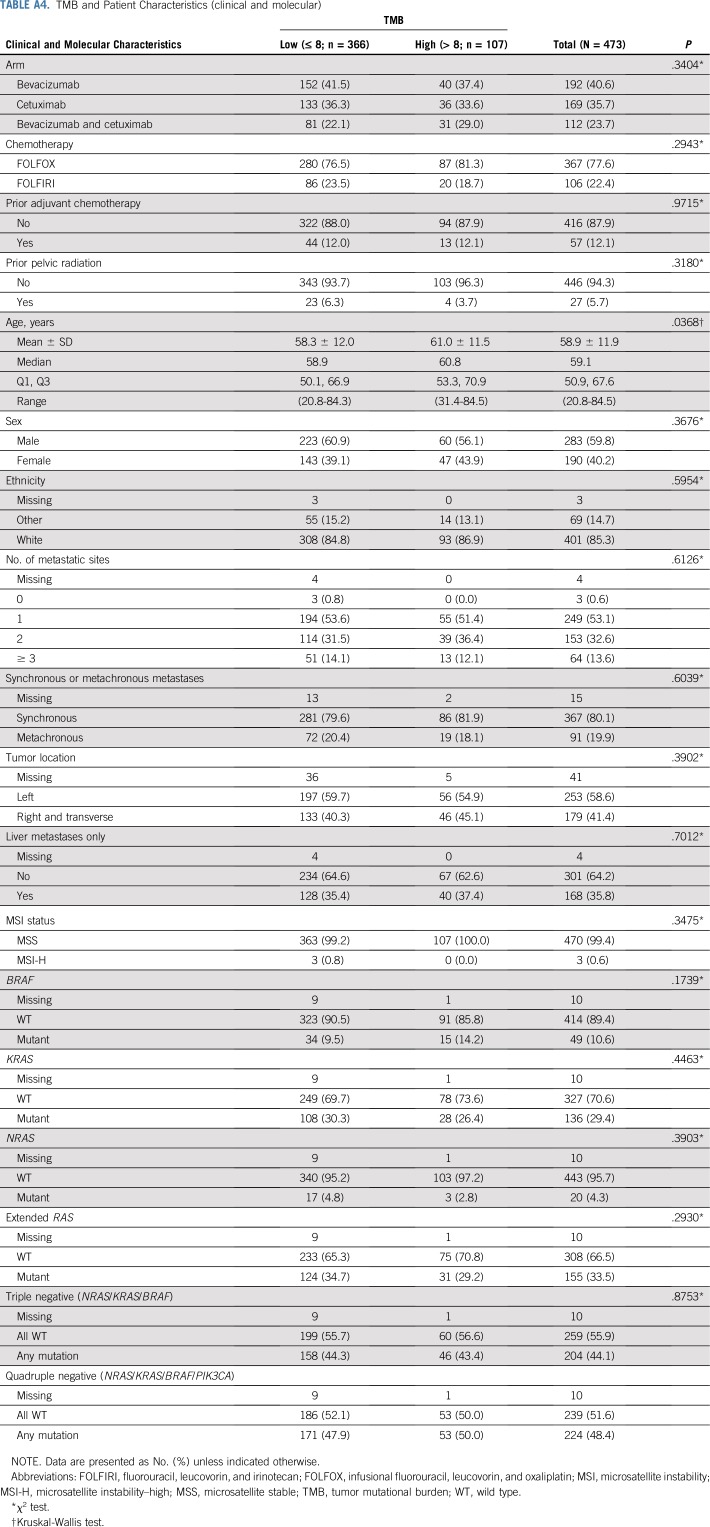
TMB was available from 536 patients. In patients with MSI-H tumors (n = 35), the median TMB was 52 mutations/Mb (range, 11 to 208 mutations/Mb), and in patients with MSS tumors (n = 475), the median TMB was six mutations/Mb (range, 0 to 361 mutations/Mb; Appendix Fig A2). Two patients in the MSS group had a high TMB (93 and 361 mutations/Mb) and were excluded from the analysis. In patients with MSS tumors, on the basis of an optimized TMB cutoff of eight mutations/Mb, there were 366 patients with eight or fewer mutations/Mb in their tumors who were classified as TMB low (77%), and the other 107 patients with more than eight mutations/Mb in their tumors were classified as TMB high (23%). No major differences in patient and tumor characteristics were noted between patients with TMB-high and TMB-low tumors (Appendix Table A4, online only). Patients with TMB-high tumors had a median OS of 33.8 months (95% CI, 30.1 to 43.1 months), and patients with TMB-low tumors had a median OS of 28.1 months (95% CI, 24.9 to 31.8 months; HR, 0.73 [95% CI, 0.57 to 0.95]; P = .020; Fig 4). Removing tumor location from the model does not affect this result (Table 2). No difference in OS was observed between the two treatment arms (primary cohort) on the basis of TMB status (interaction P = .848; Appendix Table A3). An inverse correlation was observed between TMB and HRs (Appendix Fig A3). The results of these associations with OS and PFS when including only patients in the primary cohort are reported in Appendix Table A3. Mutations in APC, PIK3CA, and TP53 (mutations in FBXW7 were not included because of their low prevalence) were not associated with outcome (P > .05, results can be provided on request).
FIG 4.
Kaplan-Meier plots of the effect of tumor mutational burden (TMB) status on overall survival. Log-rank P values are reported from an unadjusted analysis. The results refer to all patients for whom mutational analysis was available, which includes pre-KRAS amendment and post-KRAS amendment patients. In TMB-high tumors, the proportions of right and transverse and left tumors were 45.1% and 54.9%, respectively. In TMB-low tumors, the proportions of right and transverse and left tumors were 40.3% and 59.7%, respectively.
DISCUSSION
In CALGB/SWOG 80405, the presence or absence of MSI-H, high-TMB, BRAF, and extended RAS mutations define patient subgroups with different outcomes. To our knowledge, this study provides the first indication that TMB correlates with the prognosis of patients with CRC with MSS tumors. TMB, the cumulative number of somatic DNA point mutations, describes the level of genomic instability in each patient’s tumor. Patients with nonhypermutated MSS tumors (93% of patients in our study) had different OS on the basis of whether their TMB was classified as high or low. Patients with a high TMB had better OS than did patients with a low TMB (Fig 4). A high TMB probably reflects the presence of mutation-associated neoantigens, with consequent increased lymphocyte infiltration in the tumor microenvironment. This phenomenon has been observed even in MSS tumors.5 A subset of MSS tumors are immunogenic, and patients with that subgroup of tumors have a different risk of relapse. In stage I to III CRCs, up to 50% of MSS tumors have a high immunoscore.6 An elevated neoantigen load and/or high immunoscore was associated with better survival.5,6 It has also been demonstrated that 16% of nonhypermutated MSS tumors have an immunophenotype similar to that of MSI-H tumors.7 In our study, detecting a high TMB in patients with stage IV MSS might identify tumors with a favorable immune microenvironment.
In patients with MSS mCRC in this study, the effect of TMB on OS is not as strong as other markers (eg, BRAF), and its relevance to direct therapy is still to be determined. Because the relevance of TMB in this setting is more biologic than clinical, additional analyses should evaluate which TMB-high MSS tumors are immunogenic and which mutations give rise to neoantigens that elicit an antitumoral, adaptive response.
With the recent US Food and Drug Administration approval of checkpoint inhibitors for the treatment of patients with MSI-H mCRC refractory to standard chemotherapy, MSI-H testing is now requested routinely. In our study, MSI-H status did not confer a prognostic effect after multivariable adjustment. It should be noted that patients with MSI-H tumors, when not adjusted by all the other covariables in the model, exhibited a trend to a worse outcome, suggesting that it may be a negative prognostic marker (median OS, 21.5 months [95% CI, 14.8 to 26.9 months] v 29.5 months [95% CI, 27.2 to 31.7 months] in patients with MSS tumors; P = .087). When patients with MSI-H tumors received chemotherapy and bevacizumab, this treatment conferred a survival advantage over chemotherapy and cetuximab (Fig 3). In the chemotherapy and bevacizumab arm, median OS was 30.0 months versus 11.9 months in the chemotherapy and cetuximab arm, almost a threefold difference. No difference between the two arms has been observed in the MSS group. The effect of MSI-H is observed in a small subset but is corroborated by several lines of evidence. A beneficial effect of FOLFOX and bevacizumab compared with FOLFOX and placebo was reported in patients with MSI-H tumors (and, again, not in patients with MSS tumors) with stage II to III disease.8 This observation is important because the effect of bevacizumab is against placebo, pointing toward a predictive role of MSI-H. Patients with CMS1 tumors (enriched with MSI-H) show increased OS in the chemotherapy and bevacizumab arm over the chemotherapy and cetuximab arm.9 The contribution of resistance to EGFR inhibitors in patients with MSI-H tumors cannot be excluded, as suggested by a reduced efficacy of cetuximab in tumors originating in the right or transverse colon (also enriched with MSI-H) compared with those tumors originating in the left colon.10,11 It is also interesting to observe that in CALGB/SWOG 80405, the effect of the chemotherapy and bevacizumab and cetuximab arm on OS is intermediate between the arms with the single biologics (Fig 3).
What is the biologic underpinning of the effect of MSI-H on the activity of biologics? We hypothesize a concurrent effect on both cetuximab (negative) and bevacizumab (positive). For the effect on cetuximab, it is well established that hypermethylation typical of MSI-H tumors results in lower expression of EGFR ligands,12 reducing the efficacy of EGFR inhibitors.13,14 For the effect of bevacizumab, vessel normalization induced by bevacizumab correlated with immunostimulatory pathways, especially Th1 lymphocyte infiltration and activity,15 possibly potentiating the antitumor effects of an already T-cell–infiltrated and activated microenvironment, such as that of MSI-H tumors.
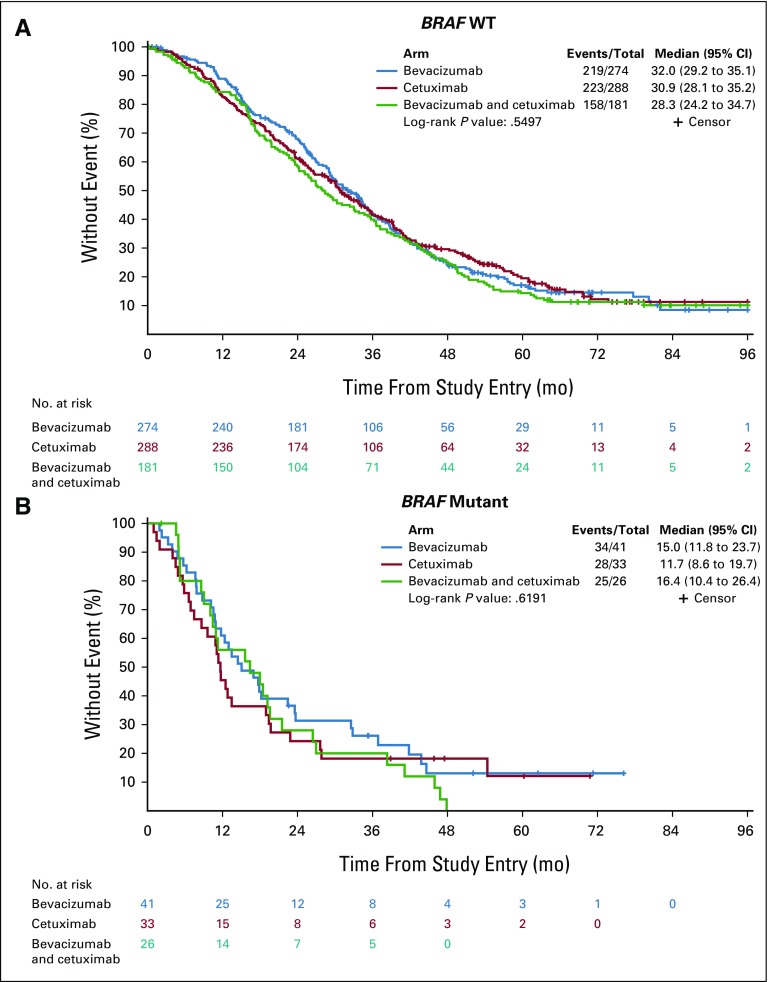
This study represents one of the largest series on the negative prognostic effect of BRAF V600E in a single clinical trial in the first-line setting of mCRC. Although BRAF V600E is more prevalent in right and transverse (81%) versus left (19%) tumors, removal of tumor location as an adjusting covariable does not modify the effect of BRAF V600E HR by a great extent (HR from 2.01 to 2.26, Table 2), suggesting that BRAF V600E has an effect on survival that is independent of tumor location. By looking at the effect of treatment, despite a weak signal of improved OS in the chemotherapy and bevacizumab arm compared with the chemotherapy and cetuximab arm in patients with BRAF V600E tumors (HR, 0.67 [95% CI, 0.37 to 1.20]; P = .176; Appendix Fig A4; Table 2), median OS remains poor in both arms (15.0 and 11.7 months, respectively), as also reported in FIRE-3.16
The analysis of extended RAS clearly supports a negative prognostic effect. Patients with RAS mutant tumors have worse OS than do patients with RAS WT tumors, irrespective of treatment (Fig 2 [bottom]; Table 2). A detrimental effect of RAS mutations in patients enrolled in the chemotherapy and cetuximab arm compared with the chemotherapy and bevacizumab arm is more evident in the primary cohort for PFS (median, 9.2 v 11.4 months; P = .006) than for OS (median, 22.9 v 26.2 months; P = .855), probably because of the compensatory effects of postprogression therapies.2
One potential limitation of this article is that the mutational analysis was not available from all patients enrolled in the trial, particularly for TMB. This is a limitation for studies such as this one that use material from primary tumors retrospectively, because specimen collection might introduce bias.
In conclusion, molecular DNA analysis of tumor alterations in patients with mCRC can provide new tools to predict patient outcome and improve therapeutic decision making. Molecularly driven, novel immunotherapy-based combinations are urgently needed in patients with first-line MSS mCRC. In patients with MSI-H tumors, if the benefit of bevacizumab combined with chemotherapy is further confirmed, this regimen could be a preferable therapeutic option in patients with MSI-H, either as front-line therapy or in patients who are not responsive and/or suffer from clinical and financial toxicity of checkpoint inhibitors. Additional evaluation of the neoantigen-specific T-cell responses associated with TMB is needed to identify new targets and pathways and to guide the testing of targeted interventions. TMB can be obtained readily using a reliable and simple US Food and Drug Administration–approved diagnostic test that is often used in the clinic.
APPENDIX
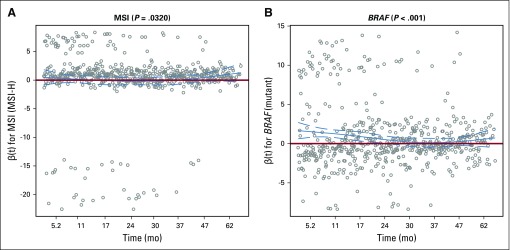
The proportional hazard assumption was examined by the Kolmogorov-type supremum test and graphical method using weighted residuals (Grambsch PM, Therneau TM: Biometrika 81:515-526, 1994). On the basis of the Kolmogorov-type supremum test, microsatellite instability (MSI) status and BRAF status violated the proportional hazard assumption. After closer examination of the weighted residual figures (Fig A5), it seems that the nonproportionality for MSI status is probably inconsequential because the confidence band for the time-varying coefficient covers 0 at all time and we reported a nonsignificant prognostic effect (Fig A5A). For BRAF, it does seem that there is a slightly diminished effect over time (Fig A5A and B). The negative prognostic effect is strong for the first 2 years after registration but then diminishes toward the null after 2 years. Given that the hazard ratio (HR) is still the most widely accepted method of reporting time-to-event end points and the fact that the effect never crosses 0 (ie, maintaining a negative prognostic effect), we reported the HR for BRAF in this article. When nonproportionality exists, the HR is simply an average of the time-varying effect over time; therefore, the HR may be pulled toward the null. Even so, because BRAF is a known negative prognostic factor, the HR has still a big effect size. Therefore, we decided to report the HR because it is easier to understand than a time-varying coefficient.
FIG A1.
Flow chart of patients by arm, KRAS status, and amendments (amendment 5: to enroll only KRAS WT for codon 12/13, amendment 6: to stop the bevacizumab-cetuximab [Bev+Cet] combination arm).
FIG A2.
Tumor mutational burden (TMB) values by microsatellite instability (MSI) status. One hypermuytated outlier in the microsatellite stable (MSS) group (TMB=361) and one hypermutated outlier in the microsatellite instability–high (MSI-H) group (TMB=208) are not shown in the figure.
FIG A3.
Inverse correlation between tumor mutational burden (TMB) and hazard ratio (HR) of overall survival (A) in all patients and (B) in the primary cohort patients. (*) A 3-degree-of-freedom test for detecting whether there is any difference in outcome across different TMB levels.
FIG A4.
Kaplan-Meier plots of the effect of BRAF mutations on overall survival based upon treatment arm: (A) BRAF wild type (WT) or (B) BRAF mutant. Almost all BRAF mutations are V600E except for two patients. Log-rank P values are reported from an unadjusted analysis. The results refer to all patients from whom mutational analysis was available, which includes pre-KRAS amendment and post-KRAS amendment patients.
FIG A5.
Smoothed scaled Schoenfeld residual plots. MSI, microsatellite instability; MSI-H, microsatellite instability–high.
TABLE A1.
Somatic Mutations: Type and Frequency
TABLE A2.
Gene List of the FoundationOne Platform
TABLE A3.
Effect of MSI Status, TMB, BRAF Mutations, and Extended RAS Mutations on OS and PFS in Patients in the Primary Cohort Only (KRAS WT for Codons 12 and 13, Two Arms)
TABLE A4.
TMB and Patient Characteristics (clinical and molecular)
Footnotes
The views expressed in this article are those of the authors.
Presented, in part, at the ASCO Annual Meeting, Chicago, IL, on June 2, 2017.
Supported by Grants U10CA180821, U10CA180882, and U24CA196171 to CALGB/SWOG 80405.
AUTHOR CONTRIBUTIONS
Conception and design: Federico Innocenti, Xueping Qu, Tyler J. Zemla, Donna Niedzwiecki, Richard M. Goldberg, Monica M. Bertagnolli, Charles D. Blanke, Alan P. Venook, Heinz-Josef Lenz, Omar Kabbarah
Financial support: Federico Innocenti, Monica M. Bertagnolli
Administrative support: Federico Innocenti, Richard M. Goldberg, Monica M. Bertagnolli
Provision of study materials or patients: Federico Innocenti, Xueping Qu, Richard M. Goldberg, Monica M. Bertagnolli, Charles D. Blanke, Blasé Polite, Heinz-Josef Lenz
Collection and assembly of data: Fang-Shu Ou, Xueping Qu, Tyler J. Zemla, Donna Niedzwiecki, Rachel Tam, Shilpi Mahajan, Richard M. Goldberg, Monica M. Bertagnolli, Charles D. Blanke, James Atkins, Alan P. Venook, Heinz-Josef Lenz, Omar Kabbarah
Data analysis and interpretation: Federico Innocenti, Fang-Shu Ou, Tyler J. Zemla, Rachel Tam, Shilpi Mahajan, Richard M. Goldberg, Monica M. Bertagnolli, Hanna Sanoff, Blasé Polite, Alan P. Venook, Heinz-Josef Lenz, Omar Kabbarah
Manuscript writing: All authors
Final approval of manuscript: All authors
Accountable for all aspects of the work: All authors
AUTHORS' DISCLOSURES OF POTENTIAL CONFLICTS OF INTEREST
Mutational Analysis of Patients With Colorectal Cancer in CALGB/SWOG 80405 Identifies New Roles of Microsatellite Instability and Tumor Mutational Burden for Patient Outcome
The following represents disclosure information provided by authors of this manuscript. All relationships are considered compensated. Relationships are self-held unless noted. I = Immediate Family Member, Inst = My Institution. Relationships may not relate to the subject matter of this manuscript. For more information about ASCO's conflict of interest policy, please refer to www.asco.org/rwc or ascopubs.org/jco/site/ifc.
Federico Innocenti
Patents, Royalties, Other Intellectual Property: Royalties from the Mayo Foundation on the UGT1A1 testing
Xueping Qu
Employment: Genentech, BeiGene (I)
Stock and Other Ownership Interests: Genentech, BeiGene (I0
Honoraria: Genentech, BeiGene (I)
Rachel Tam
Employment: Genentech
Stock and Other Ownership Interests: Genentech
Shilpi Mahajan
Other Relationship: Genentech
Richard M. Goldberg
Consulting or Advisory Role: Merck, Taiho Pharmaceutical, Merck KGaA
Research Funding: Bristol-Myers Squibb
Travel, Accommodations, Expenses: Merck KGaA, Merck
Monica Bertagnolli
Leadership: Leap Therapeutics
Consulting or Advisory Role: Syntimmune, Syntalogic
Research Funding: AbbVie (Inst), Agenus (Inst), Astellas Pharma (Inst), AstraZeneca (Inst), Breast Cancer Research Foundation (Inst), Bristol-Myers Squibb (Inst), Celgene (Inst), Complion (Inst), Exelixis (Inst), Genentech (Inst), GHI Pharma (Inst), Gilead Sciences (Inst), GlaxoSmithKline (Inst), Incyte (Inst), Jazz Pharmaceuticals (Inst), Leidos (Inst), Eli Lilly (Inst), Matrex (Inst), Mayo Clinic (Inst), MGH (Inst), Millenium Pharmaceuticals (Inst), Novartis (Inst), Patient-Centered Outcomes Research Institute (Inst), Pfizer (Inst), Robert Wood Johnson Foundation (Inst), Sagerock Advisors (Inst), Taiho Pharmaceutical (Inst), Bayer Health (Inst), Eisai (Inst), Leidos (Inst), Lexicon Pharmaceuticals (Inst), Merck (Inst), Pharmacyclics (Inst), Takeda Pharmaceuticals (Inst), Tesaro (Inst), Baxalta (Inst), Sanofi (Inst), Teva Pharmaceuticals Industries (Inst), Janssen (Inst), Merck (Inst)
Hanna Sanoff
Research Funding: Bayer AG (Inst), Merck (Inst)
Blasé Polite
Research Funding: Merck
Other Relationship: Gerson Lehrman Group
Alan P. Venook
Consulting or Advisory Role: Taiho Pharmaceutical, Bayer AG, Halozyme Therapeutics, Eisai
Research Funding: Genentech (Inst), Bristol-Myers Squibb (Inst)
Patents, Royalties, Other Intellectual Property: Royalties from Now-UptoDate for authoring and maintaining two chapters
Travel, Accommodations, Expenses: Genentech, Roche, Halozyme Therapeutics, Bayer AG
Heinz-Josef Lenz
Honoraria: Merck Serono, Roche, Bayer AG, Boehringer Ingelheim
Consulting or Advisory Role: Merck Serono, Roche, Bayer AG, Pfizer
Travel, Accommodations, Expenses: Merck Serono, Bayer AG, Roche
Omar Kabbarah
Employment: Genentech
Stock and Other Ownership Interests: Genentech
No other potential conflicts of interest were reported.
REFERENCES
- 1.Siegel RL, Miller KD, Fedewa SA, et al. Colorectal cancer statistics, 2017. CA Cancer J Clin. 2017;67:177–193. doi: 10.3322/caac.21395. [DOI] [PubMed] [Google Scholar]
- 2.Venook AP, Niedzwiecki D, Lenz HJ, et al. Effect of first-line chemotherapy combined with cetuximab or bevacizumab on overall survival in patients with KRAS wild-type advanced or metastatic colorectal cancer: A randomized clinical trial. JAMA. 2017;317:2392–2401. doi: 10.1001/jama.2017.7105. [DOI] [PMC free article] [PubMed] [Google Scholar]
- 3. doi: 10.1371/journal.pone.0090761. Schleifman EB, Tam R, Patel R, et al: Next generation MUT-MAP, a high-sensitivity high-throughput microfluidics chip-based mutation analysis panel. PLoS One 9:e90761, 2014 [Erratum: PLoS One 9:e96019, 2014] [DOI] [PMC free article] [PubMed] [Google Scholar]
- 4.Contal C, O’Quigley J. An application of changepoint methods in studying the effect of age on survival in breast cancer. Comput Stat Data Anal. 1999;30:253–270. [Google Scholar]
- 5. doi: 10.1016/j.celrep.2016.03.075. Giannakis M, Mu XJ, Shukla SA, et al: Genomic correlates of immune-cell infiltrates in colorectal carcinoma. Cell Reports 15:857-865, 2016 [Erratum: Cell Reports, 2016] [DOI] [PMC free article] [PubMed] [Google Scholar]
- 6.Mlecnik B, Bindea G, Angell HK, et al. Integrative analyses of colorectal cancer show immunoscore is a stronger predictor of patient survival than microsatellite instability. Immunity. 2016;44:698–711. doi: 10.1016/j.immuni.2016.02.025. [DOI] [PubMed] [Google Scholar]
- 7.Angelova M, Charoentong P, Hackl H, et al. The colorectal cancer immune paradox revisited. OncoImmunology. 2015;5:e1078058. doi: 10.1080/2162402X.2015.1078058. [DOI] [PMC free article] [PubMed] [Google Scholar]
- 8.Pogue-Geile K, Yothers G, Taniyama Y, et al. Defective mismatch repair and benefit from bevacizumab for colon cancer: Findings from NSABP C-08. J Natl Cancer Inst. 2013;105:989–992. doi: 10.1093/jnci/djt140. [DOI] [PMC free article] [PubMed] [Google Scholar]
- 9. Lenz H-J, Ou F-S, Venook AP, et al: Impact of consensus molecular subtyping (CMS) on overall survival (OS) and progression free survival (PFS) in patients (pts) with metastatic colorectal cancer (mCRC): Analysis of CALGB/SWOG 80405 (Alliance). J Clin Oncol 35:3511-3511, 2017.
- 10. doi: 10.1001/jamaoncol.2016.3797. Tejpar S, Stintzing S, Ciardiello F, et al: Prognostic and predictive relevance of primary tumor location in patients with RAS wild-type metastatic colorectal cancer: Retrospective analyses of the CRYSTAL and FIRE-3 trials. JAMA Oncol [epub ahead of print on October 10, 2016] [DOI] [PMC free article] [PubMed] [Google Scholar]
- 11.Arnold D, Lueza B, Douillard JY, et al. Prognostic and predictive value of primary tumour side in patients with RAS wild-type metastatic colorectal cancer treated with chemotherapy and EGFR directed antibodies in six randomized trials. Ann Oncol. 2017;28:1713–1729. doi: 10.1093/annonc/mdx175. [DOI] [PMC free article] [PubMed] [Google Scholar]
- 12.Lee MS, McGuffey EJ, Morris JS, et al. Association of CpG island methylator phenotype and EREG/AREG methylation and expression in colorectal cancer. Br J Cancer. 2016;114:1352–1361. doi: 10.1038/bjc.2016.87. [DOI] [PMC free article] [PubMed] [Google Scholar]
- 13.Stahler A, Heinemann V, Giessen-Jung C, et al. Influence of mRNA expression of epiregulin and amphiregulin on outcome of patients with metastatic colorectal cancer treated with 5-FU/LV plus irinotecan or irinotecan plus oxaliplatin as first-line treatment (FIRE 1-trial) Int J Cancer. 2016;138:739–746. doi: 10.1002/ijc.29807. [DOI] [PubMed] [Google Scholar]
- 14.Pentheroudakis G, Kotoula V, De Roock W, et al. Biomarkers of benefit from cetuximab-based therapy in metastatic colorectal cancer: Interaction of EGFR ligand expression with RAS/RAF, PIK3CA genotypes. BMC Cancer. 2013;13:49. doi: 10.1186/1471-2407-13-49. [DOI] [PMC free article] [PubMed] [Google Scholar]
- 15.Tian L, Goldstein A, Wang H, et al. Mutual regulation of tumour vessel normalization and immunostimulatory reprogramming. Nature. 2017;544:250–254. doi: 10.1038/nature21724. [DOI] [PMC free article] [PubMed] [Google Scholar]
- 16.Stintzing S, Miller-Phillips L, Modest DP, et al. Impact of BRAF and RAS mutations on first-line efficacy of FOLFIRI plus cetuximab versus FOLFIRI plus bevacizumab: Analysis of the FIRE-3 (AIO KRK-0306) study. Eur J Cancer. 2017;79:50–60. doi: 10.1016/j.ejca.2017.03.023. [DOI] [PubMed] [Google Scholar]


