

Abstract
An accurate knowledge of the surface tension of liquid metals is critical for many theoretical and practical applications, especially in the current context of emerging growth of nanotechnology. The surface tension and its temperature dependence are drastically influenced by the level of impurities in the metal such as oxygen, sulphur or carbon. For this reason, experimental surface tension data of metals reported in literature are scattered. Strictly speaking, when referring to the surface tension of liquid metals, both variables temperature and oxygen content must be specified. There exists no clear formalism describing the coupling effect temperature and the oxygen content upon the surface tension of liquid metals. The aim of this work is to fill this gap. A thermodynamically self-consistent formulation for the surface tension of liquid metals and semiconductors as a function of temperature and oxygen content is established. According to the proposed formalism, a reliable expression for the surface tension of pure and oxygen saturated metals is then derived. The proposed model is found to be in good agreement with available experimental data, showing a good predictive capability. Aluminium is chosen and thoroughly evaluated as a case study, due to its very high sensitivity to oxygen level. Its surface tension is explicitly formulated as a function of temperature and oxygen content.
Subject terms: Surfaces, interfaces and thin films; Chemical physics; Surfaces, interfaces and thin films; Chemical physics
Introduction
Although the surface tension of liquid metals has been extensively studied for nearly a century, both from an experimental and a theoretical point of view, there is still no clear value of the surface of tension liquid metals. In general, the surface tension decreases linearly with temperature:
| 1 |
where σ0 and denote respectively the surface tension and its temperature derivative, assumed to be constant, at Tm (melting temperature). Equation 1 has proven reliable in a wide range of temperature, a least up to TC/2, TC being the crtical temperature. The experimental values of both σ0 and σ′ reported in the litterature are often scattered, not only because of the errors inherent to experimental methods, but also because they are strongly influenced by the presence of impurities at the surface of the liquid. For instance, the reported value of σ0 for aluminium is very often: 0.85 N.m−1 1. However, this value is not for pure aluminum but for aluminium saturated in oxygen. Indeed, because Al and O have a strong chemical affinity, a few ppm of O2 reacts with Al to form an Al2O3 monolayer at the surface. The oxide monolayer causes a drastical decrease of the surface tension, from 1.05 ± 0.05 N.m−1 to 0.85 ± 0.05) N.m−1 2,3. This example reflects the surface tension’s extreme sensitivity to oxygen, and more generally to impurities such as S, C, P. This could impact the alloy and process design of many industrial applications, in particular those in a controlled atmosphere. In the literature, several studies report a value of σ′, however no consensus can be established as there is a dispersion of over 100% in reported data1. Inconsistencies in experimental data cannot be harmonized by a critical assessment as the impurity content must be considered as a variable. The primary purpose of this work is to establish a clear and reliable formalism to describe the surface tension as a function of both temperature and oxygen content.
In our recent work, considering the Gibbs adsorption isotherm concept, we have shown that the oxygen content (xO) dependence upon surface tension can be by first degree approximation assumed to be directly proportional to the value of the surface tension at a given temperature: (∂σ/∂xO) ∝ σ. By integration, the following expression has be formulated4:
| 2 |
where and are respectively the full coverage oxygen adsorption at the liquid surface and the oxygen content at full coverage (saturation). Both parameters and ξO are universal constants, i.e. identical for all elements. Their values were determined by Gheribi et al.4 as: and ξO = 7.422. can be determined from the lattice constants of the corresponding metal-oxyde monoxide using the well established Kozakevitch’s approximation given by5:
| 3 |
where A is the mesh surface, nO the number of oxygen at the mesh surface and NA the Avogadro number. For monoxide, nO = 2. In practice, A is defined as , with Vm,o and nc are respectively the molar volume of the monoxide at standard temperature (298.15 K) and the number of atoms per unit cell6. In a nutshell, in this formalism (Eq. 2) there is no adjustable parameter, provided that σ0(T) and are known. is determined from phase equilibria and crystallographic data and in general it is known with an appreciable accuarcy while σ0(T) is not well defined for most elements, especially those with a significant reactivity with oxygen. Indeed, most of the time, the reported values for σ0(T) are underestimated, as they are related to experiments performed with contaminated samples (with non-metallic impurities, in particular oxygen). In practice, there is no clear formalism describing the surface tension of pure elements as a function of temperature but also the temperature-impurities content coupling effect upon the surface tension of metals. Naturally, several assessements and recommended parameters for Eq. 1 can be found in the litterature, see e.g.1,7–10, however none of them clearly recommends values for temperature dependent surface tension for pure metals.
Thermodynamically consistent formulation of the temperature dependence of the surface tension
Let us consider a pure element, from a thermodynamic point of view. The temperature derivative of the surface tension defines the excess surface entropy, ΔSs11:
| 4 |
where A and ΔFs are respectively the surface and the excess surface Helmholtz free energy. The molar surface, Am, is expressed as12 , where L is a factor taking into account the packing of the liquid, NA is the Avogadro number and Vm the molar volume. L lies in general between 1.04 and 1.12, however the generic value of 1.09 is generally used, corresponding to the packing factor of close-packed structures. Then:
| 5 |
Without loss of generality it can be assumed that the surface and the bulk Helmholtz free energy are proportional, i.e. . Neglecting the difference between the bulk and the surface electronic structure, this proportionality can be expressed as13:
| 6 |
where ZB and ZS are respectively the bulk and the surface coordination. Then we denote the ratio (ZB − ZS)/ZB by β. Thereafter, given that the Maxwell relations define (∂2Fm/∂V∂T) as the product: αVBT14 where αV and BT are the volumetric thermal expansion and the isothermal bulk modulus, Eq. 5 can be rewritten as:
| 7 |
Note that the product is defined as the thermal pressure coefficient. For liquid and solid metallic or semiconductors elements, the thermal pressure coefficient is nearly independent of temperature15, thus (∂σ/∂T)A,P is a constant that can be written as . In general, for liquid metals, the generic average of L = 1.091 is used16, then one can define:
| 8 |
where β characterises the ratio of “broken bonds” at the surface compared to the bulk and should be specific for each element as, contrary to crystals, the bulk coordination of liquid metals varies between elements. For FCC and BCC crystals, it is well known that β = 0.25. For bulk liquid metals the average coordination number is 10.35 ± 0.0617,18. If, as suggested by Kaptay et al.19, we assume that surface liquid metals are structured similarly to the (1 1 1) FCC lattice plane with ZS = 9, the average value of β should be as follows:
| 9 |
This value is close to β = 1/6 and β = 0.174 ± 0.023 proposed respectively by Oriani20 and Kaptay et al.19.
As mentioned before, the surface tension of pure metals at melting temperature, , is not precisely known. In fact, little data is available. One of the advantages of the Gheribi et al. formalism4 is that the surface tension of pure liquid metals and its temperature dependence can be deduced directly from those of oxygen saturated ones. Indeed, according to Eq. 2:
| 10 |
where σsat. and are the surface tension of the oxygen saturated liquid metal and its temperature derivative assumed constant. In our recent publication4, we demonstrated the reliability of Eq. 9 by predicting the surface tension drop between pure and oxygen saturated metals for several case studies. The fact that in the present formalism the product governs the variation of both σ and σ′ at oxygen saturation is not surprising. Indeed, the model describing the oxygen content effect upon the surface tension (Eq. 2) originates from the assumption that (∂σ/∂xO) ∝ σ. From a thermodynamic point of view, the excess surface entropy has two contributions: (i) a vibrational contribution due to the difference of quasi-lattice vibration at the bulk and surface, , and (ii) a configurational contribution, , due to the presence of impurities at the surface. Then, one can define:
| 11 |
Thereby, the two contributions of excess surface entropy can be defined by identifying Eq. 11 to Eq. 7 and Eq. 10:
| 12 |
The excess vibrational surface entropy is positive while the excess configurational surface entropy is negative. This is in agreement with the principles of statistical physics12. In the present formalism, both the vibrational and configurational excess entropies are correlated. This is also consistent with the Skapski12,13 formalism of the surface entropy. Indeed, from statistical mechanics principles, Skapski derived an expression for the excess configurational and vibrational surface entropy, demonstrating that both contributions can be approximated by functions depending only on the ratio between the average bulk and surface coordination numbers. This can be explained by the fact that the main contribution for the difference between the thermodynamic properties of bulk and surface is the difference between the coordination. Eq. 12 is, to some extent, consistent with the Skapski formalism as the vibrational and configurational excess entropies are intercorrelated via β.
In a nutshell, according to the present formalism, one can predict:
the temperature dependence of the surface tension of pure and oxygen saturated liquid metals
the surface tension of pure liquid metals at melting point from its oxygen saturated surface tension
the surface tension of liquid metals as a function of temperature and oxygen content from the knowledge of the surface tension of oxygen saturated metals at the melting point
It should be noted that the measure of the solubility of oxygen in liquid metals can be either obtain from e.m.f. measurements21 or by electrochemical methods such as described in22,23.
Results and Discussion
Let us now validate the formalism. For 20 liquid metals, we compare the experimental temperature dependence of the surface tension of pure or “nearly” pure elements with predictions by Eq. 8. The purest experimental data were chosen as samples for experiments. In addition, chosen experimental data must have been reported in a quite large range of temperatures, ≳200 K. To calculate the thermal pressure coefficient, we have considered the critically assessed density, thermal expansion, heat capacity (CP) and velocity of sound (C0) (references are given in Table 1). The density of liquid metals varies linearly with temperature: ρ(T) = ρ0 − ρ′(T − Tm). Then, at the melting temperature, thermal expansion is: ρ′/rho0 and the isothermal bulk modulus is deduced from the velocity of sound according to the relation: , where γ is the Grüneisen parameter defined as , M being the molecular weight.
Table 1.
Critically assessed density (ρ), density temperature dependence coefficient ρ′, average velocity of sound (C0), heat capacity at constant pressure, (CP).
| # | T m | ρ 0 | ρ′ | C 0 | C P | 104 × αV/K | B T | σ(Exp.) | 104σ′(Exp.) | 104σ′(Pred.) |
|---|---|---|---|---|---|---|---|---|---|---|
| kg/m3 | kg/(m3.K) | m/s | J/(mol.K) | GPa | J/m2 | J.(m2.K) | J.(m2.K) | |||
| Si | 1683 | 2550 | 0.26a | 3920f | 29.20g | 1.04 | 30.95 | 0.83h | −1.00 | −1.53 |
| Ni | 1727 | 7861 | 0.99b | 4047f | 43.08g | 1.26 | 80.02 | 1.85i | −3.64 | −4.22 |
| Fe | 1811 | 7035 | 0.93c | 4200f | 46.00g | 1.32 | 74.35 | 1.93j | −4.00 | −4.19 |
| Sn | 505 | 6979 | 0.65d | 2464f | 29.69g | 0.93 | 38.30 | 0.61k | −1.70 | −1.98 |
| Cu | 1356 | 7997 | 0.82d | 3440f | 32.84g | 1.02 | 71.41 | 1.40l | −3.30 | −3.14 |
| Bi | 544 | 10028 | 1.21b | 1640f | 30.49g | 1.21 | 23.52 | 0.38m | −0.70 | −1.68 |
| Ag | 1234 | 9264 | 0.88b | 2790f | 33.47g | 0.95 | 56.48 | 0.96n | −1.85 | −2.60 |
| Co | 1766 | 7827 | 0.94a | 4031f | 40.46g | 1.20 | 79.43 | 1.89o | −3.30 | −4.00 |
| Al | 934 | 2377 | 0.31c | 4561f | 31.75g | 1.31 | 38.57 | 1.02p | −2.74 | −2.44 |
| Cd | 593 | 8008 | 1.25a | 2256f | 29.71g | 1.56 | 31.86 | 0.66q | −2.50 | −2.58 |
| Ga | 303 | 6077 | 0.61a | 2873f | 28.47g | 1.01 | 47.24 | 0.72r | −0.68 | −2.30 |
| Ge | 1211 | 5600 | 0.55 | 2693f | 27.61g | 0.98 | 33.01 | 0.66s | −1.56 | −1.64 |
| In | 430 | 7022 | 0.76a | 2337f | 29.48g | 1.09 | 34.58 | 0.57t | −0.90 | −2.05 |
| K | 337 | 838 | 0.23 | 1876f | 32.16g | 2.77 | 2.66 | 0.12u | −0.62 | −0.57 |
| La | 1203 | 5940 | 0.61e | 2030f | 34.31g | 1.03 | 20.23 | 0.75v | −1.00 | −1.28 |
| Na | 371 | 927 | 0.23e | 2526f | 31.87g | 2.48 | 5.35 | 0.21w | −0.50 | −0.83 |
| Pb | 661 | 10656 | 1.24b | 1821f | 30.45g | 1.16 | 29.90 | 0.48x | −2.40 | −2.01 |
| Ti | 1958 | 4140 | 0.15e | 4309f | 47.24g | 0.36 | 64.31 | 1.56y | −0.62 | −1.12 |
| Au | 1336 | 17310 | 1.34e | 2568f | 30.96g | 0.77 | 85.37 | 1.19n | −2.51 | −3.20 |
| Sb | 904 | 6467 | 0.61b | 1900f | 31.38g | 0.94 | 20.99 | 0.38z | −0.84 | −1.13 |
Both thermal expansion (αV) and isothermal bulk modulus (BT) are deduced from ρ, ρ′, C0 and CP (see text). The predicted (Pred.) temperature dependence coefficient of pure liquid metals (σ′) is given in comparaison with the experimental ones (Exp.) and surface tension at melting point (σ) for supposedly pure metals. References are as follows: a56, b57, c58, d59, e60, f24, g25, h61, i62, j63, k2, l64, m65, n66, o67, p49, q68, r69, s70, t45, u71, v72, w73, x74, y75, z76. Note that references for σ and σ′ are identical as they are from the same set of experimental data.
Table 1 presents the predicted and the experimental temperature dependence coefficients of the surface tension for 20 pure liquid metals, along with the corresponding surface tension at melting temperature. The physical properties needed to calculate the thermal pressure coefficient (αVBT) and thus to predict are also reported. Figure 1 compares the predicted and experimental for 20 liquid metals for which reliable experimental data were available. Conservative error bars were assumed to be 25% and 15% respectively for experimental and predicted . Error bars for predicted come from the uncertainty in ρ′ but especially in C0 as the uncertainty in C0 measurements is important24 (10–15%). In general, the agreement between experimental and predicted is satisfactory, most of the data are within the model limits represented by the upper and lower values of β. This indicates the reliability of the proposed formalism, i.e. a linear relationship between the temperature dependence coefficient of the surface tension and the thermal pressure coefficient (Eq. 8). The deviation from between the predictions made with β = 0.132 and experimental data could be explained by a fluctuation of surface coordination numbers. Indeed, in all likelihood, beta should be specific to each element as ZS and ZB varies from an element to an other. The model accuracy could be improved if surface coordination numbers data were available. For now, the average value of β = 0.132 is at first glance satisfactory for all liquid metals. It is interesting to note that for Bi, Ga and In the value of β seems to be smaller than that of liquid metals indicating that for these elements, β is smaller, close to 0.066. In other words, for these three elements, the difference between ZS and ZB is less pronounced than other liquids metals, a difference of about 6.6%. A better estimation of β for each element is an important issue to explore in the near future as it could improve the model accuracy. That would however require an accurate prediction of surface coordination numbers for each element, via atomistic simulations.
Figure 1.
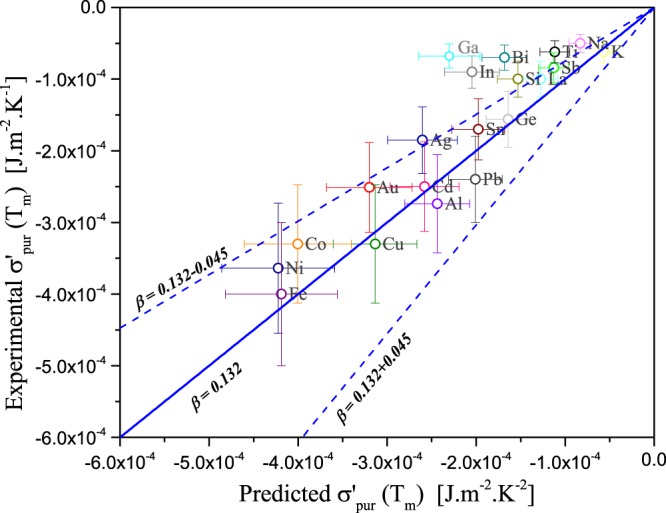
Parity plot representing predicted versus experimental temperature dependence coefficients of the surface tension () for 20 pure liquid metals. The solid line represents the predicted via Eq. 8 with the average value of β = 0.132 while the two dash lines represent the predicted with the upper and lower limits of β as defined by Eq. 9. The error bars are determined to be ±25% for experimental and ±15% for predicted values.
In summary, according to the proposed formalism, only the surface tension value at oxygen saturation and the maximum oxygen solubility as a function of temperature are required to predict the surface tension as a function of both temperature and oxygen content. The calculation procedure can be written as follows:
Calculate via Eq. 3 and select from literature (or from thermodynamic database) critically assessed values of as a function of temperature
Select from literature critically assessed at meting or reference temperature
Predict σpure via Eq. 10
Predict via Eq. 8
Deduce
Parametrize Eq. 2 and represent σ(T, xO).
As a case study for this procedure, we propose to examine the surface tension of aluminium. Aluminium is the second most produced metal in the world. Controlling the surface tension of aluminium and aluminium alloys is of primary importance in many industrial application. Even though it is well known that oxygen decreases drastically the surface tension of aluminium, there exists in the literature no clear formulation of the surface tension of aluminium as a function of both temperature and oxygen content. Very little of oxygen, (~5 ppm in general), is enough to saturate the surface of the liquid with an oxide monolayer. As a result, most experimental data reported in the literature are those of oxygen saturated aluminium. In practice, it is very likely that the oxygen content in the atmosphere is enough to saturate the aluminium surface. However, in some practical and industrial applications, aluminium is free or almost free of oxygen. For instance, in the Hall-Héroult aluminium electrolyse cells, the liquid metal pad is free or nearly of oxygen.
Following the procedure given above, let us formulate and examine the surface tension of aluminium versus T and xO. From the aluminium monoxyde lattice parameters, we estimated, in our prior work, that = 1.65 × 10⁻⁵ mol.m−2 4. as a function of temperature is available in the FactSage thermodynamic software and databases25 and it can be represented by the following expression:
| 13 |
According to the most recent assessments10,26,27, the surface tension of oxygen saturated liquid aluminium at the melting temperature (933 K) is: 0.86 J.m−2. Then σ(T, xO) is predicted.
First, let us examine the calculated surface tension as a function of both temperature and oxygen content, represented in Fig. 2 at up to 1500 K. The surface tension follows an irregular shape, showing a pronounced asymmetry. At low temperature, close to the melting temperature, the surface tension shows an abrupt decrease with oxygen content and then becomes constant () whereas at higher temperature, this decrease is smoother and the surface tension reaches at higher oxygen level. The linear behaviour of surface tension with temperature is, strictly speaking, true for pure and oxygen saturated liquid metals. The predicted surface tension of pure and oxygen saturated liquid aluminium is given by the following expressions:
| 14 |
Figure 2.

Predicted, via Eq. 8, surface tension of liquid aluminium as a function of temperature and oxygen content. Parameters for Eq. 8: = 1.65 × 10⁻⁵ mol.m−2, = 0.86 J.m−2 and is a function of temperature calculated by Eq. 13.
These two equations are parameterized only based on the experimental value of the the surface tension of oxygen saturated metal. In Fig. 3, the surface tension of liquid aluminium at melting temperature (933 K) is represented as a function of oxygen content in comparison with available experimental data. The predicted surface tension of pure Al is in very good agreement with experiments. Our predicted surface tension of 1.16 J.m−2 is very close to the experimental value reported by Chacon et al.28 and Garci-Cardovilla et al.3 for pure aluminium. It is important to note that in the case of liquid aluminium, the oxygen saturation is less but close to 5 ppm.
Figure 3.

Predicted surface tension of liquid aluminium as a function of oxygen content at melting temperature (933 K) (solid line) in comparison with experimental data at the same temperature (open symbols). References: Chacon et al.28, Goumiri and Joud2, Pamies et al.29, Garcia-Cordovilla et al.3. The two dash lines represent the standard deviation of the mean experimental surface tension of oxygen saturated aluminium1,10,26,27.
Let us now discuss the core of this work, the coupling effect between the temperature and the oxygen adsorption at the surface of liquid metals. In Fig. 4 we represent the calculated surface tension of pure liquid aluminium (free of oxygen), oxygen saturated and with various levels of oxygen, from 0.1 ppm to 50 ppm. One can see that the proposed model can predict accurately the temperature dependence of saturated oxygen liquid aluminium. It is interesting to note the data dispersion at melting temperature (933 K). Chacon et al.28, Pamies et al.29, Garcia-Cordovilla3, Saravanan et al.30, Anson et al.31 and to a lesser extent Roach et al.32 attempted to measure the surface tension of aluminium more or less successfully. Figure 4 helps to understand the discrepancy observed in measurements in terms of oxygen content. For instance, data reported by Garcia-Cordovilla3 and Pamies et al.29 correspond to the surface tension of liquid aluminium containing 0.1 ppm oxygen while those reported by Roach et al.32 contain about 1 ppm. When considering the reported oxygen level, experimental datasets for supposedly pure liquid aluminium become consistent with each other. The shape of the oxygen content dependence upon the surface tension is particular: it is similar to a cumulative distribution function. In others words, (∂σ/∂xO) is described by a peak function of temperature. The peak is positioned where the composition of xO becomes smaller than . When the liquid metal is saturated in oxygen, the surface tension obeys , but as the temperature rises the oxygen content could, at a certain temperature, be less than the maximum oxygen solubility in the liquid metal. As a result, above this temperature, the liquid metal could start adsorbing oxygen again, leading to an increase of its surface tension.
Figure 4.
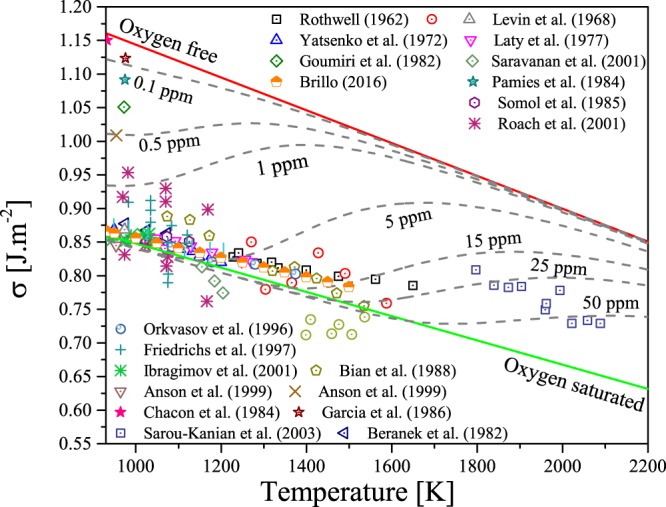
Predicted surface tension of liquid aluminium as a function of temperature for pure (upper solid line), oxygen saturated (lower solid line) and various iso-oxygen contents (dashed lines) from 0.1 to 50 ppm in comparaison with available experimental data (open symbols). Note that data reported by Chacon et al.(1984), Pamies (1984) Garcia-Cordovilla et al.3 Anson et al.31 are assumed to be for pure or nearly pure liquid aluminium. Experimental data are referenced as follow: Levin et al.44, Yatsenko et al.45, Brillo et al.46, Laty et al.47, Pamies et al.29, Somol et al.48, Sarou-Kanian et al.49, Rothwell50, Goumiri et al.2, Saravanan et al.30, Roach et al.32, Orkvasov et al.51, Friedrichs et al.52, Ibragimov et al.53, Anson et al.31, Bian et al.54, Garcia-Cordovilla et al.3, Beranek et al.55, Chacon et al.28.
The good predictive capability of the proposed model when predicting the surface tension of liquid aluminum as a function of both temperature and oxygen content was clear. Naturally, the same theoretical treatment can be employed to predict the surface tension of other transition metals, as functions of T and xO. The predictive capability of the model is expected to be good for other metals, as the reliability of Eq. 1 has been already proven for a large number of elements in our prior work4.
Conclusion
In conclusion, we presented in this work a thermodynamically self consistent approach to predict the coupling effects between the temperature and adsorbed oxygen upon the surface tension. The model has proven to have a good predictive capability by predicting the temperature dependence of surface tension for several liquid metals (Table 1 and Fig. 1). The proposed method could be useful for current research, for example in Integrated computational materials engineering (ICME) for alloys and process design33–35. Indeed, the proposed formalism shows that the surface tension versus T and xO is intercorrelated with other physical properties: thermal expansion, velocity of sound, heat capacity and oxygen solubility. When building a property database, one can now also consider the surface tension to ensure self consistency between the physical properties. Having more reliable databases lead to better predictions of properties for which few or no experimental data are available. A similar approach was successfully employed to couple thermal thermodynamics and thermal transport properties36–40. Lastly, for some liquid metals, due to their significant reactivity with non metallic impurities (O2, S, P, C, etc.), it is difficult to measure the surface tension of the pure elements. In a near future, utilising molecular dynamic simulation campaigns based on reliable Modified Embedded Atom Model (MEAM)41–43, the surface tension of several liquid metals will be predicted in order to confirm the validity of Eq. 10.
Acknowledgements
This research was supported by funds from the Natural Sciences and Engineering Research Council of Canada (NSERC) and Rio Tinto Aluminium. Computations were made in the Briaré cluster at the Université de Montréal, managed by Calcul-Québec and Compute Canada.
Author Contributions
A.E.G. wrote the paper. All authors contributed equally in the development of the model. P.C. supervised the project. All the authors discussed the results and reviewed the manuscript.
Data Availability
All data generated or analysed during this study are included in this published article.
Competing Interests
The authors declare no competing interests.
Footnotes
Publisher’s note: Springer Nature remains neutral with regard to jurisdictional claims in published maps and institutional affiliations.
References
- 1.Keene BJ. Review of data for the surface tension of pure metals. Int. Mater. Rev. 1993;38:157–92. doi: 10.1179/imr.1993.38.4.157. [DOI] [Google Scholar]
- 2.Goumiri L, Joud JC. Auger electron spectroscopy study of aluminum-tin liquid system. Acta Metall. 1982;30:1397–405. doi: 10.1016/0001-6160(82)90160-2. [DOI] [Google Scholar]
- 3.Garcia-Cordovilla C, Louis E, Pamies A. The surface tension of liquid pure aluminium and aluminium-magnesium alloy. Journal of Materials Science. 1986;21:2787–2792. doi: 10.1007/BF00551490. [DOI] [Google Scholar]
- 4.Gheribi, A. E., des Roches, M. V. & Chartrand, P. Modelling the surface tension of liquid metals as a function of oxygen content. Journal of Non-Crystalline Solids505, 154–161, http://www.sciencedirect.com/science/article/pii/S0022309318305842, 10.1016/j.jnoncrysol.2018.10.006 (2019).
- 5.Kozakevitch P. Surface activity in liquid metal solutions. SCI (Soc. Chem. Ind., London) Monogr. 1968;No. 28:223–45. [Google Scholar]
- 6.Ozawa, S., Nishimura, M. & Kuribayashi, K. Surface tension of molten silver in consideration of oxygen adsorption measured by electromagnetic levitation. International Journal of Microgravity Science and Application33, 3303010–330316, http://www.jasma.info/journal/?report=surface-tension-of-molten-silver-in-consideration-of-oxygen-adsorption-measured-by-electromagnetic-levitation, 10.15011/jasma.33.330310 (2016).
- 7.Haynes, W. CRC Handbook of Chemistry and Physics. (CRC Press, 2016).
- 8.Egry, I., Ricci, E., Novakovic, R. & Ozawa, S. Surface tension of liquid metals and alloys—recent developments. Advances in Colloid and Interface Science159, 198–212, http://www.sciencedirect.com/science/article/pii/S0001868610001223, 10.1016/j.cis.2010.06.009 (2010). [DOI] [PubMed]
- 9.Iida, T. & Guthrie, R. I. The physical properties of liquid metals. Clarendon Press, Walton Street, Oxford OX 2 6 DP, UK, 1988 (1988).
- 10.Brillo, J. Thermophysical properties of multicomponent liquid alloys. (Walter de Gruyter GmbH & Co KG, 2016).
- 11.Guggenheim, E. A. Thermodynamics: an Advanced Treatment for Chemists and Physicists. 6th Ed. (North-Holland Publishing Co., 1977).
- 12.Skapski AS. The temperature coefficient of the surface tension of liquid metals. The Journal of Chemical Physics. 1948;16:386–389. doi: 10.1063/1.1746896. [DOI] [Google Scholar]
- 13.Skapski AS. The surface tension of liquid metals. The Journal of Chemical Physics. 1948;16:389–393. doi: 10.1063/1.1746898. [DOI] [Google Scholar]
- 14.Gheribi, A. E. Formulation of the thermal volume consistent with swenson’s concept of thermal pressure. Physics of the Earth and Planetary Interiors177, 59–64, http://www.sciencedirect.com/science/article/pii/S0031920109001538, 10.1016/j.pepi.2009.07.009 (2009).
- 15.Harder JM, Silbert M, Yokoyama I, Young WH. The thermal pressure coefficients and heat capacities of simple liquid metals. Journal of Physics F: Metal Physics. 1979;9:1005. doi: 10.1088/0305-4608/9/6/007. [DOI] [Google Scholar]
- 16.Tanaka, T. & Iida, T. Application of a thermodynamic database to the calculation of surface tension for iron-base liquid alloys. Steel Research65, 21–28, 10.1002/srin.199400921.
- 17.Waseda Y. The structure of liquid transition metals and their alloys. Inst. Phys. Conf. Ser. 1976;30:230–40. [Google Scholar]
- 18.Tao DP. Prediction of the coordination numbers of liquid metals. Metallurgical and materials transactions A. 2005;36:3495–3497. doi: 10.1007/s11661-005-0023-5. [DOI] [Google Scholar]
- 19.Kaptay, G. A unified model for the cohesive enthalpy, critical temperature, surface tension and volume thermal expansion coefficient of liquid metals of bcc, fcc and hcp crystals. Materials Science and Engineering: A495, 19–26, http://www.sciencedirect.com/science/article/pii/S0921509308001287, Fifth International Conference on High Temperature Capillarity HTC-2007, Alicante, Spain (2008).
- 20.Oriani RA. The surface tension of liquid metals and the excess binding energy of surface atoms. The Journal of Chemical Physics. 1950;18:575–578. doi: 10.1063/1.1747704. [DOI] [Google Scholar]
- 21.Alcock CB, Belford TN. Thermodynamics and solubility of oxygen in liquid metals from e.m.f. measurements involving solid electrolytes. part 1.—lead. Trans. Faraday Soc. 1964;60:822–835. doi: 10.1039/TF9646000822. [DOI] [Google Scholar]
- 22.Roy P, Bugbee BE. Electrochemical oxygen sensor for measurement of oxygen in liquid sodium. Nuclear Technology. 1978;39:216–218. doi: 10.13182/NT78-A32081. [DOI] [Google Scholar]
- 23. Diffusivity, activity and solubility of oxygen in liquid lead and lead–bismuth eutectic alloy by electrochemical methods. Journal of Nuclear Materials349, 133–149, http://www.sciencedirect.com/science/article/pii/S0022311505005003, 10.1016/j.jnucmat.2005.10.006 (2006).
- 24.Blairs S. Sound velocity of liquid metals and metalloids at the melting temperature. Phys. Chem. Liq. 2007;45:399–407. doi: 10.1080/00319100701272084. [DOI] [Google Scholar]
- 25.Bale, C. et al. Factsage thermochemical software and databases, 2010–2016. Calphad54, 35–53, http://www.sciencedirect.com/science/article/pii/S0364591616300694, 10.1016/j.calphad.2016.05.002 (2016).
- 26.Mills KC, Su YC. Review of surface tension data for metallic elements and alloys: Part 1 pure metals. International Materials Reviews. 2006;51:329–351. doi: 10.1179/174328006X102510. [DOI] [Google Scholar]
- 27.Mills, K. C. Recommended values of thermophysical properties for selected commercial alloys. (Woodhead Publishing, 2002).
- 28.Chacon, E., Flores, F. & Navascues, G. A theory for liquid metal surface tension. Journal of Physics F: Metal Physics14, 1587, http://stacks.iop.org/0305-4608/14/i=7/a=009 (1984).
- 29.Pamies A, Garcia Cordovilla C, Louis E. The measurement of surface tension of liquid aluminum by means of the maximum bubble pressure method: the effect of surface oxidation. Scr. Metall. 1984;18:869–72. doi: 10.1016/0036-9748(84)90251-5. [DOI] [Google Scholar]
- 30.Saravanan RA, Molina JM, Narciso J, Garcia-Cordovilla C, Louis E. Effects of nitrogen on the surface tension of pure aluminium at high temperatures. Scr. Mater. 2001;44:965–970. doi: 10.1016/S1359-6462(00)00688-6. [DOI] [Google Scholar]
- 31.Anson JP, Drew RAL, Gruzleski JE. The surface tension of molten aluminum and al-si-mg alloy under vacuum and hydrogen atmospheres. Metall. Mater. Trans. B. 1999;30B:1027–1032. doi: 10.1007/s11663-999-0108-4. [DOI] [Google Scholar]
- 32.Roach, S. J., Henein, H. & Owens, D. C. A new technique to measure dynamically the surface tension, viscosity and density of molten metals. Light Met. (Warrendale, PA, U. S.) 1285–1291 (2001).
- 33.Gheribi, A. et al. Calculating optimal conditions for alloy and process design using thermodynamic and property databases, the factsage software and the mesh adaptive direct search algorithm. Calphad36, 135–143, http://www.sciencedirect.com/science/article/pii/S0364591611000563, 10.1016/j.calphad.2011.06.003 (2012).
- 34.Gheribi, A. E., Digabel, S. L., Audet, C. & Chartrand, P. Identifying optimal conditions for magnesium based alloy design using the mesh adaptive direct search algorithm. Thermochimica Acta559, 107–110, http://www.sciencedirect.com/science/article/pii/S0040603113000816, 10.1016/j.tca.2013.02.004 (2013).
- 35.Gheribi AE, et al. Use of a biobjective direct search algorithm in the process design of material science applications. Optimization and Engineering. 2016;17:27–45. doi: 10.1007/s11081-015-9301-2. [DOI] [Google Scholar]
- 36.Gheribi, A. E. & Chartrand, P. Thermal conductivity of molten salt mixtures: Theoretical model supported by equilibrium molecular dynamics simulations. The Journal of Chemical Physics144, 10.1063/1.4942197(2016). [DOI] [PubMed]
- 37.Gheribi, A. E., Salanne, M. & Chartrand, P. Thermal transport properties of halide solid solutions: Experiments vs equilibrium molecular dynamics. The Journal of Chemical Physics142, 10.1063/1.4915524 (2015). [DOI] [PubMed]
- 38.Gheribi, A. E., Seifitokaldani, A., Wu, P. & Chartrand, P. An ab initio method for the prediction of the lattice thermal transport properties of oxide systems: Case study of li2o and k2o. Journal of Applied Physics118, 10.1063/1.4932643 (2015).
- 39.Seifitokaldani, A. & Gheribi, A. E. Thermodynamically self-consistent method to predict thermophysical properties of ionic oxides. Computational Materials Science108, Part A, 17–26, http://www.sciencedirect.com/science/article/pii/S0927025615003626, 10.1016/j.commatsci.2015.06.003 (2015).
- 40.Seifitokaldani, A., Gheribi, A. E., Dollé, M. & Chartrand, P. Thermophysical properties of titanium and vanadium nitrides: Thermodynamically self-consistent approach coupled with density functional theory. Journal of Alloys and Compounds662, 240–251, http://www.sciencedirect.com/science/article/pii/S0925838815318107, 10.1016/j.jallcom.2015.12.013 (2016).
- 41.Gheribi A. Molecular dynamics study of stable and undercooled liquid zirconium based on meam interatomic potential. Materials Chemistry and Physics. 2009;116:489–496. doi: 10.1016/j.matchemphys.2009.04.020. [DOI] [Google Scholar]
- 42.Harvey J-P, Gheribi AE, Chartrand P. Accurate determination of the gibbs energy of cu-zr melts using the thermodynamic integration method in monte carlo simulations. The Journal of Chemical Physics. 2011;135:084502. doi: 10.1063/1.3624530. [DOI] [PubMed] [Google Scholar]
- 43.Harvey J-P, Gheribi AE, Chartrand P. Thermodynamic integration based on classical atomistic simulations to determine the gibbs energy of condensed phases: Calculation of the aluminum-zirconium system. Phys. Rev. B. 2012;86:224202. doi: 10.1103/PhysRevB.86.224202.. [DOI] [Google Scholar]
- 44.Levin ES, Ayushina GD, Gel’d PV. Density and surface energy polytherms of liquid aluminum. Teplofiz. Vys. Temp. 1968;6:432–5. [Google Scholar]
- 45.Yatsenko SP, Kononenko VI, Sukhman AL. Temperature dependence of surface tension and density of tin, indium, aluminum, and gallium. Teplofiz. Vys. Temp. 1972;10:66–71. [Google Scholar]
- 46.Brillo J, Kolland G. Surface tension of liquid al-au binary alloys. J. Mater. Sci. 2016;51:4888–4901. doi: 10.1007/s10853-016-9794-x. [DOI] [Google Scholar]
- 47.Laty P, Joud JC, Desre P, Lang G. Surface tension of liquid copper-aluminum alloys. Surf. Sci. 1977;69:508–20. doi: 10.1016/0039-6028(77)90130-3. [DOI] [Google Scholar]
- 48.Somol V, Franz F, Kubicek L. Surface tension of aluminum-silicon alloys. Kovove Mater. 1985;23:223–7. [Google Scholar]
- 49.Sarou-Kanian V, Millot F, Rifflet JC. Surface tension and density of oxygen-free liquid aluminum at high temperature. Int. J. Thermophys. 2003;24:277–286. doi: 10.1023/A:1022466319501. [DOI] [Google Scholar]
- 50.Rothwell E. A precise determination of the viscosity of liquid tin, lead, bismuth, and aluminum by an absolute method. J. Inst. Met. 1962;90:389–94. [Google Scholar]
- 51.Orkvasov TA, Ponezhev MK, Sozaev VA, Shidov KT. An investigation of the temperature dependence of the surface tension of aluminum alloys. High Temp. (Transl. of Teplofiz. Vys. Temp.) 1996;34:490–492. [Google Scholar]
- 52.Friedrichs HA, Ronkow LW, Zhou Y. Measurement of viscosity, density, and surface tension of metal melts. Steel Res. 1997;68:209–214. doi: 10.1002/srin.199701780. [DOI] [Google Scholar]
- 53.Ibragimov KI, Alchagirov BB, Taova TM, Chochaeva AM, Khokonov KB. Surface tension of aluminum and its alloys with indium and tin. Trans. JWRI. 2001;30:323–327. [Google Scholar]
- 54.Bian M, Chen Q, Wang J. Density, surface tension, wettability, and adhesive energy of liquid aluminum and aluminum-rare earth alloys on boron nitride (bn) surface. Jinshu Xuebao. 1988;24:B139–B141. [Google Scholar]
- 55.Beranek M, Sebkova J, Somol V. Surface tension of liquid aluminum-zinc. Sb. Vys. Sk. Chem.-Technol. Praze, Anorg. Chem. Technol. 1982;B27:153–73. [Google Scholar]
- 56.Assael MJ, et al. Reference data for the density and viscosity of liquid cadmium, cobalt, gallium, indium, mercury, silicon, thallium, and zinc. J. Phys. Chem. Ref. Data. 2012;41:033101/1–033101/16. doi: 10.1063/1.4729873. [DOI] [Google Scholar]
- 57.Assael MJ, et al. Reference data for the density and viscosity of liquid antimony, bismuth, lead, nickel and silver. High Temp. - High Pressures. 2012;41:161–184. [Google Scholar]
- 58.Assael MJ, et al. Reference data for the density and viscosity of liquid aluminum and liquid iron. J. Phys. Chem. Ref. Data. 2006;35:285–300. doi: 10.1063/1.2149380. [DOI] [Google Scholar]
- 59.Assael MJ, et al. Reference data for the density and viscosity of liquid copper and liquid tin. J. Phys. Chem. Ref. Data. 2010;39:033105/1–033105/8. doi: 10.1063/1.3467496. [DOI] [Google Scholar]
- 60.Nasch PM, Steinemann SG. Density and thermal expansion of molten manganese, iron, nickel, copper, aluminum and tin by means of the gamma-ray attenuation technique. Phys. Chem. Liq. 1995;29:43–58. doi: 10.1080/00319109508030263. [DOI] [Google Scholar]
- 61.Huang X, Togawa S, Chung S-I, Terashima K, Kimura S. Surface tension of a si melt: influence of oxygen partial pressure. J. Cryst. Growth. 1995;156:52–8. doi: 10.1016/0022-0248(95)00207-3. [DOI] [Google Scholar]
- 62.Keene BJ, Mills KC, Brooks RF. Surface properties of liquid metals and their effects on weldability. Mater. Sci. Technol. 1985;1:568–71. doi: 10.1179/026708385790124495. [DOI] [Google Scholar]
- 63.Lee HK, Frohberg MG, Hajra JP. Surface tension measurements of liquid iron-nickel-sulfur ternary system using the electromagnetic oscillating droplet technique. ISIJ Int. 1993;33:833–8. doi: 10.2355/isijinternational.33.833. [DOI] [Google Scholar]
- 64.Ownby PD, Liu J. Surface energy of liquid copper and single-crystal sapphire and the wetting behavior of copper on sapphire. J. Adhes. Sci. Technol. 1988;2:255–69. doi: 10.1163/156856188X00264. [DOI] [Google Scholar]
- 65.Tanaka T, Nakamoto M, Oguni R, Lee J, Hara S. Measurement of the surface tension of liquid ga, bi, sn, in and pb by the constrained drop method. Z. Metallkd. 2004;95:818–822. doi: 10.3139/146.018027. [DOI] [Google Scholar]
- 66.Kasama A, Iida T, Morita Z. Temperature dependence of the surface tension of pure liquid metals. Nippon Kinzoku Gakkaishi. 1976;40:1030–8. [Google Scholar]
- 67.Eichel R-A, Egry I. Surface tension and surface segregation of liquid cobalt-iron and cobalt-copper alloys. Z. Metallkd. 1999;90:371–375. [Google Scholar]
- 68.Matuyama Y. The surface tension of molten metals and alloys. Sci. Rep. Tohoku Imp. Univ., Ser. 4. 1927;16:555–62. [Google Scholar]
- 69.Abbaschian GJ. Surface tension liquid gallium. J. Less-Common Met. 1975;40:329–33. doi: 10.1016/0022-5088(75)90077-6. [DOI] [Google Scholar]
- 70.Naidich, Y. V., Perevertailo, V. M. & Obushchak, L. P. Density and surface tension of gold-silicon and gold-germanium alloys. Poroshk. Metall. 73–5 (1975).
- 71.Osiko TP, Alchagirov BB. Surface tensions of binary melts of alkali metals. alloys of rubidium with sodium, cesium, and potassium. Teplofiz. Vys. Temp. 1987;25:609–11. [Google Scholar]
- 72.Bezukladnikova, L. L., Kononenko, V. I. & Torokin, V. V. Density and surface tension of liquid lanthanum, cerium, and praseodymium. Teplofiz. Vys. Temp. 27 (1989).
- 73.Poindexter FE, Kernaghan M. Surface tension of sodium. Phys. Rev. 1929;33:837–50. doi: 10.1103/PhysRev.33.837. [DOI] [Google Scholar]
- 74.Melford, D. A. & Hoar, T. P. Determination of the surface tensions of molten lead, tin, and indium by an improved capillary method. J. Inst. Metals85, 197–205, Paper No. 1742 (1957).
- 75.Wessing JJ, Brillo J. Density, molar volume, and surface tension of liquid al-ti. Metall. Mater. Trans. A. 2017;48:868–882. doi: 10.1007/s11661-016-3886-8. [DOI] [Google Scholar]
- 76.Somol V, Beranek M. Surface tension of molten lead-antimony and lead-bismuth alloys. Sb. Vys. Sk. Chem.-Technol. Praze, Anorg. Chem. Technol. 1984;B30:199–206. [Google Scholar]
Associated Data
This section collects any data citations, data availability statements, or supplementary materials included in this article.
Data Availability Statement
All data generated or analysed during this study are included in this published article.