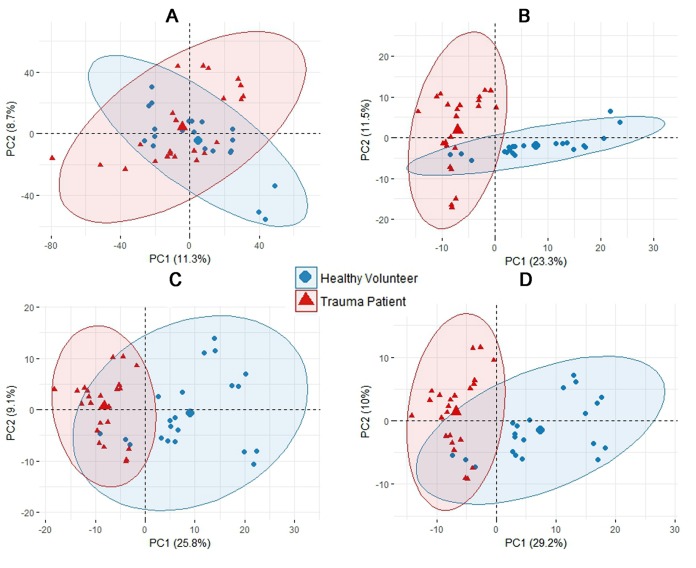
FIG 1.
Transcriptomic multivariate analyses for P. aeruginosa PA14 grown in blood from TPs and HVs. Principal component analysis (PCA) plots are shown. (A) Plot of the entire PA14 transcriptome. (B) Differential expression analysis (DEA). (C) Orthogonal partial least square-discriminant analysis (OPLS-DA). (D) Combination of DEA and OPLS-DA.

