Abstract
Crop photosynthesis and yield are limited by slow photosynthetic induction in sunflecks. We quantified variation in induction kinetics across diverse genotypes of wheat for the first time. Following a preliminary study that hinted at wide variation in induction kinetics across 58 genotypes, we grew 10 genotypes with contrasting responses in a controlled environment and quantified induction kinetics of carboxylation capacity (Vcmax) from dynamic A versus ci curves after a shift from low to high light (from 50 µmol m–2 s–1 to 1500 µmol m–2 s–1), in five flag leaves per genotype. Within-genotype median time for 95% induction (t95) of Vcmax varied 1.8-fold, from 5.2 min to 9.5 min. Our simulations suggest that non-instantaneous induction reduces daily net carbon gain by up to 15%, and that breeding to speed up Vcmax induction in the slowest of our 10 genotypes to match that in the fastest genotype could increase daily net carbon gain by up to 3.4%, particularly for leaves in mid-canopy positions (cumulative leaf area index ≤1.5 m2 m–2), those that experience predominantly short-duration sunflecks, and those with high photosynthetic capacities.
Keywords: Modeling, phenotyping, photosynthesis, Rubisco activase, sunfleck, wheat
Significant variation exists in the induction time of photosynthesis following near-darkness to light transitions across wheat genotypes. Slow induction reduced daily carbon assimilation by up to 15%.
Introduction
Global food security is threatened by growing populations and diminishing increases in crop yield potential (Ray et al., 2013). To ensure future food security, improvements need to be made to plant yield traits that have previously been overlooked in crop breeding programs, such as dynamic properties of photosynthesis. The efficiency of the photosynthetic machinery under fluctuating environmental conditions has been identified as a key target for improvement (Zhu et al., 2004; Kromdijk et al., 2016; Taylor and Long, 2017; Murchie et al., 2018). In particular, the light environment of crop canopies is highly dynamic, with fluctuations occurring on the scale of seconds to minutes (Slattery et al., 2018). On clear days, leaves at the top of the canopy are generally exposed to direct sunlight for the majority of the day, whilst leaves elsewhere in the canopy rely on light in the form of sunflecks. These sunflecks can account for up to 90% of the daily available light (Pearcy, 1990).
The impact of rapid shifts in photosynthetic photon flux density (PPFD) on carbon balance is influenced by a number of physiological factors. Diffusion of CO2 through stomata and the mesophyll can limit induction of photosynthesis (Lawson and Vialet-Chabrand, 2019) and, conversely, slow deactivation of photoprotective mechanisms when leaves enter shadeflecks can reduce net carbon gain by diverting reducing power away from photosynthesis (Kromdijk et al., 2016). Slow induction of photosynthesis following shade to sun transitions can also substantially reduce carbon assimilation in crop canopies. Activation of Rubisco is considered to be a critical constraint on photosynthetic induction to shade–sun transitions (Soleh et al., 2016; Taylor and Long, 2017; Morales et al., 2018). In a recent study, Taylor and Long (2017) predicted that carbon assimilation could be depressed by up to 21% in wheat (Triticum aestivum) by slow induction of Rubisco in response to fluctuating light conditions. If this inefficiency could be reduced, whole-canopy carbon assimilation would be improved, potentially leading to increases in yield (Long et al. 2006).
Screening for genetic variation in photosynthetic activation time would increase our fundamental understanding of this process. Patterns in variation and dynamics of the activation response would allow us to identify and evaluate this trait as a valid target for improvement through conventional breeding. However, although some variation in the kinetics of photosynthetic induction has been identified across soybean genotypes (Soleh et al., 2016, 2017), there is little information available regarding the diversity of this trait in wheat. Taylor and Long (2017) examined only a single genotype, partly due to the arduous nature of the ‘dynamic A versus ci’ method they used to characterize the kinetics of Rubisco activation in vivo. Other less direct methods, such as in vitro Rubisco assays or high-throughput phenotyping (HTP) field techniques such as multispectral imaging, could be applied more readily to the task of phenotyping many genotypes. However, in vitro assays do not capture the interaction of diffusional and biochemical induction. Stomatal and mesophyll diffusion influence [CO2] in chloroplasts, which in turn regulates Rubisco activase (Rca; Portis et al., 1986), and HTP methods cannot yet quantify the photosynthetic rate per se, or its induction kinetics. Direct measurement of gas exchange in intact leaves thus remains, in our view, the only suitable method for phenotyping these traits.
Preliminary data (from a study that was not designed to quantify photosynthetic induction kinetics rigorously) hinted at the occurrence of wide variation in induction kinetics across 58 genotypes of wheat. Those results, which we include here as Supplementary data, motivated us rigorously to quantify the extent of genetic variation in photosynthetic induction kinetics in wheat, and the potential for directed breeding to enhance productivity by harnessing this variation. We characterized induction kinetics in 10 genotypes, which spanned the range of induction rates observed in the preliminary study, using the dynamic A versus ci method to quantify induction of ribulose-1,5-bisphosphate (RuBP) carboxylation and regeneration capacities over time after a switch from low to high light. We then used modeling to quantify the improvement in diurnal net carbon gain that could be achieved by breeding for faster photosynthetic induction within the observed range of variation across genotypes.
Materials and methods
Plant material
Detailed analysis of photosynthetic induction was conducted on wheat grown under controlled conditions in June/July 2018. Ten genotypes (Table 1) were selected from those grown in the field the previous year (see Supplementary Table S1 at JXB online). Seed was sown in 5 liter pots with compost mix containing a slow release fertilizer (Evergreen Garden Care Australia, Bella Vista, NSW, Australia). Day and night temperatures were maintained at 23.7±1.7 °C and 12.0±1.8 °C (mean ±SD) respectively, and relative humidity at 67±6% and 74±8%. Growth CO2 concentration was 482±23 µmol mol–1 across the course of the experiment. Light was supplied by LED growth lamps (LX602C; Heliospectra AB, Göteborg, Sweden) and provided a PPFD of 800 µmol m–2 s–1 at the leaf surface (the spectral output of these lamps is shown in Supplementary Fig. S9). Seedlings were thinned to one per pot after germination. Prior to tillering, plants were watered to field capacity once per day, and after tillering the plants were watered to field capacity twice per day. All gas exchange measurements were taken on the mid-section of a fully expanded flag leaf during heading or anthesis (the distribution of Zadoks phenological growth stages during these measurements is shown in Supplementary Fig. S1).
Table 1.
Genotypes (from list in Supplementary Table S1) used for intensive analysis of photosynthetic induction kinetics in flag leaves, and parameters of photosynthetic light response curves [ϕ=initial slope of response of net assimilation rate (A) to photosynthetic photon flux density (PPFD) (CO2/photon); θ=curvature parameter for response of A to PPFD (unitless); Asat, asymptotic value of A in the limit of high PPFD (µmol CO2 m–2 s–1)] and median induction kinetics parameters for those genotypes [f, the weighting of the fast phase of induction (unitless); and τfast and τslow, the time constants for the fast and slow phases of induction, respectively (min)]
| Genotype | ϕ | θ | A sat | f | τfast | τslow |
|---|---|---|---|---|---|---|
| 50 | 0.422 | 0.6578 | 26.813 | 0.341 | 0.29±0.11 | 2.06±0.29 |
| 51 | 0.0459 | 0.6925 | 29.345 | 0.369 | 0.434±0.013 | 3.37±0.91 |
| 83 | 0.0384 | 0.7951 | 27.696 | 0.436 | 0.32±0.11 | 3.12±0.42 |
| 88 | 0.0446 | 0.8031 | 22.101 | 0.387 | 0.472±0.097 | 3.19±0.72 |
| 130 | 0.0431 | 0.6587 | 25.136 | 0.381 | 0.339±0.050 | 2.23±0.24 |
| 150 | 0.0524 | 0.6092 | 29.662 | 0.320 | 0.327±0.051 | 2.18±0.28 |
| 161 | 0.0356 | 0.7093 | 25.091 | 0.491 | 0.45±0.18 | 2.42±0.54 |
| 192 | 0.0481 | 0.6982 | 31.139 | 0.431 | 0.51±0.15 | 3.52±0.12 |
| 213 | 0.0471 | 0.4505 | 27.840 | 0.291 | 0.47±0.12 | 3.4±1.0 |
| 216 | 0.0520 | 0.6288 | 28.702 | 0.510 | 0.40±0.11 | 3.79±0.86 |
Median absolute deviations are also shown for τfast and τslow.
Detailed analysis of induction to light in flag leaves of wheat grown in a controlled environment
Plants were moved from the controlled environment room to a temperature stable laboratory at 25 °C. Photosynthetic light response curves were recorded using a LI-6400XT gas exchange system (LI-COR, Lincoln, NE, USA) on one plant of each genotype. Leaves were equilibrated to chamber conditions [leaf temperature 25 °C; leaf vapor pressure deficit (VPD) 1.0–1.5 kPa; cuvette CO2 (ca) 400 µmol mol–1; and PPFD 1500 µmol m–2 s–1 provided by LEDs in the chamber head] for at least 40 min to allow them to reach steady state. PPFD was then reduced through 1200, 1000, 800, 600, 500, 400, 300, 200, 150, 100, 50 and 0 µmol m–2 s–1, with measurements taken immediately after chamber conditions had stabilized at each level. Light response curves were fitted to a non-rectangular hyperbola model using non-linear least squares in R (nls; R Language and Environment); namely the lesser root A of
| (1) |
where i is PPFD, Asat is the asymptotic limit of A at high PPFD, θ is a dimensionless parameter <1, ϕ is the initial slope of A versus i, and Rd is day respiration rate. Asat, θ, ϕ, and Rd were fitted empirically. Fitted light response curves are shown in Supplementary Fig. S6.
Dynamic A versus ci responses were recorded using four Walz GFS-3000 gas exchange systems (Heinz Walz GmbH, Effeltrich, Germany), using the method of Taylor and Long (2017). The induction of photosynthesis following transition from near darkness to saturating light was measured at a number of different ca values, and composite A versus ci curves were generated for each relative time point during induction. Leaf temperature was held at 25 °C and VPDleaf at 1.0 kPa. Each leaf was first brought to a steady state at ca 400 µmol mol–1 and PPFD 1500 µmol m–2 s–1 (found to be saturating in our light response curves) over 40 min. PPFD in the leaf chamber was then dropped to 50 µmol m–2 s–1 for 30 min. During this ‘near-darkness phase’ ca was also reduced to 100 µmol mol–1 to inhibit stomatal closure, as per guidelines outlined in Taylor and Long (2017). Four minutes prior to induction, the ca was increased to the desired value for induction. Induction of photosynthesis was initiated with a step change to PPFD 1500 µmol m–2 s–1, and measurements recorded every 10 s for 15 min. This cycle of 30 min in near darkness/15 min in high light was repeated at nine ca values: 50, 100, 200, 300, 400, 500, 600, 800, and 1000 µmol mol–1.
A versus ci curves were generated for each 10 s time point during induction of photosynthesis. The photosynthesis model of Farquhar et al. (1980) was fitted to these curves using the ‘plantecophys’ package in R (bilinear fitting method; Duursma, 2015) to provide estimates of Rubisco carboxylation capacity (Vcmax), potential electron transport rate (J), and non-photorespiratory CO2 release rate (Rd). We calculated the Michaelis–Menten coefficient and the photorespiratory compensation point from mean leaf temperature as per Bernacchi et al. (2001). Temperature corrections were performed during the fitting process to provide values of Vcmax and J at 25 °C. The script used for curve fitting is provided in Supplementary File S2.
For each leaf, we modeled the observed time-course of induction of Vcmax between 30 s and 900 s after exposure to high light using a two-phase exponential function of time:
| (2) |
where the parameters were estimated by using Solver in MS Excel to minimize the sum of squared differences between measured and modeled Vcmax [Vmi and Vmf are the initial and final (fully induced) values of Vcmax, τfast and τslow are time constants for fast and slow phases of acclimation, respectively, and f is a weighting factor between zero and one]. We found that this two-phase model produced a substantially better fit to our data than a single-phase model as used by Taylor and Long (2017), with r2 ranging from 0.969 to 0.995 (median 0.990) for the two-phase model, versus 0.890–0.986 (median 0.960) for the single-phase model. This may reflect the fact that Taylor and Long (2017) fitted induction time-courses beginning 60 s after exposure to high light; because our fits began after 30 s, they probably captured more of the rapid initial phase of induction, which typically lasts 1–2 min (Pearcy, 1990).
Modeling impact of induction kinetics on carbon gain
We simulated the impact of observed variability in photosynthetic induction kinetics on diurnal carbon gain for different sunfleck lengths and canopy positions, using a modeling approach similar to that of Taylor and Long (2017), in which we simulated photosynthetic induction kinetics using genotype-median kinetic parameters for Vcmax induction from Equation 2 for each of the 10 genotypes studied. To assess the role of sunfleck length and canopy position, we calculated irradiance based on expressions given by Retkute et al. (2018) and de Pury and Farquhar (1997). We chose this approach, rather than the sample ray tracing model output for a single variety and location as used by Taylor and Long (2017), because aspects of canopy light environment probably differ greatly among genotypes, canopy positions, planting densities, and geographic locations. A more generic model could provide additional insight that may prove useful for other investigators.
We performed three sets of simulations. In set #1, we used genotype-specific induction and photosynthetic light response parameters for each of the 10 genotypes listed in Suplementary Table S2, and simulated diurnal carbon gain for each of three leaf orientations (horizontal, vertical/north-facing, and vertical/east-facing). In set #2, we used genotype-specific induction and photosynthetic parameters as for set #1, but varied leaf elevation and azimuth angles randomly to sample a spherical leaf angle distribution (with 50 samples). In set #3, we sought to distinguish the influence of induction kinetics and photosynthetic capacity by combining kinetics parameters from the two genotypes with the ‘slowest’ and ‘fastest’ induction (as measured by t95 for Vcmax; these were genotypes #51 and #88, respectively) with light response parameters (Asat, ϕ, and θ) from the two genotypes with the smallest and largest values of Asat (#88 and #192, respectively).
The modeling approach is described in greater detail in Supplementary Appendix S1B.
Statistical analysis
We tested for differences among genotypes in functional parameters of acclimation kinetics (t95, t75–t25, and t25) using ANOVA [function aov() in base R] with genotype as a categorical independent variable and either t95, t75–t25, or t25, as the dependent variable [after transformation to improve normality, by inversion (i.e. y=1/t95)]. Outliers were removed on the basis of a Grubbs test (R package ‘outliers’) applied to each genotype; this resulted in removal of three values for t95, four for t75–t25, and one for t25. We tested for correlations between kinetic parameters and final Vcmax using linear mixed models with genotype as a random effect (R packages ‘lme4,’ with ‘lmerTest’ to obtain P-values and ‘MuMIn’ to obtain r2).
Results
Measurement and modeling of induction kinetics
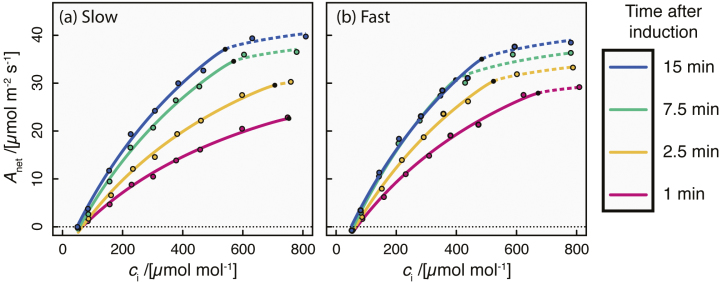
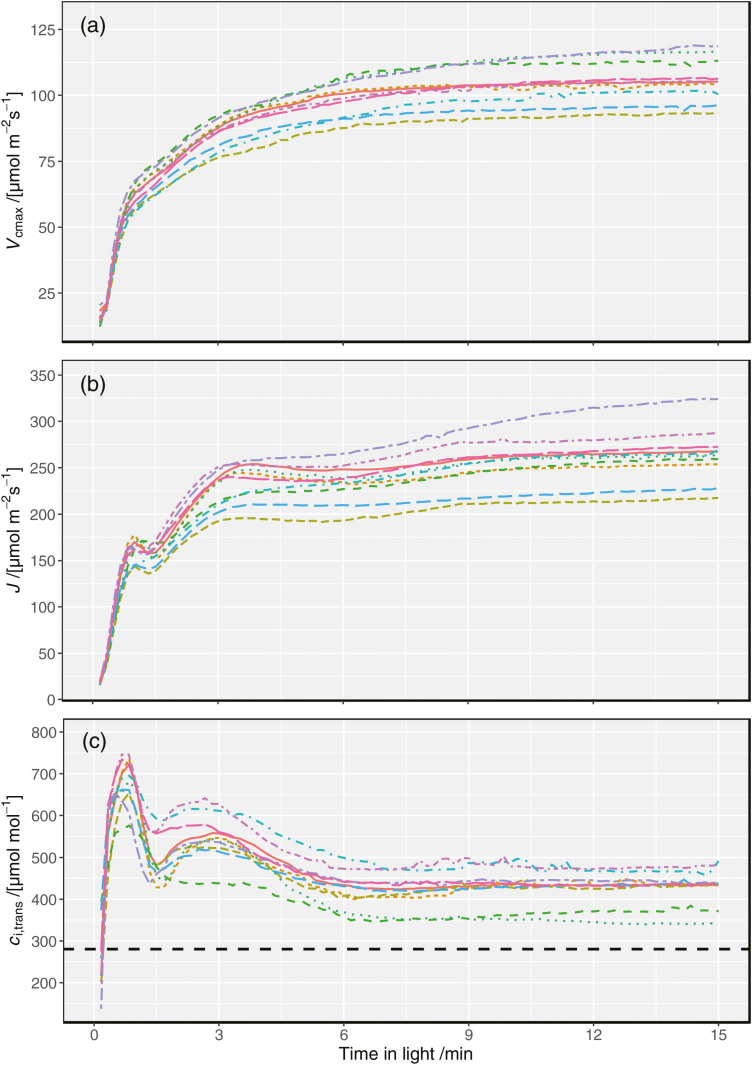
A versus ci curves fit to each 10 s interval following transition from shade (50 µmol m–2 s–1) to saturating light (1500 µmol m–2 s–1) provided estimates of Vcmax and J throughout induction. Whilst specific induction times varied between individual leaves and among genotypes (fitted dynamic A versus ci curves for a slow and a fast leaf are shown in Fig 1A and B, respectively), some general trends in induction kinetics were clear (Fig. 2). Both Vcmax and J increased immediately after transition to saturating light, but J increased more rapidly than Vcmax in the first 3 min and also saturated more quickly (cf. Fig. 2A, B). As a result, ci,trans (the ci at which the primary limitation imposed on photosynthesis switches between RuBP carboxylation and regeneration) rose to a maximum of 548±2 µmol mol–1 at 3 min after transition to saturating light, decreasing to 419±4 µmol mol–1 after 7 min and remaining relatively stable after this time (Fig 2C). The high values of ci,trans throughout induction indicate that carboxylation is probably always limiting to photosynthesis during induction under natural conditions (assuming a ca of ~400 µmol mol–1).
Fig. 1.
Two examples of dynamic A versus ci curves, for a leaf with relatively slow induction of photosynthesis to light (a; time for Vcmax to increase by 95% of the difference from its initial value to its final value, t95=12.5 min), and a leaf with faster induction (b; t95=5.8 min). In each panel, each curve comprises a Rubisco carboxylation-limited segment (solid lines) and an RuBP regeneration-limited segment (dashed lines), and four curves are shown, each corresponding to a different time after exposure to saturating PPFD (pink, 1 min; orange, 2.5 min; green, 7.5 min; blue, 15 min).
Fig. 2.
Kinetics of (a) the maximum Rubisco carboxylation rate (Vcmax), (b) the rate of electron transport (J), and (c) the value of ci at the transition point between Rubisco carboxylation limitation and RuBP regeneration limitation (ci,trans), based on dynamic A versus ci curves. Each color represents one of the 10 genotypes listed in Supplementary Table S2; lines and shaded regions indicate means ±SE for replicates within each genotype. In (c), the dashed horizontal line indicates a ci of 280 µmol mol–1, which corresponds to ci=0.7·ca at ca=400 µmol mol–1, which would be a typical operating ci for well-watered plants..
Variation in photosynthetic induction kinetics
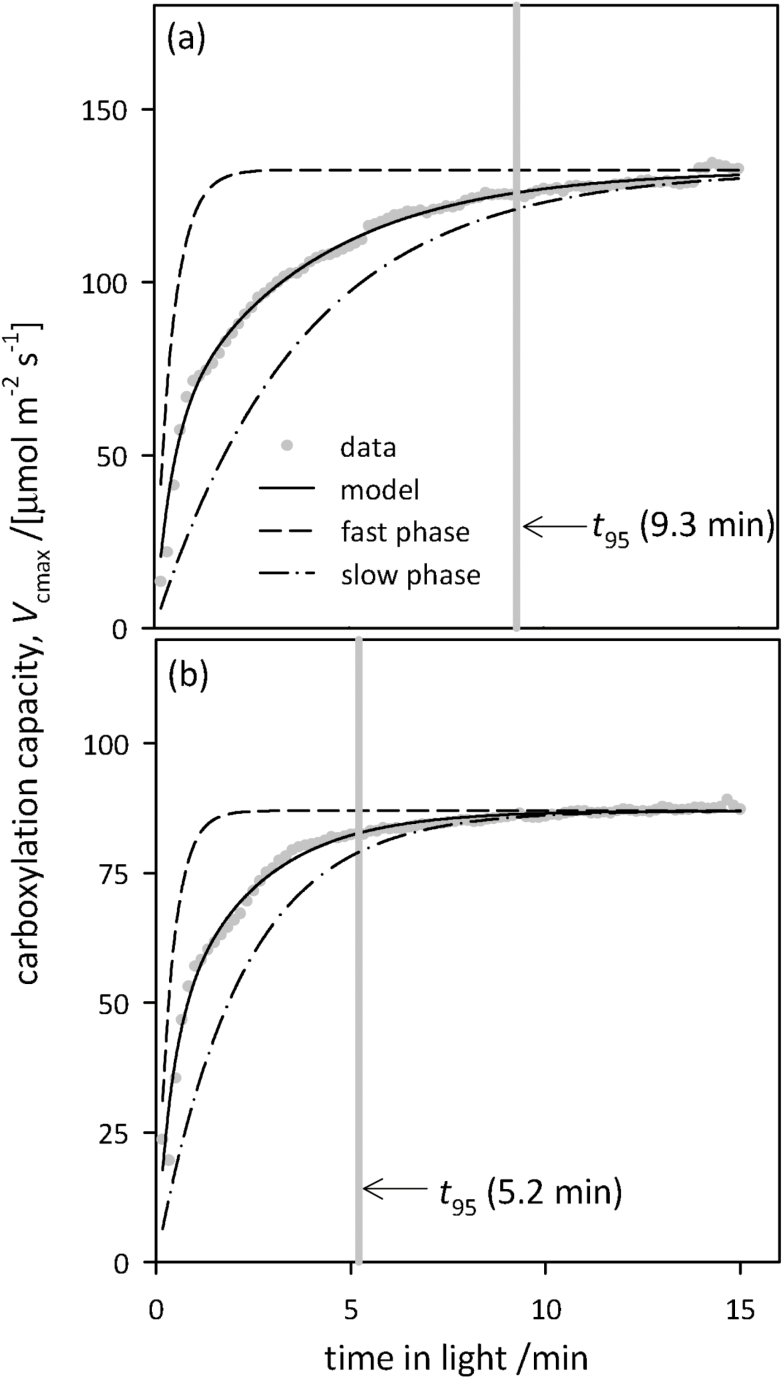
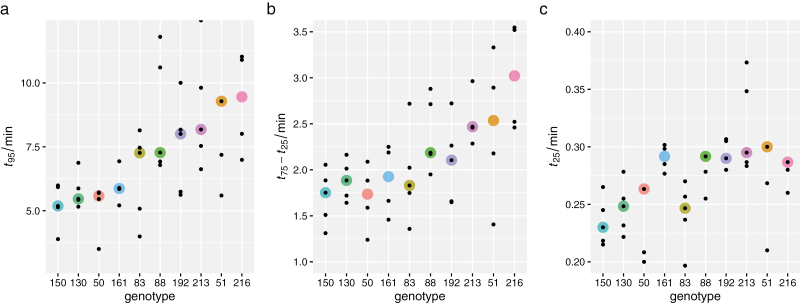
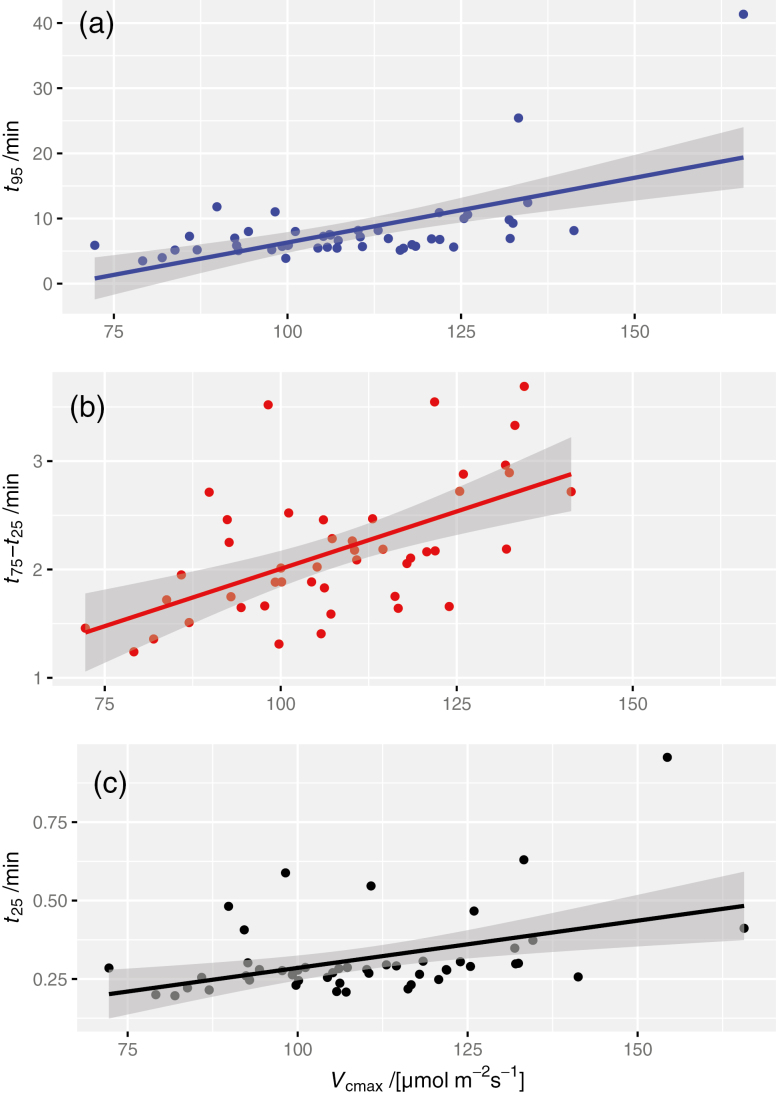
Figure 3 shows representative time-courses of induction of Vcmax for two individual leaves whose t95 values were approximately equal to the genotype medians for the slowest (Fig 3A) and the fastest genotype (Fig 3B). The rate of induction varied greatly across genotypes for Vcmax in flag leaves of chamber-grown wheat. Within-genotype medians ranged from 5.2 min to 9.5 min for t95, from 1.7 min to 3.0 min for t75–t25, and from 0.23 min to 0.30 min for t25 (Fig. 4). Differences among genotypes were highly significant for t95 [F(9,37)=4.05, P=0.0011] and for t75–t25 [F(9,36)=3.14, P=0.0068], and marginally significant for t25 [F(9,39)=2.22, P=0.041]. The corresponding within-genotype median time constants for the fast and slow phases of acclimation, τfast and τslow, respectively, ranged from 0.29 min to 0.51 min (τfast) and from 2.1 min to 3.8 min (τslow); the genotype median weighting factor for the fast phase (f) ranged from 0.29 to 0.51. The final Vcmax was correlated with t95 (r2=0.36, P<0.0001). Since t95 depends both on the ‘lag time’ for induction (t25) and the ‘rise time’ for induction (t75–t25), the relationship between t95 and Vcmax arises to some extent from the relationships between Vcmax and both t25 and t75–t25; our data indicate that the t95–Vcmax relationship was more strongly driven by a correlation between Vcmax and the rise time (r2=0.42, P<0.0001), than the lag time (r2=0.07, P=0.066) (Fig. 5).
Fig. 3.
Representative time-courses of carboxylation capacity inferred from dynamic A versus ci curves measured on chamber-grown plants (Vcmax), for two leaves in which t95 (the time for Vcmax to rise through 95% of its dynamic range, shown with vertical gray bars) closely approximated the genotype median t95 for the slowest (a) and fastest (b) genotypes. The dashed and dash-dot lines represent the fast and slow phases of the model for Vcmax induction, respectively (each adjusted to the same asymptote as the full model), and the solid black line is the overall model. For (a), the fast-phase time constant (τfast) was 0.29 min, the slow-phase time constant (τslow) was 2.1 min, and the weighting factor for the fast phase (f) was 0.46; for (b), τfast=0.51 min, τslow=3.8 min, and f=0.42. Note the different y-axis ranges in (a) and (b).
Fig. 4.
Distribution of values of the time for Vcmax to increase through (a) 95% of its dynamic range, t95, (b) the middle 50% of its dynamic range, t75–t25, and (c) 25% of its dynamic range, t25. Large colored circles are medians for each genotype; small symbols are individual data points. Several outlying points are omitted: in (a), two values for genotype #51, and in (c), two values for #88 and one each for #50, 51, and 216.
Fig. 5.
Relationships between final (saturated) values of Vcmax and induction kinetics parameters: (a) t95, (b) t75–t25, and (c) t25. Solid lines are regressions with 95% confidence intervals: (a) y=0.188x–12.41, r2=0.382, P<0.0001; (b) y=0.0194x+0.0864, r2=0.626, P<0.0001; (c) y=0.003x–0.0143, r2=0.280, P=0.0018.
Simulated effect of variation in induction kinetics on diurnal carbon gain
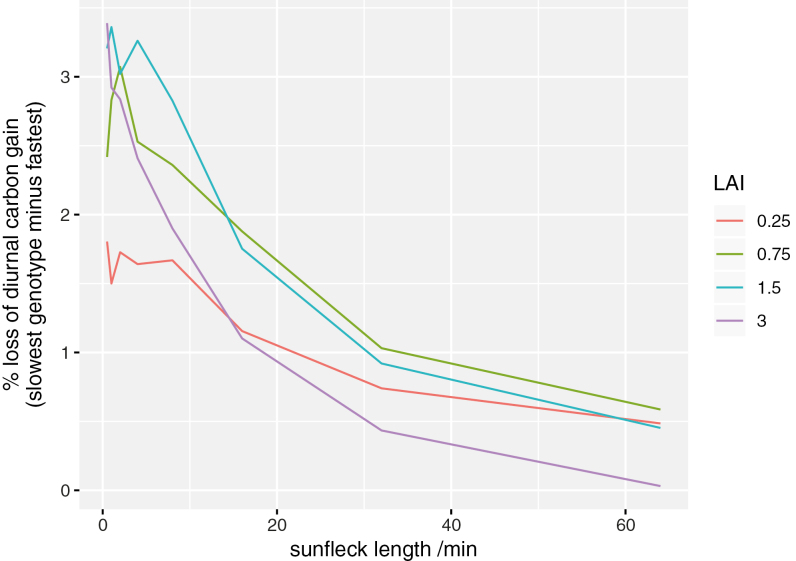
Simulation set #1 (using three limiting cases for leaf orientation) indicated that leaf orientation had small effects on simulated carbon losses caused by slow induction (Supplementary Fig. S8); the results described below are integrated over a spherical leaf angle distribution. Simulation set #2, which compared all 10 genotypes using genotype-specific values for kinetic and photosynthetic light response parameters, predicted that non-instantaneous induction of photosynthesis to sunflecks could reduce daily carbon gain by as much as 15% (Fig. 6). Reduction in daily carbon gain differed across genotypes and was generally greatest for shorter duration sunflecks because photosynthesis had less opportunity to approach its fully acclimated ‘target’ value during short sunflecks. To consider the gains that could realistically be achieved by breeding given the variability we observed across genotypes, we compared the genotype with the largest average percentage loss of daily carbon gain due to non-instantaneous induction (#51) with the genotype with the smallest average loss (#88) (Fig. 7). The ‘faster’ genotype gained up to 3.4% more carbon than the ‘slower’ genotype, and this difference was generally greater for intermediate canopy locations (0.75 m2 m–2 and 1.5 m2 m–2) and shorter sunfleck lengths (Fig. 7).
Fig. 6.
Simulated percentage loss of potential total diurnal carbon gain caused by slow induction of photosynthesis to fluctuating light for a range of sunfleck durations (x-axis), at four different canopy depths [indicated by the values of leaf area index (LAI), in m2 m–2, given at the top of each panel]. Each line represents a different genotype. Results are averaged across a spherical leaf angle distribution.
Fig. 7.
Simulation results in Fig. 6 expressed as the difference in average loss of diurnal carbon gain (due to non-instantaneous photosynthetic induction) between the two genotypes with the greatest and smallest losses (#51 and #88, respectively). Each line represents a different canopy depth [indicated by the values of leaf area index (LAI), in m2 m–2, given in the key].
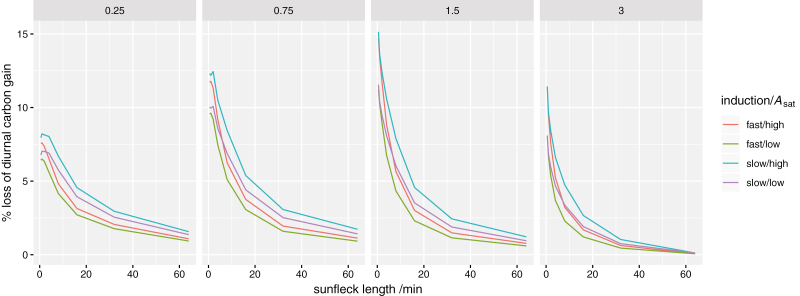
Simulation set #3 compared four imaginary ‘composite’ genotypes, based on the slowest and fastest induction kinetics and the smallest and largest photosynthetic capacities observed across genotypes. The percentage loss of daily carbon gain was greater for composite genotypes with larger photosynthetic capacity; in fact, under very short sunflecks, high-Asat leaves with fast induction performed more poorly than low-Asat leaves with slow induction (Fig. 8).
Fig. 8.
Simulated percentage loss of potential total diurnal carbon gain caused by slow induction of photosynthesis to fluctuating light for a range of sunfleck durations (x-axis), at four different canopy depths [indicated by the values of leaf area index (LAI), in m2 m–2, given at the top of each panel]. Each line represents a different composite genotype, as indicated in the key (‘fast’ and ‘slow’ used induction kinetics parameters for the genotypes with the smallest and largest values of t95, respectively; ‘high’ and ‘low’ used photosynthetic light response curve parameters for the genotypes with the largest and smallest values of Asat, respectively). Results are averaged across a spherical leaf angle distribution.
Discussion
We found 1.8-fold variation across genotypes of wheat in the time required for 95% induction (t95) of carboxylation capacity in flag leaves after exposure to saturating light, following a period in near darkness. Our simulations suggest that diurnal carbon gain is depressed by up to 15% by non-instantaneous induction of photosynthesis in sunflecks, and that this depression differed by up to 3.4% across the 10 genotypes that we studied. This complements recent work (Taylor and Long, 2017) documenting the potential impacts on carbon gain of slow Rubisco induction in sunflecks by demonstrating variation in this important trait in available genetic resources, showing that realistic gains are achievable using current germplasm within traditional breeding programs.
Variation in induction kinetics
We found substantial variation in Vcmax induction kinetics across 10 genotypes of wheat. Prior to the present study, little information regarding diversity of photosynthetic induction kinetics across wheat genotypes was available. Soleh et al. (2017) found wide variation across 37 soybean cultivars and noted that this variation was genetically determined (i.e. stable across different leaf positions and phenological stages), and, as in our study in wheat, could be attributed largely to variation in the rate of Rubisco activation. Those authors also found that photosynthetic induction kinetics were not correlated with steady-state photosynthetic capacity; in contrast, we found weak correlations between Vcmax and t95, t75–t25, and t25 in this study (Fig. 5). Based on evidence presented here, efforts to improve net carbon capture across canopies must also consider the responses of A to short-term changes in the environment as a dynamic induction property that is at least partially genetically determined (see also Murchie et al., 2018).
Photosynthetic induction has long been known to involve at least two phases. The initial, fast phase involves the availability of RuBP or other Calvin cycle intermediates and is complete within 1–2 min (Pearcy, 1990), which is consistent with the median time constant that we found for the fast phase of Vcmax induction (within-genotype median τfast=24.0 s, which gives a t95 of 72 s for the fast phase). The slower phase apparently involves light-dependent activation of Rubisco by Rca, with time constants of 4–5 min reported for Alocasia macrorrhiza and Spinacia oleracea (Pearcy, 1990) (cf. 2.1–3.8 min for τslow in this study). Sugar phosphates bind to Rubisco active sites, inhibiting carboxylation of RuBP. Removal of these sugar phosphates by Rca is slower at low light. To restore normal function, Rca uses energy from ATP hydrolysis to actively remove these inhibitors. Rca is sensitive to the chloroplast ADP/ATP ratio and redox status, and so mediates Rubisco activation in response to light (Carmo-Silva et al., 2015). The variation in Rubisco activation kinetics found among wheat genotypes in our study could possibly be attributed to differences in (i) the total concentration of Rca; (ii) the relative concentrations of the α- and β-Rca isoforms; (iii) the binding affinities of Rubisco for inhibitors and of Rca for Rubisco; and/or (iv) the localization of Rca relative to Rubisco. In rice, Rca-overexpressing mutants maintain higher Rubisco activation states in the dark and respond more quickly to changes in the light environment than wild-type plants (Yamori et al. 2012). Arabidopsis mutants expressing only the β-Rca isoform, which is less sensitive to chloroplast redox status and ADP/ATP ratio than α-Rca, had faster photosynthetic induction and exhibited increased growth under fluctuating light compared with plants with both isoforms (Carmo-Silva and Salvucci 2013). Much less is known regarding the binding affinities and co-localization of these two enzymes, with future work seeking to address these knowledge gaps (for a review of current knowledge, see Mueller-Cajar et al., 2014). The recent characterization of the wheat Rca gene structure, as well as advances in genomic, proteomic, and transcriptomic techniques, should provide a better understanding of these limitations and allow for a more targeted breeding approach to improve photosynthesis under dynamic light conditions (Carmo-Silva et al., 2015).
Under very short sunflecks, other factors may dominate the dynamics of photosynthesis. For example, buffering of high-frequency (10–0.1 Hz) fluctuations in light availability by the ‘capacitance’ afforded by finite metabolite pools can increase the effective light use efficiency of very high sunfleck PPFDs above 100%, as compared with the average photosynthesis rate when the same PPFD is sustained (Pearcy, 1990). Rubisco induction and de-induction are probably not relevant to such short sunflecks, which may dominate canopy light regimes under windy conditions, or for plants with very small leaves. The kinetics of de-induction may, nevertheless, influence net photosynthesis under longer sunflecks. We did not measure de-induction kinetics, but for modeling we assumed de-induction in shadeflecks to be slower than induction in sunflecks by a factor of 5/3 (1.67), following Taylor and Long (2017). However, other evidence suggests that de-induction kinetics may be much slower still (e.g. 22–30 min in Alocasia and Spinacia; Pearcy, 1990), which may mitigate the inferred benefits of breeding for faster induction, as discussed below.
Simulated impact of slow induction on photosynthesis
Consistent with the recent report by Taylor and Long (2017), our modeling found that non-instantaneous induction of photosynthesis to fluctuating light can reduce daily carbon gain by up to 15%. The present study extends that conclusion by quantifying the potential impact of varying sunfleck duration, canopy position (which influences the relative proportions of time spent by leaves in sunflecks versus shadeflecks), and leaf orientation. Specifically, we found that the impact of slow induction was greatest for short sunflecks, because when sunflecks are similar to or much longer than the t95 for induction, photosynthesis will be fully induced for most of each sunfleck, thus losing little potential carbon gain. Projected percentage carbon losses due to slow induction were generally greatest at intermediate canopy depths (cumulative LAI=0.75 m2 m–2 or 1.5 m2 m–2), whereas leaf orientation had very minor effects (Supplementary Fig. S8).
We also found that the absolute magnitude of photosynthetic capacity itself affected the relative impact of induction on carbon gain: for a given induction time constant, percentage daily carbon losses were smaller for leaves with lower Asat (Fig. 8). This is because photosynthesis in such leaves is more nearly saturated at any given PPFD, so that a larger and/or longer decline in PPFD is required to produce a given relative decline in carbon gain. Other theoretical and experimental work suggests that leaves at intermediate canopy positions tend to have excess photosynthetic capacity, compared with upper-canopy leaves, and that re-allocating finite photosynthetic nitrogen to upper leaves could enhance whole-canopy carbon gain (de Pury and Farquhar, 1997; Buckley et al., 2013; Townsend et al., 2018). Our results complement those studies by showing that excess photosynthetic capacity in mid-canopy leaves may further suppress canopy carbon gain due to its disproportionate effect on the inefficiency of slow induction, particularly given the local light environment in such locations (Fig. 8).
By driving our simulations with observed variation in induction kinetics within existing genetic resources for wheat, we were able to quantify the realistic gains in diurnal carbon capture that should be possible with traditional breeding. We found that differences in median photosynthetic induction kinetics and light response curve parameters across genotypes led to a difference of up to 3.4% in daily carbon gain between genotypes, with the greatest potential gains for leaves at intermediate canopy positions (LAI=0.75 m2 m–2 and 1.5 m2 m–2) and for sunflecks of short to intermediate duration (0.5–16 min) (Figs 6–8). Although these potential gains are not as dramatic as the ‘headline’ number of 15% based on instantaneous induction as the target, they are nevertheless worth pursuing and are sufficiently conservative within genotypes to be a feasible target for breeders. We suggest that continuing work should therefore aim to further quantify variation in this important trait across genotypes of wheat or other crops, and to identify target genomic regions to assist breeding efforts.
Limitations of this study
Our analysis focused on kinetics of Vcmax induction, because our measurements from the dynamic A versus ci curve method indicated that RuBP carboxylation, rather than regeneration, dominated photosynthetic induction in our plants. That conclusion assumes that delays in stomatal opening do not present an even larger limitation to photosynthesis during induction. If stomatal opening were substantially delayed behind Rubisco induction, then our simulations would probably overestimate the impact of variation in the Rubisco induction rate on diurnal carbon gain. Taylor and Long (2017) found that the relative limitation of photosynthesis by stomata remained approximately constant during the first 5 min of photosynthetic induction, at ~50%, declining slightly to ~30% by ~10 min. This suggests that Rubisco induction and stomatal opening are of similar importance for shorter sunflecks, but that Rubisco becomes more important for longer sunflecks. However, it is unknown whether stomatal opening kinetics co-vary with photosynthetic induction kinetics across genotypes of wheat, or of any species for that matter. Our analysis, like that of Taylor and Long (2017), is also limited by the lack of direct measurements of de-induction kinetics, as well as our use of a simple model of photosynthetic induction. We suggest that a more thorough understanding of the prospects of using breeding or genetic manipulation to improve crop yields by accelerating photosynthetic induction would benefit greatly from concurrent assessment of stomatal opening, Rubisco induction kinetics, and photosynthetic de-induction kinetics in the same genotypes, followed by analysis with a more detailed kinetic model (e.g. Morales et al., 2018).
Conclusions
Our study has for the first time identified significant variation in the induction time of photosynthesis following near-darkness to light transitions across a diverse panel of wheat genotypes under controlled conditions. Slow induction of photosynthesis reduced daily carbon assimilation by as much as 15%. These results reinforce the findings of Taylor and Long (2017) in highlighting fast induction of photosynthesis, in particular the activation of Rubisco, to fluctuating light as a valuable trait for improvement in wheat breeding programs.
Supplementary data
Supplementary data are available at JXB online.
Appendix S1. Preliminary measurements of photosynthetic induction kinetics and modeling impact of induction kinetics on carbon gain.
Table S1. List of genotypes used in the preliminary study.
Figure S1. Phenological stages at time of measurements.
Figure S2. Validation of Amax in TPU-limited conditions.
Figure S3. Sample Amax time-course and fitted kinetic model from the preliminary study.
Figure S4. Distribution of induction kinetic parameters from the preliminary study.
Figure S5. Relationship between Amax and kinetic parameters in the preliminary study.
Figure S6. Fitted light response curves for the 10 genotypes used in the main study.
Figure S7. Representative simulated PPFD time-courses.
Figure S8. Effect of leaf orientation on diurnal carbon losses due to slow induction.
Figure S9. Spectral output of growth lamps used in main study.
Protocol S1. R script for dynamic A versus ci curve fitting and R script for analysis of induction kinetics
Acknowledgements
This research was supported by the International Wheat Yield Partnership, through a grant provided by the Grains Research and Development Corporation (US00082). TNB was supported by the Australian Research Council (DP150103863 and LP130100183) and the National Science Foundation (Award #1557906). This work was supported by the USDA National Institute of Food and Agriculture, Hatch project 1016439.
References
- Bernacchi CJ, Singsaas EL, Pimentel C, Portis ARJ, Long SP. 2001. Improved temperature response functions for models of Rubisco-limited photosynthesis. Plant, Cell & Environment 24, 253–259. [Google Scholar]
- Buckley TN, Cescatti A, Farquhar GD. 2013. What does optimization theory actually predict about crown profiles of photosynthetic capacity when models incorporate greater realism? Plant, Cell & Environment 36, 1547–1563. [DOI] [PubMed] [Google Scholar]
- Carmo-Silva AE, Salvucci ME. 2013. The regulatory properties of Rubisco activase differ among species and affect photosynthetic induction during light transitions. Plant Physiology 161, 1645–1655. [DOI] [PMC free article] [PubMed] [Google Scholar]
- Carmo-Silva E, Scales JC, Madgwick PJ, Parry MA. 2015. Optimizing Rubisco and its regulation for greater resource use efficiency. Plant, Cell & Environment 38, 1817–1832. [DOI] [PubMed] [Google Scholar]
- de Pury DGG, Farquhar GD. 1997. Simple scaling of photosynthesis from leaves to canopies without the errors of big-leaf models. Plant, Cell & Environment 20, 537–557. [Google Scholar]
- Duursma RA. 2015. Plantecophys—an R package for analysing and modelling leaf gas exchange data. PLoS One 10, e0143346. [DOI] [PMC free article] [PubMed] [Google Scholar]
- Farquhar GD, von Caemmerer S, Berry JA. 1980. A biochemical model of photosynthetic CO2 assimilation in leaves of C3 species. Planta 149, 78–90. [DOI] [PubMed] [Google Scholar]
- Kromdijk J, Głowacka K, Leonelli L, Gabilly ST, Iwai M, Niyogi KK, Long SP. 2016. Improving photosynthesis and crop productivity by accelerating recovery from photoprotection. Science 354, 857–861. [DOI] [PubMed] [Google Scholar]
- Lawson T, Vialet-Chabrand S. 2019. Speedy stomata, photosynthesis and plant water use efficiency. New Phytologist 221, 93–98. [DOI] [PubMed] [Google Scholar]
- Long SP, Zhu XG, Naidu SL, Ort DR. 2006. Can improvement in photosynthesis increase crop yields? Plant, Cell & Environment 29, 315–330. [DOI] [PubMed] [Google Scholar]
- Morales A, Kaiser E, Yin X, Harbinson J, Molenaar J, Driever SM, Struik PC. 2018. Dynamic modelling of limitations on improving leaf CO2 assimilation under fluctuating irradiance. Plant, Cell & Environment 41, 589–604. [DOI] [PubMed] [Google Scholar]
- Mueller-Cajar O, Stotz M, Bracher A. 2014. Maintaining photosynthetic CO2 fixation via protein remodelling: the Rubisco activases. Photosynthesis Research 119, 191–201. [DOI] [PubMed] [Google Scholar]
- Murchie EH, Kefauver S, Araus JL, Muller O, Rascher U, Flood PJ, Lawson T. 2018. Measuring the dynamic photosynthome. Annals of Botany 122, 207–220. [DOI] [PMC free article] [PubMed] [Google Scholar]
- Pearcy RW. 1990. Sunflecks and photosynthesis in plant canopies. Annual Review of Plant Physiology and Plant Molecular Biology 41, 421–453. [Google Scholar]
- Portis AR, Salvucci ME, Ogren WL. 1986. Activation of ribulosebisphosphate carboxylase/oxygenase at physiological CO2 and ribulosebisphosphate concentrations by Rubisco activase. Plant Physiology 82, 967–971. [DOI] [PMC free article] [PubMed] [Google Scholar]
- Ray DK, Mueller ND, West PC, Foley JA. 2013. Yield trends are insufficient to double global crop production by 2050. PLoS One 8, e66428. [DOI] [PMC free article] [PubMed] [Google Scholar]
- Retkute R, Townsend AJ, Murchie EH, Jensen OE, Preston SP. 2018. Three-dimensional plant architecture and sunlit–shaded patterns: a stochastic model of light dynamics in canopies. Annals of Botany 122, 291–302. [DOI] [PMC free article] [PubMed] [Google Scholar]
- Slattery RA, Walker BJ, Weber APM, Ort DR. 2018. The impacts of fluctuating light on crop performance. Plant Physiology 176, 990–1003. [DOI] [PMC free article] [PubMed] [Google Scholar]
- Soleh MA, Tanaka Y, Kim SY, Huber SC, Sakoda K, Shiraiwa T. 2017. Identification of large variation in the photosynthetic induction response among 37 soybean [Glycine max (L.) Merr.] genotypes that is not correlated with steady-state photosynthetic capacity. Photosynthesis Research 131, 305–315. [DOI] [PubMed] [Google Scholar]
- Soleh MA, Tanaka Y, Nomoto Y, Iwahashi Y, Nakashima K, Fukuda Y, Long SP, Shiraiwa T. 2016. Factors underlying genotypic differences in the induction of photosynthesis in soybean [Glycine max (L.) Merr]. Plant, Cell & Environment 39, 685–693. [DOI] [PubMed] [Google Scholar]
- Taylor SH, Long SP. 2017. Slow induction of photosynthesis on shade to sun transitions in wheat may cost at least 21% of productivity. Philosophical Transactions of the Royal Society B: Biological Sciences 372, 9. [DOI] [PMC free article] [PubMed] [Google Scholar]
- Townsend AJ, Retkute R, Chinnathambi K, Randall JWP, Foulkes J, Carmo-Silva E, Murchie EH. 2018. Suboptimal acclimation of photosynthesis to light in wheat canopies. Plant Physiology 176, 1233–1246. [DOI] [PMC free article] [PubMed] [Google Scholar]
- Yamori W, Masumoto C, Fukayama H, Makino A. 2012. Rubisco activase is a key regulator of non-steady-state photosynthesis at any leaf temperature and, to a lesser extent, of steady-state photosynthesis at high temperature. The Plant Journal 71, 871–880. [DOI] [PubMed] [Google Scholar]
- Zhu XG, Ort DR, Whitmarsh J, Long SP. 2004. The slow reversibility of photosystem II thermal energy dissipation on transfer from high to low light may cause large losses in carbon gain by crop canopies: a theoretical analysis. Journal of Experimental Botany 55, 1167–1175. [DOI] [PubMed] [Google Scholar]
Associated Data
This section collects any data citations, data availability statements, or supplementary materials included in this article.


