Abstract
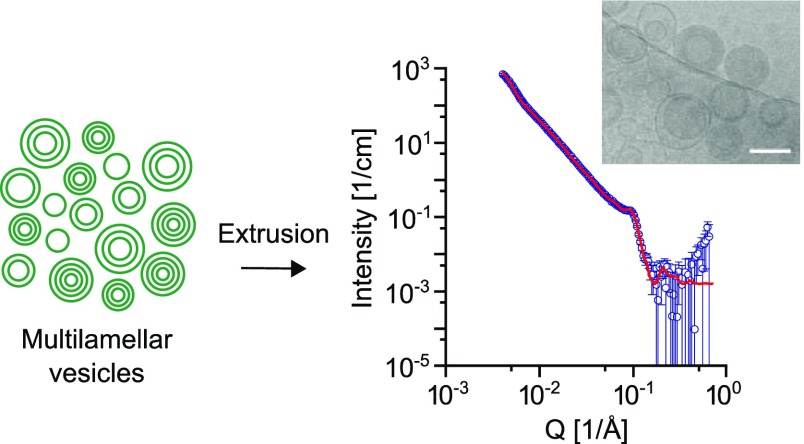
Liposomes are well-established systems for drug delivery and biosensing applications. The design of a liposomal carrier requires careful choice of lipid composition and formulation method. These determine many vesicle properties including lamellarity, which can have a strong effect on both encapsulation efficiency and the efflux rate of encapsulated active compounds. Despite this, a comprehensive study on how the lipid composition and formulation method affect vesicle lamellarity is still lacking. Here, we combine small-angle neutron scattering and cryogenic transmission electron microscopy to study the effect of three different well-established formulation methods followed by extrusion through 100 nm polycarbonate membranes on the resulting vesicle membrane structure. Specifically, we examine vesicles formulated from the commonly used phospholipids 1-palmitoyl-2-oleoyl-sn-glycero-3-phosphocholine (POPC), 1,2-dipalmitoyl-sn-glycero-3-phosphocholine (DPPC) and 1,2-dioleoyl-sn-glycero-3-phosphocholine (DOPC) via film hydration followed by (i) agitation on a shaker or (ii) freeze–thawing, or (iii) the reverse-phase evaporation vesicle method. After extrusion, up to half of the total lipid content is still assembled into multilamellar structures. However, we achieved unilamellar vesicle populations when as little as 0.1 mol % PEG-modified lipid was included in the vesicle formulation. Interestingly, DPPC with 5 mol % PEGylated lipid produces a combination of cylindrical micelles and vesicles. In conclusion, our results provide important insights into the effect of the formulation method and lipid composition on producing liposomes with a defined membrane structure.
Introduction
Liposomes are soft self-assembled structures that have been extensively used for drug delivery and biosensing applications.1−3 They are vesicles comprising a phospholipid bilayer surrounding an inner aqueous cavity. Their intrinsic biocompatibility, chemical versatility, and potential for stimuli-responsive behavior make them ideal candidates for biological applications.4 Furthermore, they have the ability to encapsulate both hydrophobic and hydrophilic compounds, within the bilayer and the aqueous core, respectively.5 Additionally, amphiphilic compounds can be encapsulated in liposomes, partitioning between the lipid bilayer and the aqueous compartment.6 There are several parameters to consider when designing liposome-based drug carriers. Among these, vesicle lamellarity (number of consecutive lipid bilayers within one vesicle) is particularly important: it is known to affect the encapsulation efficiency, liposome internalization by cells, and efflux rate of encapsulated therapeutic agents which have implications for drug delivery and shelf life of formulations.7,8 Therefore, for applications which rely on release of encapsulated contents or sequestration of an active molecule in the membrane bilayer, the lamellarity has a profound effect on their efficacy.
Despite this, vesicle lamellarity has been largely overlooked in the literature, with the current belief that by performing multiple extrusions (on average 21 passages) through membranes with a pore size smaller than 200 nm, almost exclusively unilamellar vesicle populations can be produced, regardless of composition and formulation method. Benchtop techniques cannot provide information about lamellarity and more advanced techniques are therefore required to determine degrees of multilamellarity. Among these, 31Phosphorus NMR (31P NMR) has been used to estimate vesicle lamellarity, but it requires careful calibration because the concentration of the shift reagent affects the calculated lamellarity.9 Alternatively, experimentalists rely on cryogenic transmission electron microscopy (cryo-TEM) or small-angle scattering. Cryo-TEM can provide exact information about the morphology of individual vesicles, but it is challenging to extract information about the overall properties of the bulk sample. For bulk measurements, small-angle neutron scattering (SANS) is a powerful and non-destructive technique that provides vesicle structural information including membrane bilayer thickness, vesicle diameter, lamellarity, and overall morphology based on their interaction with neutrons.10 Compared with small-angle X-ray scattering (SAXS), SANS does not risk radiation damage to the sample and offers improved contrast, and it is suited for contrast matching measurements. On the other hand, X-ray scattering provides excellent resolution of the Bragg peaks and allows fast kinetics measurements. Furthermore, while SAXS is also accessible in a laboratory setting, neutron scattering requires access to large-scale facilities, such as accelerator driven or reactor based sources, deuterated solvents and involved analysis procedures. These challenges in collecting data on lamellarity may explain in part the difficulty in quantifying its significance.
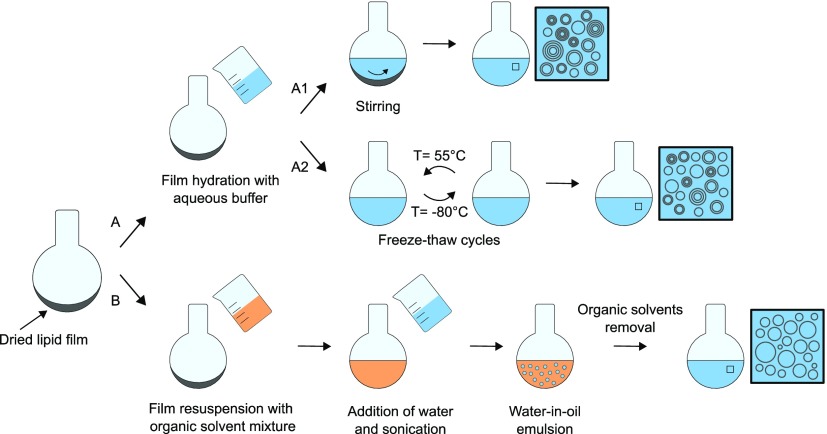
Over the years, many different liposome formulation methods have been introduced, each of which produces a different system in terms of vesicle lamellarity and size distribution. The most common liposome formulation methods are depicted in Figure 1. The thin film hydration method was the first method described for liposome preparation and involves the creation of a dried lipid film in a round-bottom flask, followed by hydration with an aqueous buffer and agitation, for example on a shaker.11 Alternatively, it is possible to introduce freeze–thawing cycles after the hydration or the agitation step, which have been reported to improve encapsulation efficiencies.12 Both methods yield multilamellar vesicles in the micron-size range with a heterogeneous size distribution. Size reduction techniques are therefore needed for most applications. The preferred strategies to obtain homogeneous small unilamellar vesicle populations are extrusion through a membrane with a pore size below 200 nm or sonication. The extrusion technique offers advantages over sonication in terms of vesicle size distribution and reproducibility.13 Furthermore, it has been shown that increasing the number of extrusion passages has a beneficial effect on the unilamellarity of the system.14 Alternatively, some methods are designed to yield unilamellar vesicles from the beginning, thus avoiding vesicle post-processing. One of these is the reverse-phase evaporation vesicle (REV) method (Figure 1, route B), which is based on the creation of a water-in-oil emulsion system where the phospholipid acts as a surfactant, forming micelles with an inner aqueous core. Progressive removal of the organic phase (usually by evaporation under reduced pressure) leads to the collapse of some of the lipid micelles and the formation of unilamellar vesicles.15 This approach does however result in residual organic solvent in the vesicle membrane which can limit their use.
Figure 1.
Schematic of common liposome formulation methods. Dried lipid films can be resuspended in aqueous buffer (path A), followed by agitation on a shaker (A1) or freeze–thaw cycles (A2). Both methods lead to the formation of multilamellar vesicles, although for the FT method the degree of lamellarity is lower. Resuspension of the lipid film in an organic solvent mixture and subsequent addition of water (path B) forms a water-in-oil emulsion where the lipids act as surfactants. Progressive removal of the organic solvents leads to the formation of a unilamellar vesicle suspension. This is called the reverse-phase evaporation vesicle method.
Although liposome formulations have already proved their importance as a tractable approach toward developing drug carriers, little attention has been paid to how lipid composition and formulation methods affect vesicle lamellarity. In this work, we used a combination of SANS and cryo-TEM to elucidate the membrane structure of vesicles prepared using three different formulation methods and extruded through a 100 nm pore-sized membrane. We examined two phospholipids that differ slightly in the structure of their hydrocarbon tails only and are widely used in the liposome field: 1-palmitoyl-2-oleoyl-sn-glycero-3-phosphocholine (POPC) and 1,2-dipalmitoyl-sn-glycero-3-phosphocholine (DPPC). We also evaluated the effect of the introduction of varying amounts of a poly(ethylene)glycol (PEG)-modified lipid in POPC, DPPC, or 1,2-dioleoyl-sn-glycero-3-phosphocholine (DOPC) vesicles. The results obtained from the SANS experiments, corroborated by cryo-TEM, provide important insights toward the characterization of lamellarity from individual vesicles to bulk population distributions and highlight the importance of lipid composition and formulation method for the vesicle design.
Results and Discussion
Effect of the Formulation Method
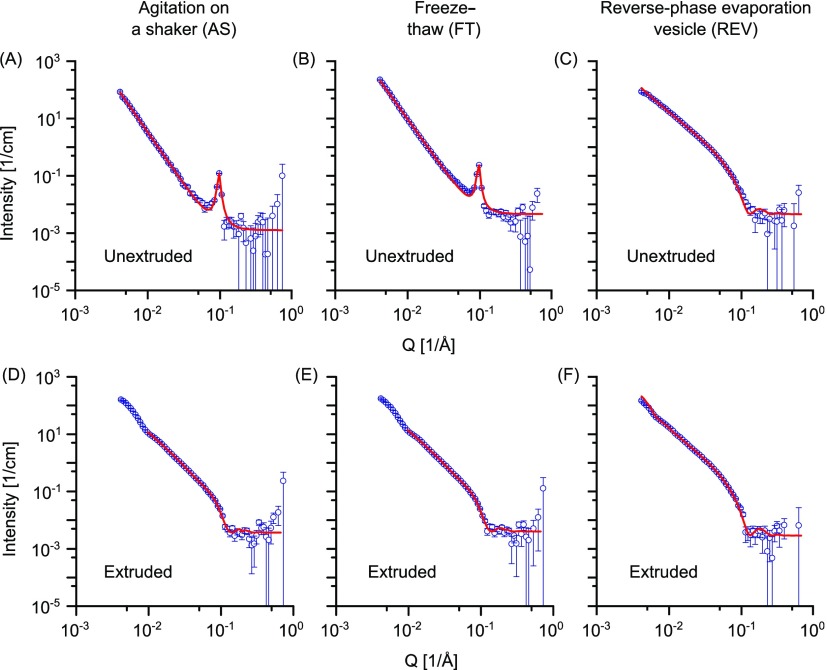
To evaluate the effect of the formulation method on vesicle lamellarity, we studied three common liposome formulation methods, namely: (a) film hydration followed by agitation on a shaker (AS), (b) film hydration followed by 5 freeze-thaw cycles (FT), and (c) reverse-phase evaporation (REV). Post-formulation, all vesicles were extruded 35 times through a polycarbonate membrane with 100 nm pore size. Vesicles were composed of either POPC or DPPC, which both belong to the phosphatidylcholine family, the major component of animal cell membranes.16 While DPPC has two saturated alkyl chains, POPC has one saturated and one unsaturated alkyl chain. As a result, they have different phase behaviors at 25 °C: POPC has a phase transition melting temperature (Tm) of −2 °C; thus, it is in the liquid crystalline phase, whereas DPPC (Tm = 41 °C) is in the gel phase. The measured SANS data and the fitting curves for the DPPC liposomes are shown in Figure 2. Unextruded vesicles prepared via the AS or FT method exhibit a sharp Bragg peak at Q = 0.096 Å–1 (AS) and 0.095 Å–1 (FT) (Figure 2A,B), which is representative of multilamellar vesicles and is due to scattering from stacks of lipid lamellae with a d-spacing (d = 2π/Q) of 65.45 and 66.14 Å, respectively, which includes the coordinated water layer.17,18 This value is in good agreement with previously reported SAXS data for DPPC bulk samples.19 The multilamellar structures are a result of phospholipid self-assembly upon hydration with an aqueous buffer, and it is well established that extruding such large multilamellar vesicles through a membrane with a pore size ≤ 200 nm disrupts the multilamellar organization.20,21 In extruded DPPC vesicle formulations prepared by AS or FT, the neutron scattering data no longer show a Bragg peak (Figure 2D,E). However, the fittings of these measurements show that bilamellar vesicles still account for 9 vol % of the total vesicle population after extrusion (see Table 1). The dip in the scattering curves of the extruded samples around Q = 10–2 Å–1 is largely due to the core radius. No peak due to core radius is visible in the unextruded samples because the mixture is comprised of vesicles with radii of 100–1000 s of nm. These length scales are too large to be accessible in the measured Q range. High polydispersity, as observed in the unextruded vesicle samples, can also lead to ill-defined vesicle radii.
Figure 2.
SANS data for unextruded DPPC vesicles prepared via the (A) AS method, (B) FT method, and (C) REV method, and DPPC vesicles prepared via the (D) AS method, (E) FT method, and (F) REV method then extruded through a 100 nm membrane. Points with errors represent measured data and lines are fits of functions generated using a Broad Peak model (A,B) and models with uni- and bilamellar vesicle components (C–F). Data are plotted on a log–log scale.
Table 1. Fitting Parameters of SANS Data of Extruded DPPC and POPC Vesicles Prepared via the AS, FT, and REV Methodsa.
| proportion
of total % |
||||||||||
|---|---|---|---|---|---|---|---|---|---|---|
| lipid | form. method | model | component | rc | ts | tw | Rtotal | vol | num | lipid |
| DPPC | AS | bilamellar | unilamellar | 661 | 45 | 706 | 91 | 91 | 85 | |
| bilamellar | 586 | 45 | 29 | 705 | 9 | 9 | 15 | |||
| FT | bilamellar | unilamellar | 614 | 45 | 659 | 91 | 93 | 86 | ||
| bilamellar | 610 | 45 | 31 | 731 | 9 | 7 | 14 | |||
| REV | unilamellar | unilamellar | 526 | 48 | 574 | 100 | 100 | 100 | ||
| POPC | AS | quadrilamellar | unilamellar | 909 | 37 | 946 | 71 | 71 | 51 | |
| bilamellar | 848 | 37 | 27 | 949 | 17 | 17 | 23 | |||
| trilamellar | 712 | 37 | 23 | 869 | 4 | 5 | 8 | |||
| quadrilamellar | 758 | 37 | 26 | 984 | 8 | 7 | 17 | |||
| FT | trilamellar | unilamellar | 598 | 37 | 635 | 75 | 86 | 64 | ||
| bilamellar | 666 | 37 | 26 | 766 | 16 | 10 | 21 | |||
| trilamellar | 683 | 37 | 26 | 846 | 9 | 4 | 15 | |||
| REV | bilamellar | unilamellar | 761 | 38 | 799 | 89 | 88 | 81 | ||
| bilamellar | 662 | 39 | 28 | 768 | 11 | 12 | 19 | |||
The fitted core radius rc, ts, tw and the total radius Rtotal are reported in Å.
In the case of the unextruded vesicles, the scattered intensity is dominated by the contributions of the bilayers/multilayers of the vesicles rather than the overall dimensions of the micron-scale vesicles. Scattering data from these unextruded vesicles prepared via AS or FT methods could therefore be fitted with a Broad Peak model (see the Supporting Information and Table S1). This model is a combination of a Lorentzian-peak and a power law decay and allows the determination of the Porod exponent. The Porod exponents obtained gave comparable values for unextruded vesicles prepared with the AS method and FT method (3.63 ± 0.014 and 3.51 ± 0.007, respectively). The vesicle sizes are too large to capture their overall dimensions in our measured Q range so it was not possible to determine their radii. The neutron scattering data for the extruded vesicles prepared via the AS method and the FT cycles were fitted using a custom-built model to account for the presence of bilamellar vesicles. In contrast to unextruded AS- and FT-prepared vesicles, we observed no Bragg peak in samples of unextruded DPPC vesicles prepared via the REV method (Figure 2C) and exclusively unilamellar vesicles by cryo-TEM (Figure S1). A unilamellar vesicle model was used to fit the measured neutron scattering curves, and a bilayer thickness of 48 Å was obtained. In this case, extrusion through a 100 nm membrane has the sole effect of reducing vesicle size, and the scattering data for vesicles prepared via the REV method followed by extrusion could be fitted using the same model (see the Supporting Information). The fitting parameters are reported in Table 1. Here, rc indicates the core radius, and ts and tw indicate the bilayer and the water layer thickness, respectively.
The best-fit bilayer thickness is in good agreement with the values reported in the literature for extruded DPPC vesicles.19 In all of the cases, the particle size is slightly bigger than the membrane pore size used for the extrusion, as reported previously.21 The best-fit Rtotal is in good agreement with dynamic light scattering (DLS) measurements of extruded DPPC vesicles, which gave hydrodynamic diameters of 126 ± 59 nm (AS method) and 112 ± 39 nm (FT method) (cf. Figure S3A). From the obtained fitting parameters, it is possible to calculate the proportion of bilamellar vesicles as a function of the total particle volume, particle number, or lipid volume. Calculations for DPPC vesicles are reported in Table S2. For both the AS and FT methods, bilamellar vesicles represent 9% of the total particle volume or around 15% of the total lipid content. This is an important parameter to consider: it indicates that part of the total lipid used is forming bilamellar structures, thereby invalidating estimates of vesicle number concentration based on the total lipid concentration used in the vesicle formulation. Furthermore, decreases in the observed particle concentration (measured, e.g., using nanoparticle tracking-based techniques) with respect to estimated values from initial lipid concentrations are often attributed to lipid loss during the formulation or the extrusion step. However, our results suggest that this may also be due to the presence of residual multilamellar structures. In conclusion, DPPC vesicles extruded through a 100 nm pore-sized membrane give a predominantly unilamellar vesicle population with residual bilamellar vesicles (91 and 9% of the total particle volume, respectively) when the AS or the FT methods are used and a unilamellar vesicle population when the REV method is used. Vesicle sizes are comparable for AS and FT and slightly smaller for the REV method.
Effect of the Phase Behavior
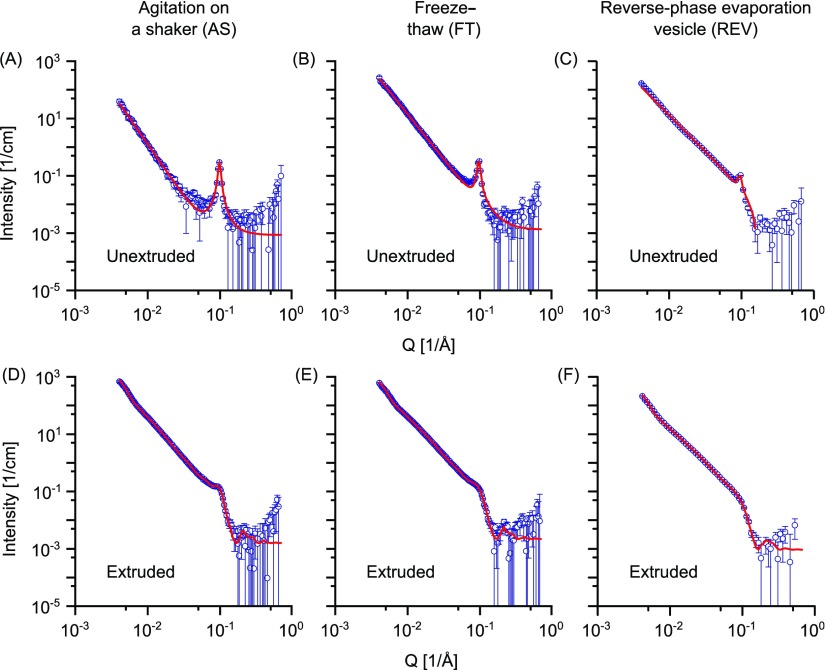
To probe whether our observations in the section above with DPPC vesicles were limited to lipids in the gel phase, we conducted the same experiments with liquid-crystalline-phase POPC vesicles to evaluate the effect of the formulation method on their lamellarity. SANS data and fitting curves for POPC vesicles are shown in Figure 3. Unextruded POPC vesicles prepared via the AS or the FT cycle methods present the characteristic Bragg peak at Q = 0.098 and 0.096 Å–1, respectively (Figure 3A,B), typical of multilamellar systems. Scattering data for the unextruded POPC vesicles prepared via the AS and FT methods were fitted using a Broad Peak model (Table S3). Also in this case, the vesicle radii are too large to capture their overall dimensions in our measured Q range. The extruded POPC vesicles (Figure 3D,E) also exhibit an apparent residual multilamellarity after extrusion, as evidenced by the small Bragg peak at Q = 0.095 Å–1.
Figure 3.
SANS data of unextruded POPC vesicles prepared via the (A) AS method, (B) FT method, and (C) REV method, and POPC vesicles prepared via the (D) AS method, (E) FT method, and (F) REV method then extruded through a 100 nm membrane. Points with errors represent measured data and lines are fittings curves by a Broad Peak model (A,B) and models with uni-, bi-, tri- and quadrilamellar vesicle components (D–F). Data are plotted on a log–log scale.
A custom-built model was used to fit the extruded POPC vesicles produced via AS and FT methods. While the bilamellar model was sufficient for good fits of gel-phase DPPC, for the POPC vesicles, we required a model that is a combination of standard multishell vesicle models to take into account the presence of bi-, tri- and quadrilamellar vesicles (see Supporting Information). Fitting parameters are reported in Table 1. The values of the best-fit bilayer thickness are in good agreement with previously reported data for extruded POPC vesicles.22 We have previously observed a bilamellar subpopulation comprising 7 vol % in POPC vesicles extruded to 50 nm.23 It has also been previously reported that extrusion of POPC vesicles 29 times through a 100 nm membrane yields a predominantly unilamellar distribution with a subpopulation of multilamellar vesicles comprising 16% of the total vesicle number.24 We found a significantly higher proportion of multilamellarity in both AS and FT formulations extruded to 100 nm, with only 71–75 vol % of vesicles being unilamellar. The majority of the multilamellar population was bilamellar vesicles (for exact figures, see Table 1). In cryo-TEM of AS-prepared vesicles (Figure S2), we also observed onion-like, trilamellar and bilamellar vesicles. Such a percentage of multilamellar structures could have a significant effect on the efficacy of vesicle-based drug encapsulation and release systems. Interestingly, while we required a quadrilamellar population for a good fit in the AS-prepared vesicles, the FT-prepared vesicles were adequately fitted with only uni-, bi-, and trilamellar subpopulations. This suggests a potential beneficial effect of the FT cycles and is in agreement with a previous study that has shown that repeated FT cycles reduce vesicle multilamellarity.25 POPC vesicle populations prepared via the FT formulation method were also slightly smaller than those prepared by the AS and REV methods. In the case of REV-formulations from POPC, unlike in DPPC vesicle formulations, unextruded vesicles did exhibit some degree of multilamellarity (Figure 3C). Unextruded POPC vesicles were fitted in this case with a Broad Peak model (Table S3). A model adjusted to account for bilamellar vesicles was used to fit the extruded REV vesicles scattering curve (Figure 3F). It appears in this case that after extrusion 11% of the total vesicle population by particle volume is bilamellar. Calculations for the fractions of multilamellar vesicles as a function of total particle volume, number, and lipid are reported in Table S4. It is worth mentioning that for both the AS and the FT methods, roughly 50% of the total lipid ends up in multilamellar structures, whereas for the REV method approximately 20% ends up in bilamellar vesicles. Additionally, the best-fit bilayer thickness for vesicles prepared via the REV method is slightly larger than for those prepared via AS or FT methods, possibly because of the presence of residual organic solvent in the vesicle membrane. A possible explanation for increased multilamellarity of POPC versus DPPC vesicle formulations is that, upon lipid film hydration, some of the multilamellar vesicles formed from POPC lipid films are already similar in size to the pore sizes of the membrane used for extrusion. This results in the persistence of multilamellar structures after the extrusion. Although the mechanism of multilamellar vesicles formation from dry phospholipid films is yet to be fully understood, some parameters are known to play an important role in the whole process. Among these, the membrane bending rigidity κc (defined as the energy required to bend a surfactant film) can affect the formation of vesicles.26,27 Compared with DPPC bilayers, POPC bilayers have a lower membrane bending rigidity (κc = 1.5 × 10⁻¹⁹ and κc = 0.332 × 10⁻¹⁹ J for DPPC and POPC bilayers, respectively28,29), which may favor the phospholipid self-assembly in small multilamellar vesicles upon lipid film hydration. Nevertheless, DLS measurements of POPC vesicles that were prepared via the AS or FT methods and extruded through a 100 nm pore-sized membrane showed monodisperse vesicle populations with hydrodynamic diameters of 118 ± 37 and 109 ± 32 nm, respectively (Figure S3B).
Effect of a PEGylated Phospholipid
Because of the potential tendency of POPC to form small multilamellar structures, we hypothesized that the introduction of a bulky hydrophilic component in the vesicle composition could sterically hinder the formation of such small multilamellar structures by inhibiting lamellar stacking. Surface-active compounds such as short-chain lecithin or mono dodecyl ether can favor the formation of unilamellar structures when introduced in the vesicle composition, although the mechanism behind this behavior is not clear.30,31 For our purposes, we used a PEG-containing phospholipid. PEG has been extensively used in liposomal formulations for drug delivery as a stabilizing agent against aggregation and protein adsorption.32 Depending on the molar fraction of the PEGylated lipid in the liposome formulation, the PEG chains assume a “mushroom” or a “brush-like” configuration on the liposome surface.33 For our purposes, we investigated whether a PEG-containing phospholipid could prevent the formation of multilamellar structures in extruded vesicles. We prepared vesicles including a small mol % of DOPE-PEG2000 of DPPC, POPC, or DOPC via the FT method and extruded 35 times through a membrane with 100 nm pore size. These three phospholipids present three different degrees of alkyl chain saturation: DPPC has two saturated alkyl chains, POPC has one saturated and one unsaturated alkyl chain, and DOPC has two unsaturated alkyl chains. DOPC also belongs to the phosphatidylcholine family and has a transition temperature of −17 °C and is therefore in the liquid phase at 25 °C.
PEGylated POPC Vesicles
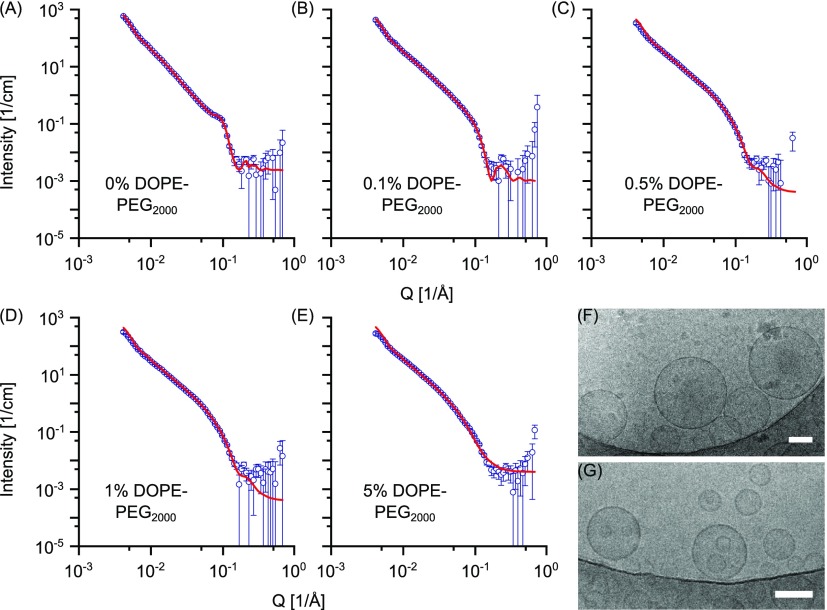
SANS data of POPC-PEGylated vesicles are shown in Figure 4. Compared with the pure POPC vesicles, the unextruded POPC vesicles containing PEGylated phospholipids show the presence of a second peak at Q ≈ 0.037 Å–1 (Figure S4). This second peak is representative of the multilamellarity of PEG regions and is more evident with increasing PEGylated phospholipid percentage in the liposomes composition. Extruded POPC vesicles with 0.1 mol % DOPE-PEG2000 still exhibit a small Bragg peak, whereas extruded vesicles with higher DOPE-PEG2000 mol % do not, indicating a substantial reduction of multilamellar structures.
Figure 4.
SANS data of POPC vesicles prepared via the FT method and DOPE-PEG2000 at (A) 0, (B) 0.1, (C) 0.5, (D) 1, and (E) 5 mol %, respectively. Vesicles were extruded through 100 nm membrane 35 times. Points with errors represent measured data and lines are fittings curves by models with uni-, bi- and trilamellar vesicle components. Scattering data are plotted on a log–log scale. (F) Cryo-TEM of unextruded POPC vesicles containing 5 mol % DOPE-PEG2000. (G) Cryo-TEM of POPC vesicles containing 5 mol % DOPE-PEG2000 and extruded through a 100 nm membrane 35 times. In both cases, vesicles were prepared via the FT method. Scale bar: 100 nm.
A custom-built model that accounted for bilamellar vesicles was used to fit the extruded POPC vesicles with 0.1 mol % DOPE-PEG2000 lipid, whereas a unilamellar vesicle model was sufficient for the higher PEGylated lipid content. Fitting parameters are reported in Table 2.
Table 2. Fitting Parameters of SANS Data of Extruded DOPC, POPC, and DPPC Ensembles Containing Varying mol % of DOPE-PEG2000 and Prepared via the FT Methoda.
| proportion
of total % |
||||||||||
|---|---|---|---|---|---|---|---|---|---|---|
| lipid | PEG mol % | model | component | rc | ts | tw | Rtotal | vol | num | lipid |
| POPC | 0 | trilamellar | unilamellar | 566 | 37 | 603 | 70 | 81 | 57 | |
| bilamellar | 578 | 37 | 25 | 677 | 17 | 14 | 23 | |||
| trilamellar | 671 | 37 | 26 | 834 | 13 | 5 | 20 | |||
| 0.1 | bilamellar | unilamellar | 626 | 37 | 663 | 94 | 95 | 91 | ||
| bilamellar | 610 | 37 | 30 | 714 | 6 | 5 | 9 | |||
| 0.5 | unilamellar | unilamellar | 576 | 37 | 613 | 100 | 100 | 100 | ||
| 1 | unilamellar | unilamellar | 579 | 37 | 616 | 100 | 100 | 100 | ||
| 5 | unilamellar | unilamellar | 551 | 38 | 589 | 100 | 100 | 100 | ||
| DOPC | 0 | trilamellar | unilamellar | 574 | 37 | 611 | 74 | 79 | 61 | |
| bilamellar | 552 | 37 | 26 | 652 | 16 | 14 | 23 | |||
| trilamellar | 550 | 37 | 27 | 715 | 9 | 6 | 16 | |||
| 0.1 | unilamellar | unilamellar | 652 | 37 | 689 | 100 | 100 | 100 | ||
| 0.5 | unilamellar | unilamellar | 899 | 37 | 936 | 100 | 100 | 100 | ||
| 1 | unilamellar | unilamellar | 898 | 37 | 935 | 100 | 100 | 100 | ||
| 5 | unilamellar | unilamellar | 612 | 37 | 649 | 100 | 100 | 100 | ||
| DPPC | 0 | bilamellar | unilamellar | 662 | 45 | 707 | 87 | 86 | 79 | |
| bilamellar | 566 | 45 | 32 | 688 | 13 | 14 | 21 | |||
| 0.1 | unilamellar | unilamellar | 563 | 44 | 607 | 100 | 100 | 100 | ||
| 0.5 | unilamellar | unilamellar | 566 | 43 | 609 | 100 | 100 | 100 | ||
| 1 | unilamellar | unilamellar | 544 | 44 | 588 | 100 | 100 | 100 | ||
| 5 | cylindervesicleb | |||||||||
The fitted core radius rc, ts, tw, and the total radius Rtotal are reported in Å.
See Table S8.
The best-fit bilayer thickness remains almost constant at 37 Å with increasing PEGylated lipid content up to 1 mol %. For PEG lipids with polymer molecular weight of 2000 g/mol, the transition from mushroom to the brush regime of the polymer chains is expected to happen at 1.4 mol % PEGylated lipid for liquid-phase systems.34 Therefore, up to 1 mol % DOPE-PEG2000, the PEG chains should be in the mushroom configuration, while for 5 mol % DOPE-PEG2000, they should be in the brush-like configuration. This may explain the increase in best-fit bilayer thickness to 38 Å for the vesicles containing 5 mol % DOPE-PEG2000, where the PEG fully covers the vesicle surface and the PEG moieties are extended in the “brush” configuration. The water layer thickness between the bilayers slightly increases with increasing DOPE-PEG2000 content, possibly because of the presence of the PEG. The percentage of multilamellar vesicles is greatly reduced with 0.1 mol % DOPE-PEG2000 and disappears with as little as 0.5 mol % DOPE-PEG2000, as shown from the fittings of the scattering curves. A further increase of the PEGylated lipid content leads to a complete removal of this residual multilamellarity. In particular, cryo-TEM showed that unextruded POPC vesicles containing 5 mol % DOPE-PEG2000 are unilamellar (Figure 4F) and extrusion therefore only reduces their size (Figure 4G). Calculations for the bi- and trilamellar vesicle component for extruded POPC vesicles with varying amounts of DOPE-PEG2000 are reported in Table S5. For extruded POPC vesicles containing 0.1 mol % DOPE-PEG2000 the bilamellar vesicles represent around 6% of the total particle volume and number. The fraction of lipid that ends up in bilamellar structures is in this case 9%.
PEGylated DOPC Vesicles
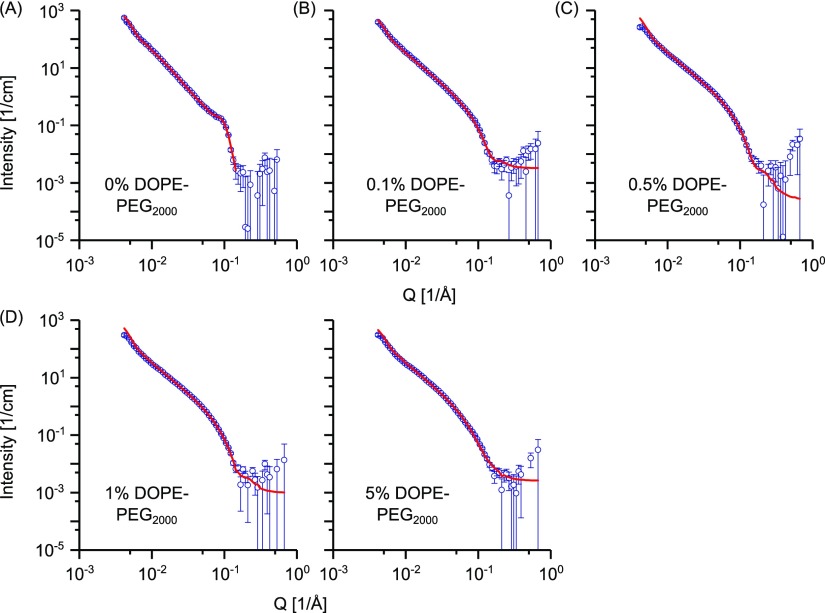
DOPC vesicles exhibited a similar behavior to POPC-based vesicles. Neutron scattering profiles for the DOPC vesicles and fitting curves are shown in Figure 5. Unextruded DOPC vesicles (Figure S5A) present a Bragg peak at Q ≈ 0. 1 Å–1; this multilamellarity is partially retained after extrusion, and the data were fitted with a custom-built model to take into account of the presence of bi- and trilamellar vesicles. The introduction of as little as 0.1 mol % of the DOPE-PEG2000 lipid has a beneficial effect on reducing vesicle multilamellarity (cf. reduction of the Bragg peak for the unextruded sample (Figure S5B)) and unextruded vesicles containing 0.5, 1, and 5 mol % DOPE-PEG2000 lipid (Figure S5C–E). A lower mol % of DOPE-PEG2000 is needed to remove multilamellarity for DOPC vesicles compared with POPC.
Figure 5.
SANS data of DOPC vesicles prepared via the FT method and containing DOPE-PEG2000 at (A) 0, (B) 0.1, (C) 0.5, (D) 1, and (E) 5 mol %, respectively. Vesicles were extruded through 100 nm membrane 35 times. Points with errors represent measured data, and lines are fitting curves by models with uni-, bi- and trilamellar vesicle components. Data are plotted on a log–log scale.
The fitting parameters are reported in Table 2. The best-fit bilayer thickness is consistent with the values reported in the literature for extruded DOPC vesicles,22 and vesicle diameters are in the region of 120–170 nm. For extruded DOPC vesicles, the fraction of bilamellar vesicles represents around 16% of the total particle volume while the trilamellar vesicles represent less than 10% and roughly 40% of the total lipid ends up in multilamellar vesicles. However, with the addition of just 0.1 mol % of DOPE-PEG2000, all of the lipids are formulated into unilamellar vesicles and the theoretical vesicle yield is therefore significantly increased. Detailed calculations are found in Table S6.
PEGylated DPPC Vesicles
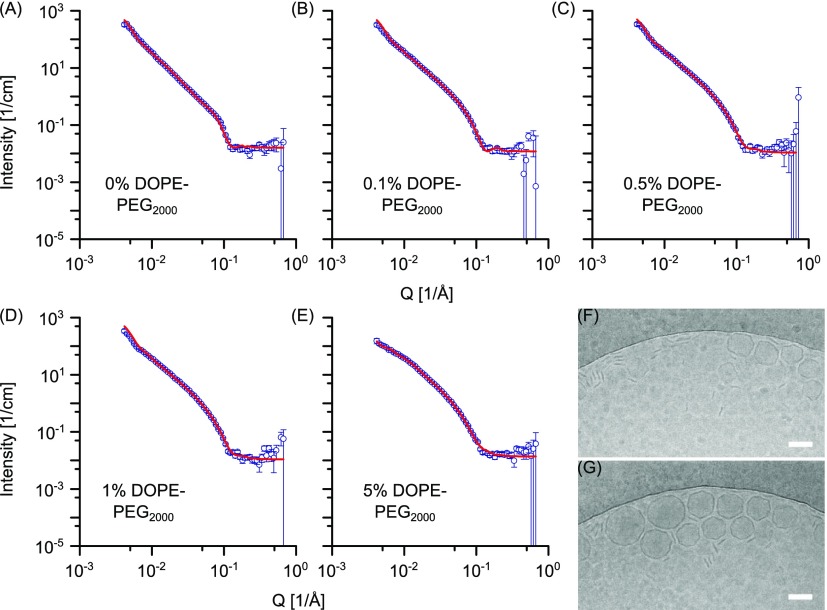
The measured SANS data and the fitting curves for the DPPC DOPE-PEG2000 ensembles are shown in Figure 6. Unextruded DPPC vesicles containing 0.1 mol % DOPE-PEG2000 data still present the Bragg peak at Q ≈ 0. 1 Å–1, although it is less pronounced if compared with pure DPPC vesicles prepared via the same method (Figure S6A,B). For DOPE-PEG2000 content of 0.5 mol % and above, the Bragg peak disappears (Figure S6C–E). Scattering profiles of extruded DPPC vesicles with 0.1, 0.5, and 1 mol % DOPE-PEG2000 do not show any residual contribution of the Bragg peak and can be fitted by a unilamellar vesicle model. The fitting parameters are reported in Table 2 while detailed calculations for the lamellarity are reported in Table S7. The best-fit bilayer thickness is consistent with the values reported in the literature for extruded DPPC vesicles. Extruded vesicles containing 0.1, 0.5, and 1 mol % DOPE-PEG2000 present a vesicle diameter of around 120 nm (for exact values of radii in Å see Table 2). Interestingly, the SANS data for the 5 mol % DOPE-PEG2000 reveal a coexistence of cylindrical micelles and vesicles. It has been previously reported that DPPC is able to form micellar structures when a PEGylated phospholipid with saturated alkyl chains is introduced. With the increasing PEGylated lipid content, there is a transition from liposome to discoidal and then spherical micelles.35,36 To our knowledge, this is the first evidence of the formation of cylindrical micelles of DPPC and a PEGylated phospholipid with unsaturated alkyl chains. Cryo-TEM (Figure 6G) also confirmed the coexistence of micelles and vesicular structures. The 5 mol % DOPE-PEG2000 DPPC scattering data were consistent with an elliptical cylinder model combined with a unilamellar vesicle model (Supporting Information). Fitting parameters are reported in Table S8. Fitting of the 5 mol % DOPE-PEG2000 extruded DPPC ensembles allowed the estimation of some characteristic parameters. Micellar structures account for 47 vol % and can be fitted as 378 Å long elliptical cylindrical structures, with a cross-sectional minor radius of 35 Å and major radius of 175 Å. Vesicular ensembles are unilamellar, accounting for 53 vol % of the total population and have a diameter of around 150 nm. As opposed to the formulation of DPPC with 5 mol % DOPE-PEG2000, characterized by a substantial amount of cylindrical micelles, formulations of DOPC or POPC with 5 mol % DOPE-PEG2000 gave unilamellar vesicle populations. This interesting behavior may be due to the differences in lipid natural curvature and bilayer phase for DPPC compared to POPC and DOPC. Phosphatidylcholine lipids have on average a cylindrical shape, although the presence of chain unsaturation alters the natural curvature of the lipids. In this sense, DPPC has a “pure” cylindrical shape, while POPC and DOPC present a more open configuration because of chain unsaturation.37,38 Therefore, it is likely that DPPC, because of its cylindrical shape, is more able to adopt a geometry with flatter lipid sheets. This may also be favored by the fact that DPPC is in the gel phase, which imparts a more rigid configuration to the bilayer. POPC and DOPC are instead in the liquid-crystalline phase, normally associated with a very fluid membrane. Taken together, these factors may explain the tendency of DPPC to form cylindrical structures when mixed with 5 mol % DOPE-PEG2000.
Figure 6.
SANS data of DPPC vesicles prepared via the FT method and containing DOPE-PEG2000 at (A) 0, (B) 0.1, (C) 0.5, (D) 1, and (E) 5 mol %, respectively. Vesicles were extruded through 100 nm membrane 35 times. Points with errors represent measured data and lines are fittings curves by models with uni-, bi- and trilamellar vesicle components (A–D) and with a cylindrical and unilamellar vesicle component (E). Scattering data are plotted on a log–log scale. (F,G) Cryo-TEM of DPPC vesicles containing 5 mol % DOPE-PEG2000, showing coexistence of cylindrical micelles and highly faceted vesicular structures. Scale bar: 100 nm.
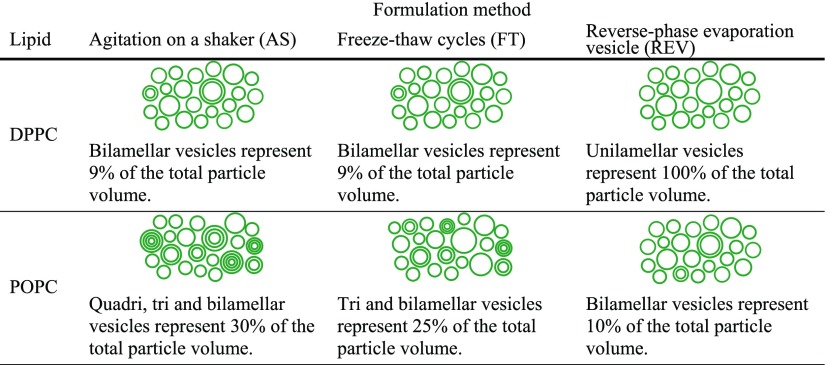
Through systematic SANS analysis, we have shown that formulation method has a pronounced effect on lamellarity of DPPC and POPC vesicle populations. In particular, for DPPC vesicles, AS and FT both gave multilamellar, unextruded, and mixed unilamellar/bilamellar extruded populations. For POPC vesicles, AS and FT both gave multilamellar unextruded populations that became predominantly unilamellar with residual presence of bi-, tri- and quadrilamellar populations upon extrusion. The reverse-phase evaporation vesicle method however yielded a unilamellar extruded population in the case of DPPC and a mixed unilamellar/bilamellar extruded population in the case of POPC. Table 3 shows a summary of the effect of the different methods on the vesicle lamellarity for DPPC and POPC liposomes. These findings are very important for vesicle design and development. Estimates of the vesicle number and proportion of lipids assembled into unilamellar structures show that the formulation method needs to be carefully tailored to the specific application. For example, 10% of POPC vesicles are bilamellar when prepared via the REV method, while around 30% are multilamellar when the FT or AS methods are used.
Table 3. Summary Table for Extruded DPPC and POPC Vesicles Prepared via the AS, FT, and REV Methods.
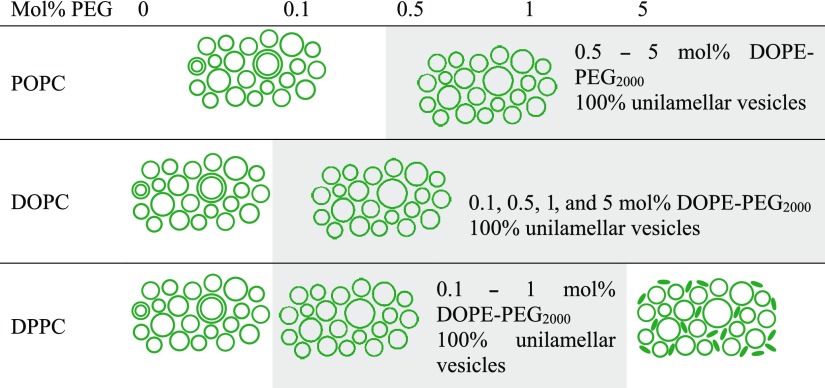
The introduction of a PEGylated phospholipid in the vesicle composition helped in reducing or completely removing any residual multilamellarity for POPC, DOPC, and DPPC. Additionally, it was found that introduction of 5 mol % of the DOPE-PEG2000 lipid led to the formation of a mixed population of cylindrical micelles and unilamellar vesicles in the case of DPPC and unilamellar vesicles in the case of POPC and DOPC. A summary of the structures obtained with different molar fraction of the PEGylated lipid is shown in Table 4.
Table 4. Summary Table Showing the Structures Obtained for Extruded POPC, DOPC, and DPPC Vesicles with Varying mol % of DOPE-PEG2000a.
All formulations with 0 mol % DOPE-PEG2000 and POPC vesicles with 0.1 mol % DOPE-PEG2000, contained varying degrees of bi- and multilamellar vesicles. Formulations of DPPC with 5 mol% DOPE-PEG2000 comprised a mixture of cylindrical micelles and unilamellar vesicles.
Conclusion
This study provides important insights into lamellar lipid self-assembly and the design of liposomal carriers. Different formulation methods cannot be expected to yield the same vesicle populations, and their outcomes depend on the chosen lipid composition. The formulation method has a pronounced effect on the bulk characteristics of vesicle populations, in particular on the proportion of vesicles with non-unilamellar morphology. For example, while REV-formulated POPC vesicles exhibit a smaller overall proportion of multilamellarity, formulations prepared using the REV, FT and AS methods all contain similar proportions of bilamellar liposomes. The introduction of PEGylated lipids also has a pronounced effect on lamellarity, with addition of only 0.1 mol % PEG (where the PEG is expected to be in the mushroom configuration) introduced to DOPC samples changing the proportion of lamellarity from 40 to 0 vol %. These considerations are of huge importance when designing liposome-based drug delivery and diagnostic platforms. Applications that require a defined membrane structure demand careful choice of the formulation method and the lipid composition, which are fundamental in determining vesicle lamellarity.
Experimental Section
Materials
DPPC, POPC, DOPC, and 1,2-dioleoyl-sn-glycero-3-phosphoethanolamine-N-[methoxy(polyethylene glycol)-2000] (DOPE-PEG2000) were purchased from Avanti Polar Lipids (Alabaster, AL). Methanol (VWR Chemicals) and diisopropyl ether (VWR Chemicals) were used as purchased. Deuterated water (D2O) was purchased from Sigma-Aldrich. PBS in deuterated water (dPBS) was prepared by dissolving the appropriate amount of Gibco PBS tablets (manufacturer’s composition: 10 mM sodium phosphates, 2.68 mM potassium chloride, 140 mM sodium chloride) (ThermoFisher Scientific) in D2O.
Liposome Preparation
Liposomes were prepared according to three different methods: film hydration followed by AS or 5 FT cycles and reverse-phase evaporation vesicle (REV). The lipid concentrations were 4 mg/mL for the AS and FT methods and 10 mg/mL for the REV method. Briefly, a solution of phospholipids in chloroform was dried with an N2 stream in a glass vial. AS method: The lipid film was kept under vacuum in a freeze dryer overnight and then hydrated with dPBS under continuous stirring at 55 °C for an hour (DPPC) or hydrated with dPBS and agitated 6 times × 10 s on a vortex shaker at room temperature (POPC). FT method: Vesicles were incubated with dPBS and heat cycled five times between −80 and 55 °C. REV method: A solution of phospholipids in chloroform was dried in a round-bottom flask by rotary evaporation under vacuum. The lipid film was resuspended in methanol (0.8 mL) and 10% PBS in D2O (1 mL) and diisopropyl ether (3 mL) were added to the mixture. The lipid suspension was sonicated for 5 min at 5 °C in a sonicating bath to form a stable emulsion. The organic solvents were slowly removed by rotary evaporation under vacuum. The vesicle suspension was then kept at 55 °C for 30 min. DPPC, POPC, and DOPC vesicles containing varying amounts of DOPE-PEG were formulated via the FT method described above. All of the liposome suspensions were extruded 35 times through a 100 nm polycarbonate membrane (Whatman Nucleopore Track-Etched membranes) at 55 °C (DPPC) or 25 °C (POPC and DOPC) using the Avanti Mini-Extruder kit. Samples for cryo-TEM were prepared in 1× PBS.
Small-Angle Neutron Scattering
Measurements were performed at the SANS2D beamline of the ISIS pulsed neutron source at the Rutherford Appleton Laboratory (Didcot, UK) using a sample changer and 1 mm path length quartz cuvette cells. Samples were measured at 25 °C. The pinhole collimation was set to L1 = L2 = 4 m while sample-detector distances were configured to give a scattering vector Q = (4π/λ)sin(θ/2) range of 0.004–0.722 Å–1, where θ is the scattering angle and neutrons of wavelengths λ of 1.75–16.5 Å were used simultaneously by time of flight. Data reduction was performed using MantidPlot,39 and the SANS curves were fitted with SasView v3.1.2.40 For a detailed description of the models used, see the Supporting Information.
Cryo-Transmission Electron Microscopy
Samples for cryo-TEM were prepared using an automatic plunge freezer (Leica EM GP). Briefly, 4 μL of the sample was injected on plasma-treated (15 s with O2/H2 1:1 on a Gatan SOLARIS plasma cleaner) QuantiFoil R2/1 copper grids (Electron Microscopy Supplies) in an environmental chamber (relative humidity: 90%, temperature: 20 °C). Excess suspension was blotted on the filter paper, and the obtained film was vitrified in liquid ethane. Samples were stored in liquid nitrogen and imaged at −170 °C (Gatan 914 cryo-holder for cryo-EM imaging) in a JEOL 2100Plus transmission electron microscope at 200 kV using Minimum Dose System software. Micrographs were acquired over 5 s exposure times, using a Gatan Orius SC 1000 camera at either 30k or 15k magnification and image binning of 1 × 1.
DLS Measurements
Samples for DLS were diluted to 1% of the measured SANS concentration in PBS. Measurements were acquired with a Malvern ZetaSizer; normalized intensity distributions are reported as a function of the hydrodynamic diameter.
Data Availability
Raw data are available online at DOI: 10.5281/zenodo.2577923.
Acknowledgments
V.N. acknowledges the support from the Ermenegildo Zegna Founder’s Scholarship program. V.N. and M.M.S. acknowledge support from the Rosetrees Trust. M.N.H. acknowledges the support from the FP7 Marie Curie Intra-European Fellowship “SMase LIPOSOME” (626766). This research is published with the support of the Swiss National Science Foundation (P300PA_171540 and 406240_147493). M.R.T. and M.M.S. acknowledge the support from the i-sense Engineering and Physical Sciences Research Council (EPSRC) 1610368IRC in Early Warning Sensing Systems for Infectious Diseases (EP/K031953/1; www.i-sense.org.uk). M.R.T. and M.M.S. acknowledge the support from the Medical Research Council (MRC) grant “m-Africa” (MR/P024378/1). U.K. acknowledges the support from the Deutsche Forschungsgemeinschaft (KA4370/1-1). M.M.S. acknowledges support a Wellcome Trust Senior Investigator Award (098411/Z/12/Z). Experiments at the ISIS Neutron and Muon Source were supported by a beamtime allocation from the Science and Technology Facilities Council (RB1610368 and RB1710255). This work benefited from the use of the SasView application, originally developed under NSF award DMR-0520547. SasView contains code developed with funding from the European Union’s Horizon 2020 research and innovation programme under the SINE2020 project, grant agreement 654000. We acknowledge use of microscopy facilities within the Harvey Flower Electron Microscopy Suite, Department of Materials, Imperial College London. The authors would like to thank Dr. Richard K. Heenan for insightful discussion of the SANS data analysis.
Supporting Information Available
The Supporting Information is available free of charge on the ACS Publications website at DOI: 10.1021/acs.langmuir.8b04256.
Description of the models used for the fitting of the neutron scattering data, additional analysis of SANS data, cryo-TEM micrographs, and DLS measurements of extruded POPC and DPPC vesicles formulated via the AS and FT methods and neutron scattering profiles of the unextruded vesicle formulations containing varying mol % of the PEGylated phospholipid (PDF)
The authors declare no competing financial interest.
Supplementary Material
References
- Mazur F.; Bally M.; Städler B.; Chandrawati R. Liposomes and lipid bilayers in biosensors. Adv. Colloid Interface Sci. 2017, 249, 88–99. 10.1016/j.cis.2017.05.020. [DOI] [PubMed] [Google Scholar]
- Pattni B. S.; Chupin V. V.; Torchilin V. P. New Developments in Liposomal Drug Delivery. Chem. Rev. 2015, 115, 10938–10966. 10.1021/acs.chemrev.5b00046. [DOI] [PubMed] [Google Scholar]
- Liu Q.; Boyd B. J. Liposomes in biosensors. Analyst 2013, 138, 391–409. 10.1039/c2an36140j. [DOI] [PubMed] [Google Scholar]
- Mura S.; Nicolas J.; Couvreur P. Stimuli-responsive nanocarriers for drug delivery. Nat. Mater. 2013, 12, 991. 10.1038/nmat3776. [DOI] [PubMed] [Google Scholar]
- Zucker D.; Marcus D.; Barenholz Y.; Goldblum A. Liposome drugs’ loading efficiency: A working model based on loading conditions and drug’s physicochemical properties. J. Controlled Release 2009, 139, 73–80. 10.1016/j.jconrel.2009.05.036. [DOI] [PubMed] [Google Scholar]
- Fatouros D. G.; Antimisiaris S. G. Effect of Amphiphilic Drugs on the Stability and Zeta-Potential of Their Liposome Formulations: A Study with Prednisolone, Diazepam, and Griseofulvin. J. Colloid Interface Sci. 2002, 251, 271–277. 10.1006/jcis.2002.8432. [DOI] [PubMed] [Google Scholar]
- Fröhlich M.; Brecht V.; Peschka-Süss R. Parameters influencing the determination of liposome lamellarity by 31P-NMR. Chem. Phys. Lipids 2001, 109, 103–112. 10.1016/s0009-3084(00)00220-6. [DOI] [PubMed] [Google Scholar]
- Duplessis J.; Ramachandran C.; Weiner N.; Muller D. The influence of lipid composition and lamellarity of liposomes on the physical stability of liposomes upon storage. Int. J. Pharm. 1996, 127, 273–278. 10.1016/0378-5173(95)04281-4. [DOI] [Google Scholar]
- Pentak D.; Sułkowski W. W.; Maślanka S.; Wolińska A.; Duber S.; Sułkowska A. Characteristics of Liposomes Prepared by the Modified Reverse-Phase Evaporation Method: 31P-NMR and TEM Study. Macromol. Symp. 2007, 245–246, 476–484. 10.1002/masy.200651368. [DOI] [Google Scholar]
- Hollamby M. J. Practical applications of small-angle neutron scattering. Phys. Chem. Chem. Phys. 2013, 15, 10566–10579. 10.1039/c3cp50293g. [DOI] [PubMed] [Google Scholar]
- Bangham A. D.; Standish M. M.; Watkins J. C. Diffusion of univalent ions across the lamellae of swollen phospholipids. J. Mol. Biol. 1965, 13, 238–252. 10.1016/s0022-2836(65)80093-6. [DOI] [PubMed] [Google Scholar]
- Chapman C. J.; Erdahl W. L.; Taylor R. W.; Pfeiffer D. R. Factors affecting solute entrapment in phospholipid vesicles prepared by the freeze-thaw extrusion method: a possible general method for improving the efficiency of entrapment. Chem. Phys. Lipids 1990, 55, 73–83. 10.1016/0009-3084(90)90068-3. [DOI] [PubMed] [Google Scholar]
- Ong S.; Chitneni M.; Lee K.; Ming L.; Yuen K. Evaluation of Extrusion Technique for Nanosizing Liposomes. Pharmaceutics 2016, 8, 36. 10.3390/pharmaceutics8040036. [DOI] [PMC free article] [PubMed] [Google Scholar]
- Hinna A.; Steiniger F.; Hupfeld S.; Stein P.; Kuntsche J.; Brandl M. Filter-extruded liposomes revisited: a study into size distributions and morphologies in relation to lipid-composition and process parameters. J. Liposome Res. 2016, 26, 11–20. 10.3109/08982104.2015.1022556. [DOI] [PubMed] [Google Scholar]
- Szoka F.; Papahadjopoulos D. Procedure for preparation of liposomes with large internal aqueous space and high capture by reverse-phase evaporation. Proc. Natl. Acad. Sci. U.S.A. 1978, 75, 4194. 10.1073/pnas.75.9.4194. [DOI] [PMC free article] [PubMed] [Google Scholar]
- Uran S.; Larsen Å.; Jacobsen P. B.; Skotland T. Analysis of phospholipid species in human blood using normal-phase liquid chromatography coupled with electrospray ionization ion-trap tandem mass spectrometry. J. Chromatogr. B: Biomed. Sci. Appl. 2001, 758, 265–275. 10.1016/s0378-4347(01)00188-8. [DOI] [PubMed] [Google Scholar]
- Nieh M.-P.; Glinka C. J.; Krueger S.; Prosser R. S.; Katsaras J. SANS Study on the Effect of Lanthanide Ions and Charged Lipids on the Morphology of Phospholipid Mixtures. Biophys. J. 2002, 82, 2487–2498. 10.1016/s0006-3495(02)75591-4. [DOI] [PMC free article] [PubMed] [Google Scholar]
- Lemmich J.; Mortensen K.; Ipsen J. H.; Hønger T.; Bauer R.; Mouritsen O. G. Small-angle neutron scattering from multilamellar lipid bilayers: Theory, model, and experiment. Phys. Rev. E: Stat. Phys., Plasmas, Fluids, Relat. Interdiscip. Top. 1996, 53, 5169–5180. 10.1103/physreve.53.5169. [DOI] [PubMed] [Google Scholar]
- Sun W. J.; Tristram-Nagle S.; Suter R. M.; Nagle J. F. Structure of gel phase saturated lecithin bilayers: temperature and chain length dependence. Biophys. J. 1996, 71, 885–891. 10.1016/s0006-3495(96)79290-1. [DOI] [PMC free article] [PubMed] [Google Scholar]
- Jousma H.; Talsma H.; Spies F.; Joosten J. G. H.; Junginger H. E.; Crommelin D. J. A. Characterization of liposomes. The influence of extrusion of multilamellar vesicles through polycarbonate membranes on particle size, particle size distribution and number of bilayers. Int. J. Pharm. 1987, 35, 263–274. 10.1016/0378-5173(87)90139-6. [DOI] [Google Scholar]
- Berger N.; Sachse A.; Bender J.; Schubert R.; Brandl M. Filter extrusion of liposomes using different devices: comparison of liposome size, encapsulation efficiency, and process characteristics. Int. J. Pharm. 2001, 223, 55–68. 10.1016/s0378-5173(01)00721-9. [DOI] [PubMed] [Google Scholar]
- Kučerka N.; Tristram-Nagle S.; Nagle J. F. Structure of Fully Hydrated Fluid Phase Lipid Bilayers with Monounsaturated Chains. J. Membr. Biol. 2006, 208, 193–202. 10.1007/s00232-005-7006-8. [DOI] [PubMed] [Google Scholar]
- Holme M. N.; Rashid M. H.; Thomas M. R.; Barriga H. M. G.; Herpoldt K.-L.; Heenan R. K.; Dreiss C. A.; Bañuelos J. L.; Xie H.-N.; Yarovsky I.; Stevens M. M. Fate of Liposomes in the Presence of Phospholipase C and D: From Atomic to Supramolecular Lipid Arrangement. ACS Cent. Sci. 2018, 4, 1023–1030. 10.1021/acscentsci.8b00286. [DOI] [PMC free article] [PubMed] [Google Scholar]
- Schmiedel H.; Almásy L.; Klose G. Multilamellarity, structure and hydration of extruded POPC vesicles by SANS. Eur. Biophys. J. 2006, 35, 181–189. 10.1007/s00249-005-0015-9. [DOI] [PubMed] [Google Scholar]
- Castile J. D.; Taylor K. M. G. Factors affecting the size distribution of liposomes produced by freeze-thaw extrusion. Int. J. Pharm. 1999, 188, 87–95. 10.1016/s0378-5173(99)00207-0. [DOI] [PubMed] [Google Scholar]
- Gentile L.; Behrens M. A.; Porcar L.; Butler P.; Wagner N. J.; Olsson U. Multilamellar Vesicle Formation from a Planar Lamellar Phase under Shear Flow. Langmuir 2014, 30, 8316–8325. 10.1021/la501071s. [DOI] [PubMed] [Google Scholar]
- Gentile L.; Silva B. F. B.; Balog S.; Mortensen K.; Olsson U. Structural transitions induced by shear flow and temperature variation in a nonionic surfactant/water system. J. Colloid Interface Sci. 2012, 372, 32–39. 10.1016/j.jcis.2012.01.027. [DOI] [PubMed] [Google Scholar]
- Solmaz M. E.; Sankhagowit S.; Biswas R.; Mejia C. A.; Povinelli M. L.; Malmstadt N. Optical stretching as a tool to investigate the mechanical properties of lipid bilayers. RSC Adv. 2013, 3, 16632–16638. 10.1039/c3ra42510j. [DOI] [PMC free article] [PubMed] [Google Scholar]
- Fernandez-Puente L.; Bivas I.; Mitov M. D.; Méléard P. Temperature and Chain Length Effects on Bending Elasticity of Phosphatidylcholine Bilayers. Europhys. Lett. 1994, 28, 181. 10.1209/0295-5075/28/3/005. [DOI] [Google Scholar]
- Gabriel N. E.; Roberts M. F. Spontaneous formation of stable unilamellar vesicles. Biochemistry 1984, 23, 4011–4015. 10.1021/bi00313a001. [DOI] [PubMed] [Google Scholar]
- Schmiedel H.; Jörchel P.; Kiselev M.; Klose G. Determination of Structural Parameters and Hydration of Unilamellar POPC/C12E4Vesicles at High Water Excess from Neutron Scattering Curves Using a Novel Method of Evaluation. J. Phys. Chem. B 2001, 105, 111–117. 10.1021/jp001712e. [DOI] [Google Scholar]
- Immordino M. L.; Dosio F.; Cattel L. Stealth liposomes: review of the basic science, rationale, and clinical applications, existing and potential. Int. J. Nanomed. 2006, 1, 297–315. [PMC free article] [PubMed] [Google Scholar]
- Garbuzenko O.; Barenholz Y.; Priev A. Effect of grafted PEG on liposome size and on compressibility and packing of lipid bilayer. Chem. Phys. Lipids 2005, 135, 117–129. 10.1016/j.chemphyslip.2005.02.003. [DOI] [PubMed] [Google Scholar]
- Marsh D.; Bartucci R.; Sportelli L. Lipid membranes with grafted polymers: physicochemical aspects. Biochim. Biophys. Acta, Biomembr. 2003, 1615, 33–59. 10.1016/s0005-2736(03)00197-4. [DOI] [PubMed] [Google Scholar]
- Edwards K.; Johnsson M.; Karlsson G.; Silvander M. Effect of polyethyleneglycol-phospholipids on aggregate structure in preparations of small unilamellar liposomes. Biophys. J. 1997, 73, 258–266. 10.1016/s0006-3495(97)78066-4. [DOI] [PMC free article] [PubMed] [Google Scholar]
- Johnsson M.; Edwards K. Liposomes, Disks, and Spherical Micelles: Aggregate Structure in Mixtures of Gel Phase Phosphatidylcholines and Poly(Ethylene Glycol)-Phospholipids. Biophys. J. 2003, 85, 3839–3847. 10.1016/s0006-3495(03)74798-5. [DOI] [PMC free article] [PubMed] [Google Scholar]
- Vanni S.; Hirose H.; Barelli H.; Antonny B.; Gautier R. A sub-nanometre view of how membrane curvature and composition modulate lipid packing and protein recruitment. Nat. Commun. 2014, 5, 4916. 10.1038/ncomms5916. [DOI] [PubMed] [Google Scholar]
- Strandberg E.; Tiltak D.; Ehni S.; Wadhwani P.; Ulrich A. S. Lipid shape is a key factor for membrane interactions of amphipathic helical peptides. Biochim. Biophys. Acta, Biomembr. 2012, 1818, 1764–1776. 10.1016/j.bbamem.2012.02.027. [DOI] [PubMed] [Google Scholar]
- Arnold O.; Bilheux J. C.; Borreguero J. M.; Buts A.; Campbell S. I.; Chapon L.; Doucet M.; Draper N.; Ferraz Leal R.; Gigg M. A.; Lynch V. E.; Markvardsen A.; Mikkelson D. J.; Mikkelson R. L.; Miller R.; Palmen K.; Parker P.; Passos G.; Perring T. G.; Peterson P. F.; Ren S.; Reuter M. A.; Savici A. T.; Taylor J. W.; Taylor R. J.; Tolchenov R.; Zhou W.; Zikovsky J. Mantid-Data analysis and visualization package for neutron scattering and μ SR experiments. Nucl. Instrum. Methods Phys. Res., Sect. A 2014, 764, 156–166. 10.1016/j.nima.2014.07.029. [DOI] [Google Scholar]
- http://www.sasview.org/ (accessed 27 July, 2016).
Associated Data
This section collects any data citations, data availability statements, or supplementary materials included in this article.
Supplementary Materials
Data Availability Statement
Raw data are available online at DOI: 10.5281/zenodo.2577923.


