

Abstract
Introduction
Drug use is a constantly evolving public health challenge. We present the use of Google Fusion Tables and Google Maps for the surveillance of drug-related deaths and discuss its potential large-scale use.
Methods
Demographic and geographic data for deaths related to cocaine and heroin use occurring from 2012-2014 was queried from the Jefferson County Coroner/Medical Examiner's Office. Fusion Tables was then used to plot each address onto a map.
Results
We developed a method to automatically import data into Fusion Tables. Individualized icons were then used to denote specific demographics and locations on a Google Map where filters could be applied to visualize findings such as only 18-25 year old white males. These features provided an easy means to visualize the relative high frequency of heroin-related deaths in white males. Furthermore, the date filters highlighted heroin-related deaths more than doubled in 2014 compared to previous years.
Conclusions
Mapping of health-related data has a long-standing history in public health, though its use in the forensic pathology community is limited. Fusion Tables provides users with the ability to visualize and analyze patterns and share data. Many geocoding solutions exist; however, we found this software to be user friendly and flexible. Our office now includes these visualizations into the annual summary that is provided to local law enforcement, public health officials, and the general public.
Keywords: Forensic pathology, Fusion tables, Map, Drugs, Overdose
Introduction
Drug use is a constantly evolving public health challenge. The epidemiology of drug use is important for public policy and research. According to 2013 data from the Substance Abuse and Mental Health Services Administration (SAMHSA), overall illicit drug use has recently increased (1). This increased drug use has led to a 102% increase in the rate of drug overdoses between 1999 and 2010 (2). Because most deaths suspected to be related to drug use are investigated by coroner's/medical examiner's offices (CMEO's), forensic pathologists have the potential to provide rapid insights into a community's drug use (3).
Mapping has long been used to identify geographic patterns of disease occurrence. Perhaps the most famous historical example is the mapping of cholera cases during the 1854 cholera outbreak in London (4). Dr. John Snow identified a cluster of cholera cases surrounding a single water pump that was determined to be the cholera source. A modern example is HealthMap, a website developed at Boston Children's Hospital, which displays various disease outbreaks across the globe (5). For example, a user can view the number of Escherichia coli (E. coli) cases that occurred in a given state over a specified time frame. This information can be utilized by a large audience, ranging from health departments to international travelers, who may be impacted by an emerging infectious disease. Similarly, mapping drug overdose deaths could help elucidate increased use of specific drugs, such as heroin, as well as susceptible populations. This becomes especially useful for rural locations that do not have the resources to conduct complicated surveillance. If these underserved locations have a simple means of drug surveillance, targeted interventions could be considered and implemented. Furthermore, once a target audience has been identified, the intervention's progress could be monitored and refined since the data is readily available.
Software for mapping data has existed for several decades; however, it has been costly and/or required expertise to produce meaningful results. Google Fusion Tables, a freely available web application designed to share and visualize data tables and map locations on Google Maps, overcomes these limitations (6). Fusion Tables provides users with the ability to customize the presentation of data through the use of filters, so that characteristics of a population can be isolated for visualization (e.g., age range, sex, race). This freely available and user-friendly software permits any CMEO to easily conduct surveillance on specific causes of death. Furthermore, Fusion Tables was designed to share information thereby permitting multiple CMEOs across different jurisdictions to conduct widespread surveillance and compare patterns.
Herein, we illustrate the use Google's Fusion Tables software and Google Maps using data on drug-related deaths as well as demonstrate the flexibility of Fusion Tables to customize data presentation and visualization and consider potential large-scale uses of Fusion Tables.
Methods
Data was queried from the Jefferson County Coroner/Medical Examiner's Office (JCCMEO) for deaths related to cocaine and heroin use occurring from 2012-2014. Queried data included demographic information such as age, race, and sex, as well as place of death and home address of decedent. These data were exported from a FileMaker database into Microsoft Excel and the columns were formatted to include the following: case number, date of death, age, race, and gender of decedent, address, designation of address (home versus scene location), icons for addresses (hospital, home, scene, etc.), icons for demographics, and a combined race-sex column for summary purposes. In order for the decedent's place of death and home address to be viewed on the same map, each decedent had two separate rows of data: one for place of death and one for place of residence (see Figure 1). Unique icons, such as red or blue beacons, were assigned to each to address type (i.e., home or scene) and demographic feature of the decedent. Scripts inside Visual Basic for Applications can automate this process; however, Excel filters applied to addresses, race, and sex can also facilitate the process of assigning icons to each case. Finally, the Excel sheet was saved as a “Comma Separated Variable” (CSV) file.
Figure 1.
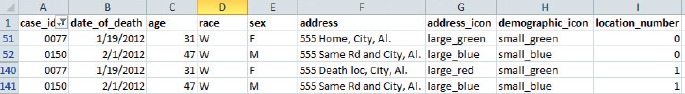
Above is a screenshot of our Excel spreadsheet with two rows for each decedent: one for place of death and one for home address. Under the address_icon column home and scene addresses are denoted by “large_green” and “large_red” icons, respectively. The “large_blue” icon indicates home and scene addresses are the same for the decedent. Addresses and case numbers have been modified for anonymity.
Next, the author created a new “Fusion Table” file from his Google Drive. Fusion Tables presented the option to import a CSV, “Tab Separated Variable” (TSV), or text file (“Choose File” button) or manually enter data. After following the prompts to import the CSV file, one of the authors (MDC) modified the column types by clicking on the down arrow adjacent to the column name (see Figure 2). Addresses were converted from text to “location” type data so that the column could be “geocoded” on to a Google Map. By clicking the “+” sign at the top row of tabs, a map, chart and summary of the spreadsheet was added. After adding the aforementioned features, the authors utilized various filters to isolate specific groups, such as 18 – 30 year old white males, and explore potential patterns.
Figure 2.
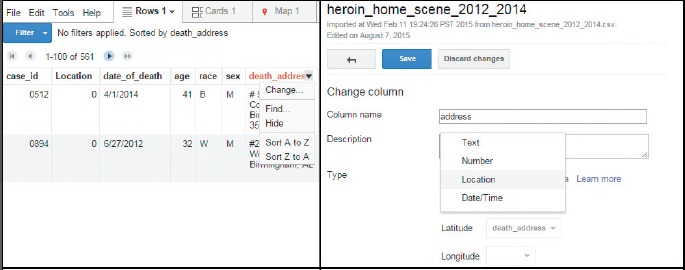
The screenshot shows the dropdown menu for each column (on left). Choosing “Change” from the menu generates a new list of options for the given column (on right). In this example, location was chosen so that Fusion Tables could geocode the addresses. Case numbers have been modified for anonymity.
Results
Our dataset was successfully imported into the Google Fusion Tables software and geocoded onto a Google Map. On average, each address was plotted in 0.9 seconds and the percent of ambiguous addresses was less than 5% for both heroin and cocaine-related deaths. Ambiguous addresses, those locations that Fusion Tables struggled to plot on the map, were highlighted for revision; however, several home addresses were left empty because of transient decedents.
Maps using address icons, such as place of death, home, hospitals, and jails, are shown in Figures 3, 4 and 5. Figures 3 and 5 display maps of cocaine and heroin-related deaths, respectively. Figure 4 demonstrates a low power satellite image of Birmingham with home and scene addresses for cocaine-related deaths. In the interest of anonymity, a high power image is omitted; however, users can easily access close-up satellite images of each location. Figure 6 shows a screenshot of a map of heroin overdoses using demographic icons with available filters. A user can select boxes representing specific demographics, such as black females, as well as enter specific age and time ranges to view isolated groups on a map or chart. Our group employed many combinations of these filters to each of the above maps, such as specific age and date ranges, race, and sex. Applying these filters helped illustrate the relative high incidence of heroin overdose in white males and females. Filtering on the address location (home versus scene) and demographics showed that a greater proportion of African-Americans overdosed on heroin in their home than Caucasians. However, we did not observe any obvious geographic clusters of heroin or cocaine-related deaths in Jefferson County.
Figure 3.
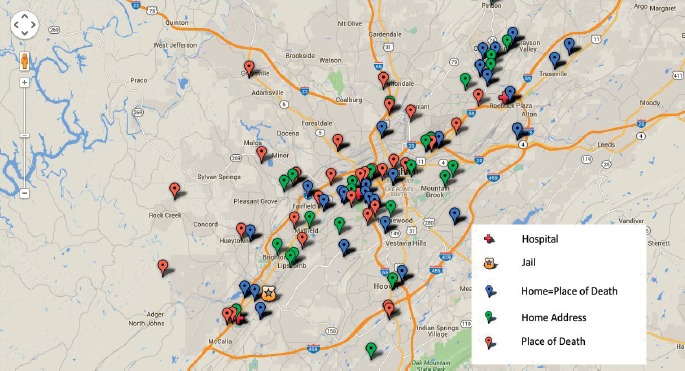
2012-2014 cocaine-related deaths plotted with specific icons.
Figure 4.
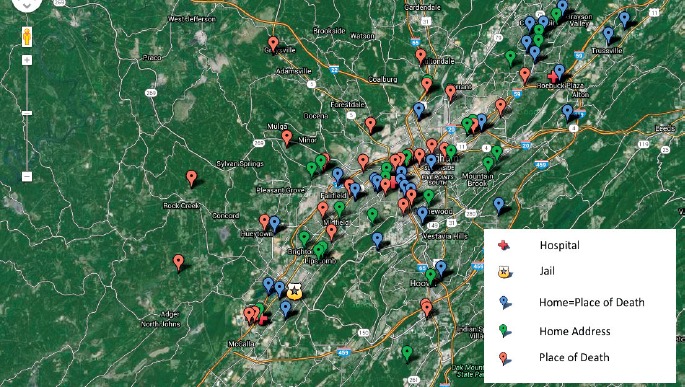
Low magnification of 2012-2014 cocaine-related deaths on satellite imaging. On the actual map, sliding the scroll bar in the top left corner adjusts the level of magnification. Actual satellite images of each location are possible.
Figure 5.

2012-2014 heroin overdoses plotted with specific icons.
Figure 6.
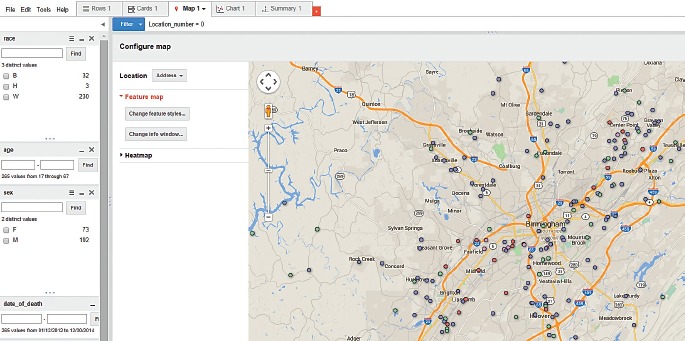
A screenshot of the Fusion Table software depicting a map of heroin overdoses by race and gender. The panel on the left side shows available filters; users can click on the check boxes to select specific groups or an age range can be entered in the appropriate text fields.
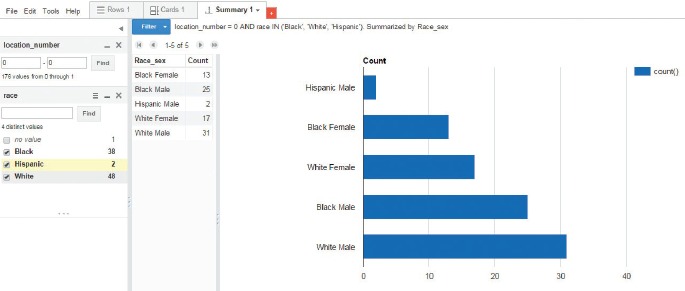
While the above maps help visualize the data, charts and summaries provide basic statistics to further illustrate drug death findings. Figure 7 is a pie chart from Fusion Tables that demonstrates the proportion of race and sex dying from heroin use. Figures 8 and 9 provide actual case counts in tabular and bar chart format for cocaine and heroin-related deaths, respectively. Multiple variables can be included if the user converts the data to a categorical chart, as shown in Figure 10. This chart provides easy visualization of age in relation to race and sex for heroin overdoses. According to the bar charts, the average age of death from heroin was in the mid 30's to early 40's. Black females had the youngest average age of death from heroin whereas black males had the oldest average age.
Figure 7.

The screenshot shows a pie chart that summarizes the findings from the heroin-related deaths. Filters and other charts are available, as shown above.
Figure 8.
The figure portrays a summary of cocaine-related deaths from 2012-2014.
Figure 9.

The figure above summarizes the heroin-related deaths from 2012-2014. As can be seen in the table and bar chart, the majority of heroin-related deaths occurred in white males and females.
Figure 10.

The above categorical chart displays age data based on race and gender.
Filters can be applied to each of the visualization tools utilized above. Applying a filter to date of death, we found that the number of heroin-related deaths nearly doubled in 2014 from the previous two years (Figure 11). As can be seen from this figure, while the number of heroin-related deaths dramatically increased in 2014, the highest frequencies remained in white males and females.
Figure 11.

The screenshot above is a merged image of filters on date of death to demonstrate the dramatic increase in heroin-related deaths in 2014. The filter information was moved beneath the table to facilitate ease of viewing.
Discussion
Mapping data related to drug use can be a useful tool in the discovery and analysis of different attributes of drug use. Our group can easily export data from the JCCMEO database into Fusion Tables. To facilitate this process, we developed scripts in Visual Basic for Applications (a programming language that operates with Microsoft Excel) to automate the process of organizing the data into a manageable format. This formatting includes unique icons to denote specific demographics, home residence, and place of death. Combining our database with these scripts provides real-time data analysis in Fusion Tables. Once data has been transferred to Fusion Tables the following features are readily available:
-
1.
Data filters and sorting options are available. For example, a user could target 18-25 year old white males from the data set and sort by date of death or age.
-
2.
If addresses are included in the database, these locations can be plotted onto a Google Map. Multiple maps can be added to the project and these maps can be manipulated in numerous ways. The previously mentioned data filters can be applied to these maps and any number of icons can be used to represent data points. Furthermore, the filter panel allows users to view how many points are present for a given icon.
-
3.
Fusion Tables can be shared in the same manner as any other document in an online share drive. A user can provide specific privileges to collaborators, such as view and edit. Furthermore, multiple users can link together datasets to create one large database.
-
4.
Google provides access to the Application Program Interface (API) (7). An individual can customize Fusion Table visualizations as well as query data from the table to embed into other applications, such as a webpage or statistical software. These new features could then be shared with the medical examiner community.
Fusion Tables could impact the forensic community significantly because it is a powerful, versatile program that is freely available to anyone. The aforementioned features enable coroners to track drug overdoses, or any other cause of death, and perform analyses that can be relayed to interested parties, such as interventionists and inquiring media. If one office develops customized and specialized mapping tools, these tools can be shared with other offices for effective data investigation. Additionally, Fusion Tables confers the potential to merge datasets into massive databases across the country. Medical examiner offices can maintain private datasets or choose to share their data, with privileges of “view only” or “editing.” As offices begin sharing data sets, it may be possible to conduct large-scale analyses into drug use across specific demographics, locations, and time-interval patterns. Furthermore, if a group chooses to publish the results of a shared table, several graphing options exist that are designed for webpage compatibility.
For the present study, we focused on cocaine and heroin deaths as a way to demonstrate some of the functionality of Fusions Tables as it related to data from a CMEO; however, Fusion Tables could also be used to investigate prescription drug use or other illicit drugs. Google Fusion Tables can be used for other applications as well. For example, California and New York use Fusion Tables to display public data, such as unemployment rates and stalled construction zones (8, 9).
Other mapping software exists and should be considered. CartoDB is an open source mapping application that can actually plot larger datasets than Fusion Tables (10). The software also allows multiple layers of data to be plotted depending on the membership type – Fusion Tables offers five layers and CartoDB provides four at the base rate. These layers help organize information so that one layer may show icons and another layer displays the address. This software has an attractive free version with similar functionality as Fusion Tables as well as other options that require a monthly fee. Furthermore, if an office chooses to use CartoDB over Fusion Tables, similar functions exist to query the database (PostgreSQL/PostGIS). We chose to use Fusion Tables because we found it easier to use – not that CartoDB is overly complicated. Our staff, who will continue to utilize the Fusion Tables software, had minimal difficulties importing data, implementing filters, or including the maps in reports. At a later date, if the number of data elements increases drastically, then a transition to CartoDB may be necessary. However, for our office's current needs Fusions Tables was very easy to use and a flexible solution to mapping a wide array of events and disseminating that information to others.
Aside from Fusion Tables and CartoDB, several other mapping products exist; however, most of these are not free. Examples include Maptitude, eSpatial, and QGIS cloud. The authors have included a small sampling of the available geocoding software; searching for “geocoding software” or “mapping software” on the internet yields results for many applications, some of which may provide a better mapping solution for other offices.
Our future goals include the expansion of Fusion Tables to other avenues, such as motor vehicle accidents and shootings. Also, we would welcome collaborative efforts with other CMEOs for large-scale drug use investigations. Our group is actively working with the School of Public Health to integrate advanced statistics into our work. Once these statistical functions are developed and linked to the Fusion Tables data, these analyses can be automated. If other offices are interested in using a similar system, it should be a relatively simple process to share the programming scripts as well as integrate their datasets. Developing a collaborative, standardized system will improve investigative efforts, facilitate effective interventions, and incorporate underserved regions that cannot afford expensive research software.
Recently, our office incorporated Fusion Tables into the annual drug report that is supplied to local law enforcement and public health officials. Specifically, the Chief Deputy Coroner of our office is embedding these visualizations into his summaries with filtered data for overdoses relating to heroin and prescription drug use. Furthermore, after a large county meeting, we have established a set of shared folders with the Health Officer of Jefferson County so that he now has access to parts of the JCCMEO's drug data. This arrangement will hopefully facilitate collaborative efforts between the JCCMEO and public health officials who are seeking to develop interventions to curb drug use. Examples of these interventions include naloxone distribution, drug abuse prevention education as well as treatment resources, and disease control (i.e., Hepatitis C and HIV). From our discussions with public health, heroin and prescription drug abuse are prime targets for interventions; thus, acquiring demographic information, home address, and place of death will support their endeavors. While communications between the JCCMEO and county public health have been greatly enhanced, this form of collaborative work is still new, and the long-term impact may not be realized for months to years.
Acknowledgment
The authors would like to thank Jefferson County Chief Deputy Coroner Bill Yates who helped with data acquisition, provided very useful insights into potential applications of geocoded data, and supplied information regarding drug interventions.
Footnotes
Ethical Approval: As per Journal Policies, ethical approval was not required for this manuscript
Statement of Human and Animal Rights: This article does not contain any studies conducted with animals or on living human subjects
Statement of Informed Consent: No identifiable personal data were presented in this manuscript
Disclosures & Declaration of Conflicts of Interest: The authors, reviewers, editors, and publication staff do not report any relevant conflicts of interest
Financial Disclosure: The authors have indicated that they do not have financial relationships to disclose that are relevant to this manuscript
References
- 1).Results from the 2013 national survey on drug use and health: summary of national findings [Internet]. Rockville (MD): U.S. Department of Health and Human Services Substance Abuse and Mental Health Services Administration Center for Behavioral Health Statistics and Quality; 2014. Sep [cited 2015 Sep 12]. Available from: http://www.samhsa.gov/data/sites/default/files/NSDUHresultsPDFWHTML2013/Web/NSDUHresults2013.pdf. [Google Scholar]
- 2).Wide-ranging OnLine Data for Epidemiologic Research (WONDER) [Internet]. Atlanta: Centers for Disease Control and Prevention; 2013. [cited 2015 Dec 31]. Available from: http://wonder.cdc.gov/. [Google Scholar]
- 3).Gruszecki A.C., Booth J., Davis G.G. The predictive value of history and scene investigation for toxicology results in a medical examiner population. Am J Forensic Med Pathol. 2007. Jun; 28(2): 103–6. PMID: 17525557. 10.1097/paf.0b013e318061956d. [DOI] [PubMed] [Google Scholar]
- 4).UCLA Department of Epidemiology [Internet]. Los Angeles: University of California, Los Angeles; c2016. Broad Streetpump outbreak; [cited 2016 Feb 22]. Available from: http://www.ph.ucla.edu/epi/snow/broadstreetpump.html. [Google Scholar]
- 5).HealthMap – global health, local information [Internet]. Boston: Boston Children's Hospital; 2015 [cited 2015 Dec 4]. Available from: http://www.healthmap.org/en/. [Google Scholar]
- 6).Fusion Tables help [Internet]. Mountain View (CA): Google Inc.; 2015. [cited 2015 Sep 12]. Available from: https://support.google.com/fusiontables/. [Google Scholar]
- 7).Google Developers, Fusion Tables REST API [Internet]. Mountain View (CA): Google Inc.; 2015. [cited 2015 Sep 12]. Available from: https://developers.google.com/fusiontables/?hl=en. [Google Scholar]
- 8).State of California [Internet]. Sacramento: State of California; c2015. Category archives: fusion tables; 2012 [cited 2015. Sep 12]. Available from: http://data.ca.gov/category/by-data-format/fusion-tables/. [Google Scholar]
- 9).Google Drive [Internet]. Mountain View (CA): Google Inc.; c2015. Fusion tables example gallery; 2015. [cited 2015 Sep 12]. Available from: https://sites.google.com/site/fusiontablestalks/stories. [Google Scholar]
- 10).CartoDB [Internet]. Brooklyn: CartoDB, Inc; 2016. [cited 2016 Feb 22]. Available from: https://cartodb.com/. [Google Scholar]