

Abstract
Background
Little is known about plasma apolipoprotein profiles in very preterm‐born and term‐born preschool children compared with the adult population. This is of particular interest because apolipoprotein composition might contribute to cardiometabolic outcome in later life.
Methods and Results
Children aged 5 to 7 years born at term or with <32 weeks of gestation were included. Apolipoprotein concentrations were measured in plasma collected after an overnight fast using multiple‐reaction monitoring‐based mass spectrometry. Twelve apolipoproteins were measured in 26 former term and 38 former very preterm infants. Key findings were confirmed by assessing apolipoprotein levels using antibody‐based assays. Comparing children born term and preterm, apolipoprotein A‐I, A‐IV, C‐II, and C‐III were significantly higher in the latter group. Term‐born children showed plasma levels of apolipoprotein C‐II and C‐III quantitatively similar to the adult range (Bruneck study). Hierarchical clustering analyses suggested that a higher proportion of apolipoprotein C‐III and C‐II reside on high‐density lipoprotein particles in children than in adults given the marked correlations of apolipoprotein C‐III and C‐II with high‐density lipoprotein cholesterol and apolipoprotein A‐I in children but not adults. High‐density lipoprotein cholesterol concentrations were similar in children and adults but the pattern of high‐density lipoprotein cholesterol–associated apolipoproteins was different (lower apolipoprotein A‐I and C‐I but higher A‐II, A‐IV, and M).
Conclusions
Our study defines apolipoprotein profiles in preschoolers and reports potential effects of prematurity. Further large‐scale studies are required to provide evidence whether this apolipoprotein signature of prematurity, including high apolipoprotein C‐II and C‐III levels, might translate into adverse cardiometabolic outcome in later life.
Keywords: apolipoprotein, cardiovascular disease, pediatrics, prematurity
Subject Categories: Lipids and Cholesterol, Pediatrics, Atherosclerosis
Clinical Perspective
What Is New?
Term‐born children at preschool age had plasma levels of apolipoprotein C‐III and C‐II and high‐density lipoprotein cholesterol concentrations quantitatively similar to the adult range; however, the pattern of high‐density lipoprotein–associated apolipoproteins was substantially different (much lower apolipoprotein A‐I and C‐I but higher A‐II, A‐IV, and M) and interrelationships between apolipoproteins suggest apolipoprotein C‐III and C‐II mainly reside on high‐density lipoprotein particles.
What Are the Clinical Implications?
Comparing children born term and preterm, apolipoprotein A‐I, A‐IV, C‐II, and C‐III were significantly higher in the latter group and high levels of apolipoprotein C‐II and apolipoprotein C‐III may represent a pro‐atherogenic risk factor among preterm‐born children already in early life.
Introduction
Preterm birth is a problem of great global importance, and in many countries worldwide prematurity rates are on the rise.1, 2 Because of advances in perinatal care, case fatality in very preterm infants has markedly decreased over the last decade.3, 4 As a growing number of very preterm‐born children reach adulthood, new health challenges arise.5 Former preterm infants are known to develop adverse cardiometabolic traits in adulthood.6, 7, 8, 9, 10 We have recently shown that these children exhibit unfavorable vascular risk profiles already at preschool age11, 12, 13 including alterations in total and low‐density lipoprotein cholesterol (LDL‐C).13 It is unknown, however, whether the apolipoprotein composition—conferring lipoprotein functionality and atherogenicity—is also altered.
The functional roles of apolipoproteins include transport and redistribution of lipids among tissues, maintenance of lipoprotein structure as well as regulation of lipid metabolism.14, 15 In the last decades, apolipoprotein imbalances have been implicated in health and disease including atherogenic processes.16, 17, 18, 19, 20, 21 For instance, a large long‐term community‐based study, the Bogalusa Heart Study, showed that children aged 5 to 17 years with low apolipoprotein A‐I concentrations and high ratios of apolipoprotein B to apolipoprotein A‐I appear to be at increased risk of later‐life coronary artery disease.22 Apolipoprotein levels are related to the composition of diet and are controlled by hormonal pathways, which might be affected by preterm birth.23 In the neonatal period, apolipoprotein concentrations are known to rely on gestational age.23, 24 Whether distinct apolipoprotein patterns persist into early childhood is unknown to date. The aim of the present study was to determine plasma concentrations of 12 apolipoproteins in very preterm and term‐born individuals at 5 to 7 years of age and to evaluate apolipoprotein differences between these children and adults.
Methods
Study Design
The data that support the findings of this study are available from the corresponding author upon reasonable request. The current investigation is part of the cross‐sectional study “Very preterm infants and early markers for an increased risk of cardiovascular disease,” which examined former very preterm‐born children and term‐born controls at 5 to 7 years of age at Innsbruck University Hospital, Austria, from May 2012 to March 2015. The detailed study protocol has been published elsewhere.11, 12, 13 All participants undergoing fasting blood sampling at study visit were considered eligible for apolipoprotein measurements. Ethical approval was obtained in advance from the institutional review board of the Medical University of Innsbruck. Written informed consent was obtained from all legal guardians and verbal assent from all study participants before inclusion in the study. The corresponding author had full access to all the data in the study and takes responsibility for its integrity and the data analysis.
The Bruneck Study is a prospective, population‐based survey of the epidemiology and pathogenesis of atherosclerosis and cardiovascular disease (CVD).16 An age‐ and sex‐stratified random sample of all inhabitants of Bruneck, Italy, all of white descent, was enrolled in 1990. In 2000, 702 subjects were still alive, and participated in the second quinquennial follow‐up. Measurements taken in 2000 served as the baseline for the present study (n=688). The study protocol was approved by the ethics committees of Bolzano and Verona, and conformed to the Declaration of Helsinki. All study subjects gave written informed consent.
Perinatal Characteristics
Basic perinatal data for each subject were either drawn from the routine follow‐up database of children born very preterm at our institution or the “Mutter‐Kind‐Pass” records, the official Austrian pregnancy and early childhood medical record book. Remaining data were inquired at the study visit. Birth weight z‐scores were calculated for every participant by means of the Fenton 2013 growth charts.25 Maternal educational status was classified as <12 years or 12 years and more. Infant feeding was categorized as “mainly breastfed,” if the content of mothers’ milk exceeded 50% in the first month of life.
Study Visit
At study visit, weight was measured by means of calibrated medical precision scales with the participants wearing indoor clothes without shoes. Height was determined by a Harpenden stadiometer. Body mass index (BMI) was calculated as weight in kilograms divided by height in meters squared. BMI z‐scores were calculated for each study participant by means of a reference data set.26 Waist circumference was measured in duplicate with participants standing feet slightly apart at the level midway between the lower rib border and the iliac crest; hip circumference was measured in duplicate at the widest level over the major trochanter to the nearest millimeter with a flexible, nonelastic measurement tape as described previously.27 Waist‐to‐hip ratio was calculated as mean waist circumference divided by mean hip circumference. Skinfold thickness was measured in triplicate by means of a medical caliper on the nondominant side of the body with observer and subject standing and the arm hanging freely as described previously.28 Tricipital skinfold thickness was measured halfway between the acromion and the olecranon, parallel to the longitudinal axis of the arm. Subscapular skinfold thickness was measured ≈20 mm below the tip of the scapula, at an angle of 45° to the lateral side of the body.28, 29 Every measurement was recorded to the nearest 0.1 mm, and means of all 3 measurements were calculated. Body fat content was estimated by age‐ and sex‐specific formulas according to Slaughter et al.30 Childhood nutrition habits were assessed by means of an established standardized food frequency questionnaire (“What do you eat?”, kindly provided by the Robert Koch Institute, Berlin, Germany).31 A “food pattern index” was calculated by means of a scoring system based on the consumption frequency of 7 “indicator foods” that are generally regarded as healthy (fruit, vegetables, wholegrain bread) or unhealthy (soft drinks, fast food, chocolates, salty snack foods such as potato chips). Food patterns were subsequently classified as unfavorable (0–4 points), neutral (5–11 points), or favorable (11–15 points).32
Fasting Blood Analyses
Fasting blood samples were obtained between 8 am and 10 am after an overnight fasting period. Total cholesterol, low‐density lipoprotein cholesterol (LDL‐C), high‐density lipoprotein cholesterol (HDL‐C), and triglyceride levels were directly analyzed by enzymatic measurement (Roche Diagnostics, IN; Cobas 8000) at the Central Institute for Medical and Chemical Laboratory Diagnosis (Innsbruck University Hospital). HDL‐C was separated using PEG‐modified enzymes and dextran sulfate. For apolipoprotein analyses, plasma samples were centrifuged at 3000g for 10 minutes at 4°C. Supernatants were collected, stored at −80°C until further processing, and transported on dry ice. Bruneck Study plasma samples were handled in the same way and stored at −80°C until analysis. Apolipoprotein measurements were carried out at the King's College London applying a mass‐spectrometry‐based method with commercial authentic reference standards (PlasmaDive kits; Biognosys AG, Schlieren, Switzerland). The peptide standard for apolipoprotein B‐100 did not overlap with the proximal portion of apolipoprotein B that would include both apolipoprotein B‐48 and apolipoprotein B‐100. Plasma samples were processed according to the manufacturer's instructions. Briefly, 10‐μL plasma samples were denatured, reduced, and alkylated. Proteins (20 μg) were spiked with authentic stable isotope‐labeled peptide standards for apolipoproteins and retention time peptide standards for the calibration of the liquid chromatography (LC). An in‐solution tryptic digestion (Pierce™ Trypsin Protease, MS Grade, enzyme: protein=1:50) was performed overnight at 37°C with shaking. Digestion was stopped by adding 10 μL of 10% trifluoroacetic acid. After solid‐phase extraction with C18 cartridges (Agilent Bravo Assay MAP), the eluted peptides were dried using a SpeedVac (ThermoFisher Scientific, Woburn, MA) and resuspended in 40 μL of LC solution. The samples were analyzed on an Agilent 1290 Infinity II LC system (Agilent Technologies, Santa Clara, CA) interfaced to an Agilent 6495 Triple Quadrupole mass spectrometer (MS, Agilent Technologies). Samples (10 μL) were directly injected onto a 25‐cm column (AdvanceBio Peptide Mapping C18, 2.1×250 mm, 2.7 μm, 120 Å, Agilent Technologies) at 50°C and separated over a 23‐minute gradient at 350 μL/min (0–0.5 minutes, 5%–7.5% B; 0.5–18 minutes, 7.5%–30% B; 18–20 minutes, 30%–80% B; 20–23 minutes, 80% B; 23–27 minutes, 5% B; A=0.1% formic acid in H2O; B=0.1% formic acid in acetonitrile). The LC system and the MS instrument were controlled by MassHunter Workstation software (version B.08.00). Both Q1 and Q3 were set at Unit resolution (0.7 Th) and the following parameters were used: Delta EMV 350, Frag 380 V, Cell Acc 4 V, Gas Temp 200°C, Gas Flow 11 L/min, Nebulizer 35 psi, Sheath Gas Heater 250°C, Sheath Gas Flow 12 L/min, Capillary 4 kV, VCharging 300, Ion Funnel Pos High Pressure RF 180 V and Pos Low Pressure RF 90 V. Seven hundred sixty‐three transitions were scheduled using dynamic multiple reaction monitoring with a cycle time of 0.75 s and a retention time window of 0.8 minutes. Data were analyzed using Skyline software version 3.1 (MacCoss Lab, University of Washington, Seattle, WA) and protein concentrations were calculated using the heavy/light (H/L) ratio of the authentic stable isotope‐labeled standard peptide standards compared with the endogenous peptides for apolipoproteins.
Apolipoprotein Measurements by Immunoassay and ELISA
Apolipoproteins were measured using Milliplex Map Human Apolipoprotein Magnetic Bead Panel Kit, 96‐well plate assay (Cat No. APOMAG‐62K, Merck Millipore, Darmstadt, Germany) following the manufacturer's instructions. In brief, plasma samples were diluted 1:4000 in assay buffer and 10 μL of diluted plasma was used per well. One hundred fifty microliters of each antibody‐immobilized bead for apolipoprotein CII, apolipoprotein CIII, and apolipoprotein E were mixed and topped up to 3 mL with Bead diluent. QC1, QC2, and the apolipoprotein calibrator cocktail were reconstituted with 250 μL deionized water and mixed thoroughly. The calibrator was further diluted to 1:5, 1:25, 1:125, 1:625, 1:3125, and 1:15 625, in assay buffer. After washing and drying the plate, 65 μL of assay buffer, 10 μL of assay buffer/serial dilution of calibrators/QC1/QC2/diluted samples, and 25 μL of the premixed beads were added to each well before the plate was sealed, wrapped in foil, and incubated at 700 rpm for 1 hour at room temperature. A handheld magnetic plate was used to gently remove well contents, and the plate was washed 3 times using the washing buffer. Subsequently, 50 μL of detection antibodies mixture was added to each well, and the plate was incubated at 700 rpm for 30 minutes at room temperature. The wash step was repeated before adding 50 μL of streptavidin‐phycoerythrin per well for a final incubation of 30 minutes. After a third wash step, the plate was prepared for analysis on FlexMap 3D by resuspending the beads in 100 μL of sheath fluid on a plate shaker for 5 minutes. The median fluorescent intensity data were analyzed to calculate apolipoprotein concentrations in the samples. A dilution factor of 4000 was applied to the concentrations to correct for the sample dilution.
Moreover, apolipoprotein A‐1 (DY3664, R&D Systems) levels were measured in a subset of 18 term‐born children, for which residual samples were available and 27 participants of the Bruneck Study using DuoSet ELISA Development kits and DuoSet Ancillary Reagent Kits 2 (R&D Systems) according to the manufacturer's instructions. Absorbance at 450 nm was measured on a plate reader (Tecan Infinite 200 Pro) using 570 nm as a reference wavelength. Results were calculated using a 4‐parameter logistic fit.
Statistical Analysis
Statistical analyses were carried out with SPSS for Windows, version 24 (SPSS Inc, Armonk, NY) and R version 3.4.4 (R Foundation for Statistical Computing, Vienna, Austria). Comparisons with term (SIDS database Tyrol, birth years 2007–2009) and preterm (Innsbruck routine follow‐up database of very‐preterm‐born children, birth years 2007–2009) reference populations (population characteristics) as well as between the term‐ and very preterm‐born study group (perinatal characteristics and characteristics at study visit) were carried out with Fisher exact test or Mann–Whitney U test, depending on the type of variable analyzed. Correlation analyses were carried out using the Spearman's rank correlation coefficient. Lipid variables were clustered using agglomerative hierarchical clustering on the basis of complete linkage, defining the distance between 2 variables as 1 minus their correlation. Differences in apolipoprotein concentrations between the term‐born and preterm groups and between term‐born and adult groups were assessed by Mann–Whitney U test. For these analyses, the Benjamini‐Hochberg procedure was used to correct for multiple testing with an accepted false discovery rate of <0.05. For results significant in the term‐born versus preterm analysis, linear regression on log‐transformed concentrations was performed to investigate group differences under multivariable adjustment. Fold change was obtained by back‐transforming coefficients. Multivariable adjustment was for age at examination, sex, birth weight z‐score, current BMI z‐score, type of infant feeding, and childhood nutrition profile. Accordance between apolipoprotein measurements obtained by liquid chromatography mass spectrometry and antibody‐based Luminex assay is shown in Figure 1. The lines are linear regression lines drawn by the Chart Editor of the SPSS Scatterplot tool.
Figure 1.
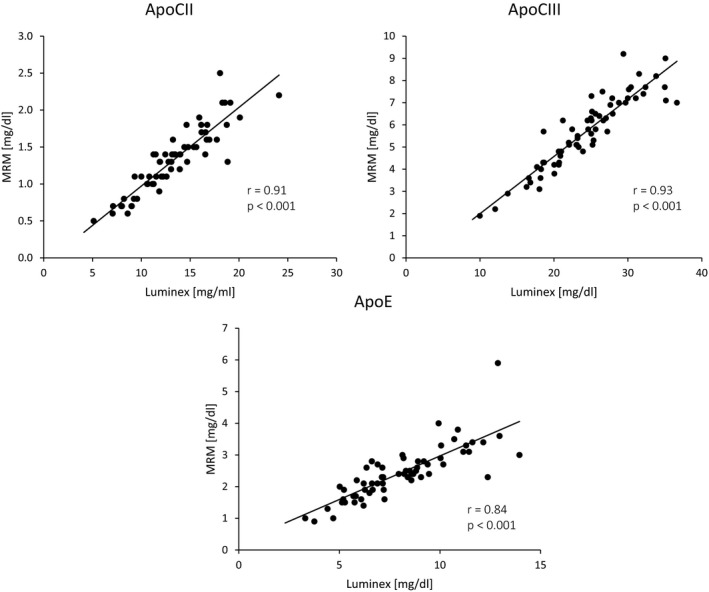
Correlation between apolipoprotein measurements obtained by liquid chromatography mass spectrometry and antibody‐based Luminex assay. Apolipoprotein (Apo) concentrations were measured using a custom magnetic antibody bead panel and were compared against concentrations measured by MRM‐based mass spectrometry). Measurements were highly correlated (Spearman correlation coefficients r); however, absolute concentrations were different. MRM, multiple‐reaction monitoring.
Results
The study population comprised 34 children born at term and 84 born very preterm.12 Plasma samples for apolipoprotein measurements were available in 26 former term and 38 former very preterm infants. Both groups did not differ in relevant characteristics from the respective groups in the overall study population. Gestational age in the very preterm study group was similar to that of all very preterm‐born children in the same survey area and period (n=186) as were sex distribution, birth weight, and maternal educational status. The control group of term‐born infants did not significantly differ from the general Tyrolean birth cohort of the same survey period (n=2548) regarding these characteristics.
Comparison of Very Preterm‐Born and Term‐Born Children
Details on perinatal characteristics and characteristics at study visit are depicted in Table 1. The very preterm‐born children had significantly lower BMI z‐scores but higher total cholesterol, LDL‐C, and HDL‐C levels compared with term‐born children. The frequency of small for gestational age, distribution of maternal educational status, and type of infant feeding, waist–hip ratio, skinfold thickness, and estimated body fat percentage did not differ between both groups. Regarding apolipoproteins, very preterm‐born children had higher apolipoprotein A‐I, A‐IV, C‐II, and C‐III concentrations than term‐born children, which maintained significance under multivariable adjustment. Details are provided in Tables 2 and 3. Given the importance of apolipoprotein C‐II and apolipoprotein C‐III in the clearance of triglyceride‐rich lipoproteins, the apolipoprotein measurements by multiple‐reaction monitoring‐based mass spectrometry were validated using a custom magnetic antibody bead panel. Apolipoprotein‐E was used as a control. Measurements of apolipoprotein C‐II, C‐III, and E obtained with the 2 assays were highly correlated even though absolute values were different (Figure 1, n=64). When using the antibody‐based measurements, the key differences for apolipoprotein CII and CIII between very preterm‐born and term‐born children could be replicated while, as expected, no change was observed for apolipoprotein E: median (interquartile range) of term group versus very preterm group apolipoprotein C‐II 11.2 mg/dL (9.0; 12.4) versus 14.0 mg/dL (12.7; 16.6), P<0.001; apolipoprotein C‐III 21.6 mg/dL (18.2; 25.1) versus 26.1 mg/dL (23.2; 30.2), P=0.001; apolipoprotein E 7.7 mg/dL (6.2; 9.0) versus 7.6 mg/dL (6.2; 10.3), P=0.81.
Table 1.
Perinatal Characteristics and Characteristics at Study Visit in Former Term and Very Preterm Infants
| Characteristic | Term Group (n=26) | Very Preterm Group (n=38) |
|---|---|---|
| Sex, male/female, N (%) | 14 (54)/12 (46) | 20 (53)/18 (47) |
| Perinatal characteristics | ||
| Gestational age, median (IQR) (wks) | 40 (39; 41) | 30 (27; 31)‡ |
| Birth weight, median (IQR) (g) | 3320 (3070; 3600) | 1115 (970; 1570)‡ |
| Birth weight z‐score, median (IQR) | −0.32 (−0.86; 0.17) | 0.06 (−0.36; 0.74)* |
| Small for gestational age at birth, N (%) | 2 (8) | 2 (5) |
| Maternal educational status, unknown/<12 y/≥12 y, N (%) | 5 (19)/12 (46)/9 (35) | 0 (0)/25 (66)/13 (34) |
| Mainly breastfed, unknown/yes/no (%) | 3.8/76.9/19.2 | 0.0/65.8/34.2 |
| Characteristics at study visit | ||
| Age at examination, median (IQR) (y) | 5.6 (5.3; 6.0) | 5.4 (5.3; 5.5) |
| Current BMI, median (IQR) (kg/m²) | 14.6 (14.0; 15.6) | 14.2 (13.6; 14.9) |
| Current BMI z‐score, median (IQR) | −0.49 (−1.04; 0.28) | −0.89 (−1.37; −0.39)* |
| Current WHR, median (IQR) | 0.88 (0.84; 0.90) | 0.90 (0.86; 0.92) |
| SFT tricipital, median (IQR) (mm) | 7 (6; 9) | 7 (6; 8) |
| SFT subscapular, median (IQR) (mm) | 5 (5; 6) | 5 (4; 5) |
| Estimated body fat, median (IQR) (%) | 13.7 (11.0; 17.6) | 12.8 (10.8; 14.7) |
| Childhood nutrition profile, unknown/neutral/favorable (%) | 3 (11)/7 (27)/16 (62) | 4 (10)/19 (50)/15 (40) |
| Total cholesterol, median (IQR) (mg/dL) | 149.5 (130.0; 160.5) | 168.5 (148.3; 188.3)* |
| LDL‐C, median (IQR) (mg/dL) | 87.5 (76.8; 103.8) | 102.0 (86.8; 120.3)* |
| HDL‐C, median (IQR) (mg/dL) | 49.0 (41.0; 58.3) | 62.0 (52.0; 67.5)† |
| VLDL‐C, median (IQR) (mg/dL)§ | 6.0 (4.0; 9.0) | 2.5 (0.0; 6.3) |
| Triglycerides, median (IQR) (mg/dL) | 51.5 (41.0; 72.8) | 53.5 (42.8; 67.0) |
BMI indicates body mass index (calculated as weight in kilograms divided by height in meters squared); HDL‐C, high‐density lipoprotein cholesterol; IQR, interquartile range; LDL‐C, low‐density lipoprotein cholesterol; SFT, skinfold thickness; VLDL‐C, very‐low density lipoprotein cholesterol; WHR, waist‐to‐hip ratio.
*P<0.05, † P<0.01, ‡ P<0.001, term vs very preterm group.
VLDL‐C was estimated by subtracting directly measured HDL‐C and LDL‐C from total cholesterol (the alternative Friedewald approach of dividing triglycerides by 5 has not been validated in children).
Table 2.
Comparison of Apolipoprotein Concentrations in Healthy Term‐Born Preschool Children (Age 5–7 Years) and Very Preterm‐Born Preschool Children (Age 5–7 Years)
| Apolipoprotein | Term Group (n=26) | Very Preterm Group (n=38) | P Value | FDR q‐Value |
|---|---|---|---|---|
| ApoA‐I | 119.8 (108.9; 136.2) | 153.0 (131.9; 164.6) | 6.56×10−05 | 0.00092 |
| ApoA‐II | 7.2 (5.5; 7.7) | 6.6 (5.5; 7.8) | 0.94 | 0.94 |
| ApoA‐IV | 7.2 (5.6; 9.0) | 8.6 (7.3; 9.8) | 0.033 | 0.12 |
| ApoB | 79.8 (69.9; 92.1) | 89.4 (72.6; 106.1) | 0.11 | 0.20 |
| ApoC‐I | 1.2 (0.9; 1.5) | 1.4 (1.2; 1.8) | 0.11 | 0.20 |
| ApoC‐II | 1.1 (0.8; 1.4) | 1.4 (1.2; 1.7) | 0.0040 | 0.021 |
| ApoC‐III | 5.1 (4.0; 5.8) | 6.4 (5.1; 7.2) | 0.0045 | 0.021 |
| ApoD | 2.4 (2.1; 2.9) | 2.8 (2.2; 3.0) | 0.21 | 0.29 |
| ApoE | 2.4 (1.8; 2.7) | 2.4 (2.0; 3.0) | 0.48 | 0.61 |
| ApoH | 10.8 (9.0; 12.0) | 11.6 (8.9; 13.3) | 0.20 | 0.29 |
| ApoL‐I | 1.3 (1.0; 1.5) | 1.2 (1.1; 1.6) | 0.69 | 0.74 |
| ApoM | 1.6 (1.5; 1.8) | 1.8 (1.6; 2.0) | 0.068 | 0.16 |
| ApoB/ApoA‐I ratio | 6.7 (6.0; 7.7) | 6.1 (5.1; 7.3) | 0.042 | 0.12 |
Values presented are apolipoprotein median (interquartile range) in mg/dL. FDR indicates false discovery rate.
Table 3.
Adjusted Differences in Apolipoprotein Concentrations Between Very Preterm‐Born and Term‐Born Preschool Children
| Apolipoprotein | Fold Change (95% CI)a | P Valuea | P Valueb |
|---|---|---|---|
| ApoA‐I | 1.23 (1.11; 1.36) | <0.001 | 0.003 |
| ApoA‐IV | 1.20 (1.05; 1.37) | 0.009 | <0.001 |
| ApoC‐II | 1.28 (1.09; 1.51) | 0.003 | 0.038 |
| ApoC‐III | 1.24 (1.06; 1.44) | 0.007 | 0.039 |
| ApoB/ApoA‐I ratio | 0.84 (0.74; 0.96) | 0.012 | 0.101 |
The table is confined to apolipoproteins with an uncorrected P<0.05.
P value and fold changes derived from analyses adjusted for age at examination and sex.
P value derived from an analysis adjusted for age at examination, sex, birth weight z‐score, current body mass index z‐score, type of infant feeding, and childhood nutrition profile.
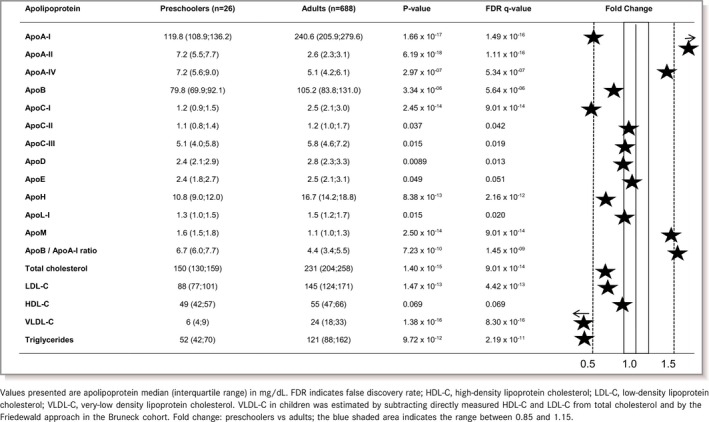
Comparison of Preschoolers and an Adult Population
Fasting apolipoprotein and cholesterol concentrations in term‐born children were in part similar and in part different from levels in an adult population from the same geographic region (Bruneck Study, Table 4).16 In line with other studies, HDL‐C of preschoolers was at or even above the level measured in adults, while LDL‐C was lower and estimated very‐low‐density lipoprotein cholesterol (VLDL‐C) was particularly low.33 The apolipoprotein patterns in preschoolers partly reflected the underlying lipoprotein distributions but deviated in important aspects: (1) Despite low VLDL‐C in preschoolers, plasma levels of apolipoprotein C‐II and C‐III were quantitatively similar to the adult range. (2) At preschool age, plasma levels of typical HDL‐associated apolipoproteins were substantially different from those observed in adults with much lower levels of apolipoprotein A‐I and C‐I but higher levels of apolipoprotein A‐II, A‐IV, and M. Details are displayed in Table 4. Consistent with these findings, apolipoprotein A‐I levels, measured by ELISA, were substantially lower in term‐born children than in adults: median (interquartile range) 61.7 (40.7; 97.4) versus 120.3 (66.0; 225.7), P=0.006.
Table 4.
Comparison of Apolipoprotein Concentrations in Healthy Term‐Born Preschool Children (Age 5–7 Years) and Levels in Adults (Bruneck Study, Age 50–89 Years)
Correlations between apolipoproteins and lipids were similar in very preterm and term‐born preschool children and, thus, shown for both groups combined (Figure 2A). The correlation pattern in preschoolers differed from that in adults16 (Figure 2B) in that apolipoprotein C‐II and C‐III were markedly correlated with the typical HDL‐associated apolipoproteins A‐I and D and HDL‐C (apolipoprotein C‐III only).
Figure 2.
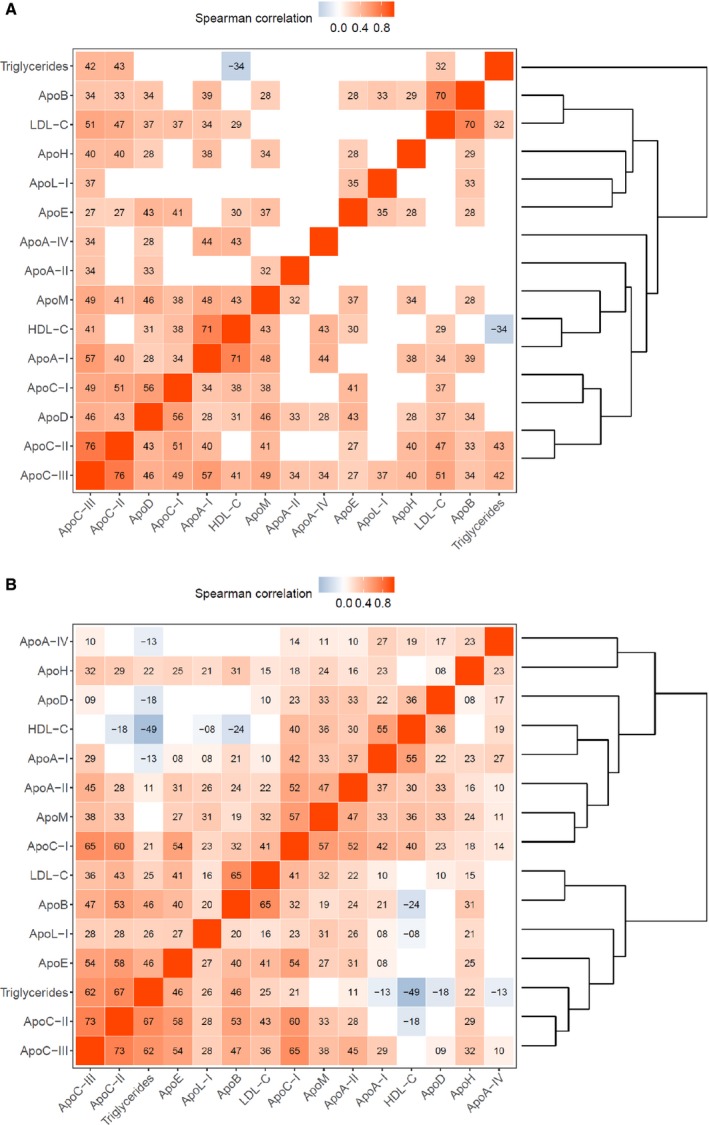
A, Correlations among apolipoproteins and lipids in preschoolers (term and preterm‐born children combined). Tile color indicates direction and magnitude of correlation, tile text gives its sign and first 2 decimal digits. Only statistically significant correlations are shown. Variables are arranged by similarity as shown in the right‐hand dendrogram. B, Correlations among apolipoproteins and lipids in the adult population (Bruneck Study). Tile color indicates direction and magnitude of correlation, tile text gives its sign and first 2 decimal digits. Only statistically significant correlations are shown. Variables are arranged by similarity as shown in the right‐hand dendrogram. Apo, apolipoprotein; HDL‐C, high‐density lipoprotein cholesterol; LDL‐C, low‐density lipoprotein cholesterol.
Discussion
Little is known about apolipoprotein levels and homeostasis in children, especially in those born preterm. In this study, plasma concentrations of a broad range of apolipoproteins were determined in term‐ and very preterm‐born preschool children by applying multiple‐reaction monitoring‐based mass spectrometry. To the best of our knowledge, these are the first data on apolipoprotein levels other than apolipoprotein A‐I and B in preschool children.
Lipid Trajectories in Early Life
Cholesterol levels in our preschool children were substantially lower than those in fetal life. In seminal studies from the late 1990s, average total cholesterol was as high as 427 mg/dL in young fetuses (<6 months), correlated with maternal cholesterol levels, and decreased to lower levels (237 mg/dL) in older fetuses.34, 35 It is presumed that cholesterol in the fetus derives from de novo synthesis rather than maternal or placental cholesterol. Levels of LDL‐C and triglycerides in our preschool children were also lower than in adults, which is in accordance with the published literature.33, 36 In healthy children, LDL‐C progressively rises into adulthood, showing a first peak just before puberty and a temporary decline thereafter.37, 38 The rise in LDL‐C parallels the increase in lean body and fat mass during transition from childhood to adolescence.39 HDL‐C increases during the first 2 years of life, is already high in childhood (around 65 mg/dL), and decreases during puberty—more in males than in females—with lowest levels at about 16 years of age.39 Hepatic lipase is regulated by sex hormones (particularly androgens) and may play a role in the HDL trajectory during puberty. Hepatic lipase modulates HDL‐C metabolism and lowers the plasma HDL‐C levels through its triglyceride hydrolase and phospholipase activities.40
Srinivasan et al studied lipoprotein values in 5‐ to 14‐year‐old children as part of the Bogalusa Heart Study and found that HDL is the prevailing lipoprotein in children (mean particle mass in the fasting stage 403 mg/dL), followed by LDL (189 mg/dL) and small amounts of VLDL (37 mg/dL).33
Apolipoprotein Profiles
Apolipoprotein profiles partly reflect the distribution of lipoprotein particles. For example, lower apolipoprotein B level in preschoolers is proportional to the lower LDL‐C and particularly VLDL‐C concentrations. However, HDL apolipoprotein patterns substantially deviate from those in adults. In particular, levels of apolipoprotein A‐I, which are thought to mediate the reverse cholesterol transport and the anti‐atherogenic potential of HDL, and the apolipoprotein A‐I to HDL‐C ratio were about 50% below the adult levels, whereas apolipoprotein A‐II, A‐IV, and M concentrations emerged as significantly higher in the pediatric study population.41, 42, 43 The substantially lower apolipoprotein A‐I levels in preschoolers were confirmed by ELISA‐based apolipoprotein A‐I measurements. In the Bogalusa Heart Study, low apolipoprotein A‐I in children translated to an increased CVD risk in later life.22 Levels of apolipoprotein C‐I, which mainly resides on HDL particles in a fasting stage, were also markedly lower in preschool children. While the reason for this finding is not clear, it may contribute to the low VLDL levels in children because apolipoprotein C‐I decreases VLDL clearance from plasma and low apolipoprotein C‐I may, thus, confer more efficient clearance.
Apolipoprotein C‐II and Apolipoprotein C‐III
Remarkably, apolipoprotein C‐II and C‐III levels (in children) were similar to (those in) adults. Unlike adults, however, apolipoprotein C‐II and C‐III appear to mainly reside on HDL particles in children as indicated by marked correlations with typical HDL‐associated apolipoproteins and HDL‐C (Figure 2A). Apolipoprotein C‐III ranks among the apolipoproteins most strongly related to CVD risk in adults, and this applies to both apolipoprotein C‐III on VLDL and HDL particles.19 The proportion of these (apolipoproteins) particles on HDL and VLDL is in part related to triglyceride levels, with more being found on VLDL with higher triglycerides.44 The Nurses’ Health and Health Professionals Follow‐Up Studies recently attempted to define effects of the apolipoprotein C‐III content on HDL. Remarkably, HDL particles enriched with apolipoprotein C‐III conferred a high risk of CVD.45 In another study, HDL particles with high apolipoprotein C‐III content stimulated endothelial pro‐apoptotic pathways.46 Finally, apolipoprotein C‐III exerts several pro‐atherogenic properties independent of lipid metabolism.47 Therefore, the high overall HDL‐C levels in children and the even higher levels in the very preterm population (see below) might not be considered as protective against CVD but could be potentially pro‐atherogenic. Further large‐scale studies are required to provide more evidence on the effects of HDL on CVD in children.
Effects of Prematurity on Apolipoprotein Profiles
In comparison to term‐born preschoolers, our very preterm‐born children displayed significantly higher total cholesterol levels (both HDL‐C and LDL‐C) and higher levels of apolipoprotein A‐I, A‐IV, C‐II, and C‐III under adjustments for age at examination, sex, birth weight z‐score, current BMI z‐score, type of infant feeding, and childhood nutrition profile. Of note, all these apolipoproteins are under control of the apolipoprotein A‐I/C‐III/A‐IV gene cluster located on the long arm of chromosome 11q23.48 High glucose levels and insulin resistance have been shown to upregulate transcription of this gene cluster.49 Our very preterm‐born children group indeed exhibited significantly higher glucose levels than the term controls.13 Higher ApoA‐I levels in preterm‐born preschoolers, as observed in our study, is in accordance with a study by Breukhoven reporting higher ApoA‐I levels in preterm‐born young adults.50 There are several publications on apolipoprotein levels in preterm infants after birth and in the early postnatal period. Results at these time‐points, however, cannot be compared with our preschool children, because gut immaturity, parenteral nutrition, and early enteral feedings are known to substantially influence apolipoprotein levels.23
Limitations and Strengths
A limitation of the current study is the small sample size with apolipoprotein measurements being available in 26 former term and 38 former preterm children and the small amounts of residual blood samples, which precluded selective measurement of apolipoproteins on isolated HDL. A main reason for small sample size is that both written informed consent from the legal guardians and verbal assent for taking blood samples from the study participants themselves are required, which is challenging in entirely healthy preschool children. However, our results are novel and further larger studies will give more comprehensive insights. For example, because of the low numbers of children small for gestational age at birth (term: n=2, preterm: n=2), no separate analysis could be conducted. However, exclusion of small‐for‐gestational‐age‐born children yielded similar results. In addition, although the comparison of apolipoproteins concentrations between healthy term‐born and very preterm‐born preschool children was adjusted for various potential confounders (age at examination, sex, birth weight z‐score, current BMI z‐score, type of infant feeding, and childhood nutrition profile), residual confounding cannot be excluded. Strengths include the high methodological standards and the very same measurement methods (multiple‐reaction monitoring–based mass spectrometry) applied to the pediatric and adult populations (same laboratory and same team). Although liquid chromatography mass spectrometry quantification provides protein concentrations, liquid chromatography mass spectrometry measurements are performed at the peptide level. Thus, absolute values may differ compared with protein measurements using antibody‐based techniques. We validated our key findings for apolipoprotein C‐II and apolipoprotein C‐III from the liquid chromatography mass spectrometry–based measurements by standard assays. Even though absolute concentrations were different, apolipoprotein levels obtained by both methods were highly correlated.
Conclusion
In conclusion, our study gives novel insights into apolipoprotein levels of preschool children and characterizes potential effects of prematurity. Apparently, HDL particles in preschoolers might have a distinct apolipoprotein composition and probably also function compared with adults. High levels of apolipoprotein C‐III may represent a pro‐atherogenic risk factor already in early life, given the concept that not only the absolute levels of pro‐atherogenic lipids and apolipoproteins but also their cumulative duration of exposure matters for CVD risk.51
Sources of Funding
This study was supported by the Anniversary Fund of the Austrian National Bank (Project No. 14570) and the Austrian Heart Foundation. Prof Ursula Kiechl‐Kohlendorfer is also supported by the excellence initiative (Competence Centers for Excellent Technologies [COMET]) of the Austrian Research Promotion Agency (FFG): “Research Center of Excellence in Vascular Ageing ‐ Tyrol, VASCage” (K‐Project No. 843536) funded by Bundesministerium für Verkehr, Innovation und Technologie, Bundesministerium für Bildung, Wissenschaft und Forschung, Wirtschaftsagentur Wien, and Standortagentur Tirol. Prof Manuel Mayr is a British Heart Foundation (BHF) Chair Holder (CH/16/3/32406) with BHF programme grant support (RG/16/14/32397). This work was supported by the National Institute of Health Research (NIHR) Biomedical Research Centre based at Guy's and St Thomas’ National Health Service (NHS) Foundation Trust and King's College London in partnership with King's College Hospital.
Disclosures
None.
(J Am Heart Assoc. 2019;8:e011199 DOI: 10.1161/JAHA.118.011199.)
References
- 1. Blencowe H, Cousens S, Chou D, Oestergaard M, Say L, Moller AB, Kinney M, Lawn J. Born too soon: the global epidemiology of 15 million preterm births. Reprod Health. 2013;10(suppl 1):S2. [DOI] [PMC free article] [PubMed] [Google Scholar]
- 2. Blencowe H, Cousens S, Oestergaard MZ, Chou D, Moller AB, Narwal R, Adler A, Vera Garcia C, Rohde S, Say L, Lawn JE. National, regional, and worldwide estimates of preterm birth rates in the year 2010 with time trends since 1990 for selected countries: a systematic analysis and implications. Lancet. 2012;379:2162–2172. [DOI] [PubMed] [Google Scholar]
- 3. Patel RM, Kandefer S, Walsh MC, Bell EF, Carlo WA, Laptook AR, Sanchez PJ, Shankaran S, Van Meurs KP, Ball MB, Hale EC, Newman NS, Das A, Higgins RD, Stoll BJ. Causes and timing of death in extremely premature infants from 2000 through 2011. N Engl J Med. 2015;372:331–340. [DOI] [PMC free article] [PubMed] [Google Scholar]
- 4. Stoll BJ, Hansen NI, Bell EF, Walsh MC, Carlo WA, Shankaran S, Laptook AR, Sanchez PJ, Van Meurs KP, Wyckoff M, Das A, Hale EC, Ball MB, Newman NS, Schibler K, Poindexter BB, Kennedy KA, Cotten CM, Watterberg KL, D'Angio CT, DeMauro SB, Truog WE, Devaskar U, Higgins RD. Trends in care practices, morbidity, and mortality of extremely preterm neonates, 1993–2012. JAMA. 2015;314:1039–1051. [DOI] [PMC free article] [PubMed] [Google Scholar]
- 5. Bayman E, Drake AJ, Piyasena C. Prematurity and programming of cardiovascular disease risk: a future challenge for public health? Arch Dis Child Fetal Neonatal Ed. 2014;99:F510–F514. [DOI] [PubMed] [Google Scholar]
- 6. Sipola‐Leppanen M, Kajantie E. Should we assess cardiovascular risk in young adults born preterm? Curr Opin Lipidol. 2015;26:282–287. [DOI] [PubMed] [Google Scholar]
- 7. Sipola‐Leppanen M, Vaarasmaki M, Tikanmaki M, Hovi P, Miettola S, Ruokonen A, Pouta A, Jarvelin MR, Kajantie E. Cardiovascular risk factors in adolescents born preterm. Pediatrics. 2014;134:e1072–e1081. [DOI] [PubMed] [Google Scholar]
- 8. Kajantie E, Hovi P. Is very preterm birth a risk factor for adult cardiometabolic disease? Semin Fetal Neonatal Med. 2014;19:112–117. [DOI] [PubMed] [Google Scholar]
- 9. Parkinson JR, Hyde MJ, Gale C, Santhakumaran S, Modi N. Preterm birth and the metabolic syndrome in adult life: a systematic review and meta‐analysis. Pediatrics. 2013;131:e1240–e1263. [DOI] [PubMed] [Google Scholar]
- 10. Kerkhof GF, Breukhoven PE, Leunissen RW, Willemsen RH, Hokken‐Koelega AC. Does preterm birth influence cardiovascular risk in early adulthood? J Pediatr. 2012;161:390–396.e391. [DOI] [PubMed] [Google Scholar]
- 11. Odri Komazec I, Posod A, Schwienbacher M, Resch M, Pupp Peglow U, Kiechl S, Baumgartner D, Kiechl‐Kohlendorfer U. Aortic elastic properties in preschool children born preterm. Arterioscler Thromb Vasc Biol. 2016;36:2268–2274. [DOI] [PubMed] [Google Scholar]
- 12. Posod A, Muller S, Komazec IO, Dejaco D, Peglow UP, Griesmaier E, Scholl‐Burgi S, Karall D, Kiechl‐Kohlendorfer U. Former very preterm infants show alterations in plasma amino acid profiles at a preschool age. Pediatr Res. 2017;81:787–794. [DOI] [PubMed] [Google Scholar]
- 13. Posod A, Odri Komazec I, Kager K, Pupp Peglow U, Griesmaier E, Schermer E, Wurtinger P, Baumgartner D, Kiechl‐Kohlendorfer U. Former very preterm infants show an unfavorable cardiovascular risk profile at a preschool age. PLoS One. 2016;11:e0168162. [DOI] [PMC free article] [PubMed] [Google Scholar]
- 14. Mahley RW, Innerarity TL, Rall SC Jr, Weisgraber KH. Plasma lipoproteins: apolipoprotein structure and function. J Lipid Res. 1984;25:1277–1294. [PubMed] [Google Scholar]
- 15. Franceschini G. Apolipoprotein function in health and disease: insights from natural mutations. Eur J Clin Invest. 1996;26:733–746. [DOI] [PubMed] [Google Scholar]
- 16. Pechlaner R, Tsimikas S, Yin X, Willeit P, Baig F, Santer P, Oberhollenzer F, Egger G, Witztum JL, Alexander VJ, Willeit J, Kiechl S, Mayr M. Very‐low‐density lipoprotein‐associated apolipoproteins predict cardiovascular events and are lowered by inhibition of APOC‐III. J Am Coll Cardiol. 2017;69:789–800. [DOI] [PMC free article] [PubMed] [Google Scholar]
- 17. Gerber Y, Goldbourt U, Cohen H, Harats D. Association between serum apolipoprotein C(II) concentration and coronary heart disease. Prev Med. 2002;35:42–47. [DOI] [PubMed] [Google Scholar]
- 18. Jorgensen AB, Frikke‐Schmidt R, Nordestgaard BG, Tybjaerg‐Hansen A. Loss‐of‐function mutations in APOC3 and risk of ischemic vascular disease. N Engl J Med. 2014;371:32–41. [DOI] [PubMed] [Google Scholar]
- 19. Wyler von Ballmoos MC, Haring B, Sacks FM. The risk of cardiovascular events with increased apolipoprotein CIII: a systematic review and meta‐analysis. J Clin Lipidol. 2015;9:498–510. [DOI] [PubMed] [Google Scholar]
- 20. Walldius G, Jungner I, Holme I, Aastveit AH, Kolar W, Steiner E. High apolipoprotein B, low apolipoprotein A‐I, and improvement in the prediction of fatal myocardial infarction (AMORIS study): a prospective study. Lancet. 2001;358:2026–2033. [DOI] [PubMed] [Google Scholar]
- 21. Walldius G, Jungner I. Apolipoprotein B and apolipoprotein A‐I: risk indicators of coronary heart disease and targets for lipid‐modifying therapy. J Intern Med. 2004;255:188–205. [DOI] [PubMed] [Google Scholar]
- 22. Srinivasan SR, Berenson GS. Serum apolipoproteins A‐I and B as markers of coronary artery disease risk in early life: the Bogalusa Heart study. Clin Chem. 1995;41:159–164. [PubMed] [Google Scholar]
- 23. Hellgren G, Engstrom E, Smith LE, Lofqvist C, Hellstrom A. Effect of preterm birth on postnatal apolipoprotein and adipocytokine profiles. Neonatology. 2015;108:16–22. [DOI] [PMC free article] [PubMed] [Google Scholar]
- 24. Shoji H, Murano Y, Mori M, Matsunaga N, Ohkawa N, Suganuma H, Ikeno M, Hisata K, Hirayama S, Ueno T, Miida T, Shimizu T. Lipid profile and atherogenic indices soon after birth in Japanese preterm infants. Acta Paediatr. 2014;103:22–26. [DOI] [PubMed] [Google Scholar]
- 25. Fenton TR, Kim JH. A systematic review and meta‐analysis to revise the Fenton growth chart for preterm infants. BMC Pediatr. 2013;13:59. [DOI] [PMC free article] [PubMed] [Google Scholar]
- 26. Kromeyer‐Hauschild K, Wabitsch M, Kunze D, Gellert F, Geiß HC, Hesse V. Percentiles of body mass index in children and adolescents evaluated from different regional German cohorts. Monatsschr Kinderheilkd. 2001;149:807–818. [Google Scholar]
- 27. Geerts CC, Evelein AM, Bots ML, van der Ent CK, Grobbee DE, Uiterwaal CS. Body fat distribution and early arterial changes in healthy 5‐year‐old children. Ann Med. 2011;44:350–359. [DOI] [PubMed] [Google Scholar]
- 28. Stolzenberg H, Kahl H, Bergmann KE. Körpermaße bei Kindern und Jugendlichen in Deutschland. Ergebnisse des Kinder‐ und Jugendgesundheitssurveys (KiGGS). Bundesgesundheitsblatt, Gesundheitsforschung, Gesundheitsschutz. 2007;50:659–669. [DOI] [PubMed] [Google Scholar]
- 29. Ramirez‐Velez R, Lopez‐Cifuentes MF, Correa‐Bautista JE, Gonzalez‐Ruiz K, Gonzalez‐Jimenez E, Cordoba‐Rodriguez DP, Vivas A, Triana‐Reina HR, Schmidt‐RioValle J. Triceps and subscapular skinfold thickness percentiles and cut‐offs for overweight and obesity in a population‐based sample of schoolchildren and adolescents in Bogota, Colombia. Nutrients. 2016;8:E595. [DOI] [PMC free article] [PubMed] [Google Scholar]
- 30. Slaughter MH, Lohman TG, Boileau RA, Horswill CA, Stillman RJ, Van Loan MD, Bemben DA. Skinfold equations for estimation of body fatness in children and youth. Hum Biol. 1988;60:709–723. [PubMed] [Google Scholar]
- 31. Truthmann J, Mensink GB, Richter A. Relative validation of the KiGGS Food Frequency Questionnaire among adolescents in Germany. Nutr J. 2011;10:133. [DOI] [PMC free article] [PubMed] [Google Scholar]
- 32. Schenk L, Anton V, Baer N‐R, Schmitz R. Food patterns of children and adolescents with migration background: findings of the KiGGs study (German). Public Health Forum. 2016;24:205–208. [Google Scholar]
- 33. Srinivasan SR, Frerichs RR, Webber LS, Berenson GS. Serum lipoprotein profile in children from a biracial community: the Bogalusa Heart Study. Circulation. 1976;54:309–318. [DOI] [PubMed] [Google Scholar]
- 34. Napoli C. Low density lipoprotein oxidation and atherogenesis: from experimental models to clinical studies. G Ital Cardiol. 1997;27:1302–1314. [PubMed] [Google Scholar]
- 35. Napoli C, Glass CK, Witztum JL, Deutsch R, D'Armiento FP, Palinski W. Influence of maternal hypercholesterolaemia during pregnancy on progression of early atherosclerotic lesions in childhood: fate of Early Lesions in Children (FELIC) study. Lancet. 1999;354:1234–1241. [DOI] [PubMed] [Google Scholar]
- 36. Can M, Piskin E, Guven B, Acikgoz S, Mungan G. Evaluation of serum lipid levels in children. Pediatr Cardiol. 2013;34:566–569. [DOI] [PubMed] [Google Scholar]
- 37. Hickman TB, Briefel RR, Carroll MD, Rifkind BM, Cleeman JI, Maurer KR, Johnson CL. Distributions and trends of serum lipid levels among United States children and adolescents ages 4–19 years: data from the Third National Health and Nutrition Examination Survey. Prev Med. 1998;27:879–890. [DOI] [PubMed] [Google Scholar]
- 38. Eissa MA, Mihalopoulos NL, Holubkov R, Dai S, Labarthe DR. Changes in fasting lipids during puberty. J Pediatr. 2016;170:199–205. [DOI] [PMC free article] [PubMed] [Google Scholar]
- 39. Agirbasli M, Tanrikulu AM, Berenson GS. Metabolic syndrome: bridging the gap from childhood to adulthood. Cardiovasc Ther. 2016;34:30–36. [DOI] [PubMed] [Google Scholar]
- 40. Bersot TP, Vega GL, Grundy SM, Palaoglu KE, Atagunduz P, Ozbayrakci S, Gokdemir O, Mahley RW. Elevated hepatic lipase activity and low levels of high density lipoprotein in a normotriglyceridemic, nonobese Turkish population. J Lipid Res. 1999;40:432–438. [PubMed] [Google Scholar]
- 41. Tall AR, Small DM. Plasma high‐density lipoproteins. N Engl J Med. 1978;299:1232–1236. [DOI] [PubMed] [Google Scholar]
- 42. Karlsson H, Leanderson P, Tagesson C, Lindahl M. Lipoproteomics I: mapping of proteins in low‐density lipoprotein using two‐dimensional gel electrophoresis and mass spectrometry. Proteomics. 2005;5:551–565. [DOI] [PubMed] [Google Scholar]
- 43. Ghiselli G, Krishnan S, Beigel Y, Gotto AM Jr. Plasma metabolism of apolipoprotein A‐IV in humans. J Lipid Res. 1986;27:813–827. [PubMed] [Google Scholar]
- 44. Schonfeld G, George PK, Miller J, Reilly P, Witztum J. Apolipoprotein C‐II and C‐III levels in hyperlipoproteinemia. Metabolism. 1979;28:1001–1010. [DOI] [PubMed] [Google Scholar]
- 45. Jensen MK, Aroner SA, Mukamal KJ, Furtado JD, Post WS, Tsai MY, Tjonneland A, Polak JF, Rimm EB, Overvad K, McClelland RL, Sacks FM. High‐density lipoprotein subspecies defined by presence of apolipoprotein C‐III and incident coronary heart disease in four cohorts. Circulation. 2017;137:1364–1373. [DOI] [PMC free article] [PubMed] [Google Scholar]
- 46. Riwanto M, Rohrer L, Roschitzki B, Besler C, Mocharla P, Mueller M, Perisa D, Heinrich K, Altwegg L, von Eckardstein A, Luscher TF, Landmesser U. Altered activation of endothelial anti‐ and proapoptotic pathways by high‐density lipoprotein from patients with coronary artery disease: role of high‐density lipoprotein‐proteome remodeling. Circulation. 2013;127:891–904. [DOI] [PubMed] [Google Scholar]
- 47. Jin JL, Guo YL, Li JJ. Apoprotein C‐III: a review of its clinical implications. Clin Chim Acta. 2016;460:50–54. [DOI] [PubMed] [Google Scholar]
- 48. Haddad LA, Ordovas JM, Fitzpatrick T, Karathanasis SK. Linkage, evolution, an expression of the rat apolipoprotein A‐I, C‐II, and A‐IV genes. J Biol Chem. 1986;261:13268–13277. [PubMed] [Google Scholar]
- 49. Caron S, Verrijken A, Mertens I, Samanez CH, Mautino G, Haas JT, Duran‐Sandoval D, Prawitt J, Francque S, Vallez E, Muhr‐Tailleux A, Berard I, Kuipers F, Kuivenhoven JA, Biddinger SB, Taskinen MR, Van Gaal L, Staels B. Transcriptional activation of apolipoprotein CIII expression by glucose may contribute to diabetic dyslipidemia. Arterioscler Thromb Vasc Biol. 2011;31:513–519. [DOI] [PubMed] [Google Scholar]
- 50. Breukhoven PE, Kerkhof GF, Willemsen RH, Hokken‐Koelega AC. Fat mass and lipid profile in young adults born preterm. J Clin Endocrinol Metab. 2012;97:1294–1302. [DOI] [PubMed] [Google Scholar]
- 51. Ference BA, Ginsberg HN, Graham I, Ray KK, Packard CJ, Bruckert E, Hegele RA, Krauss RM, Raal FJ, Schunkert H, Watts GF, Boren J, Fazio S, Horton JD, Masana L, Nicholls SJ, Nordestgaard BG, van de Sluis B, Taskinen MR, Tokgozoglu L, Landmesser U, Laufs U, Wiklund O, Stock JK, Chapman MJ, Catapano AL. Low‐density lipoproteins cause atherosclerotic cardiovascular disease. 1. Evidence from genetic, epidemiologic, and clinical studies. A consensus statement from the European Atherosclerosis Society Consensus Panel. Eur Heart J. 2017;38:2459–2472. [DOI] [PMC free article] [PubMed] [Google Scholar]