Abstract
Head and neck squamous cell carcinoma (HNSC) is one of most common types of cancer worldwide, and mRNAs and long non-coding RNAs (lncRNAs) have been identified as prognostic biomarkers in HNSC. In the present study, using gene expression datasets from multiple platforms, survival-associated genes in HNSC were identified. Subsequently, a combination of 17 genes (14 mRNAs and 3 lncRNA) was optimized using random forest variable hunting and a risk score model for HNSC prognosis was developed using a cohort from The Cancer Genome Atlas. Patients with high-risk scores tend to have earlier disease recurrence and lower survival rates, compared with those with low-risk scores. This observation was further validated in three independent datasets (GSE41613, GSE10300 and E-MTAB-302). Association analysis revealed that the risk score is independent of other clinicopathological observations. On the basis of the results depicted in the nomogram, the risk score performs better in 3-year survival rate prediction than other clinical observations. In summary, the lncRNA-mRNA signature-based risk score successfully predicts the survival of HNSC and serves as an indicator of prognosis.
Keywords: prognosis, head and neck squamous cell carcinoma, mRNA and long non-coding RNA
Introduction
Head and neck squamous cell carcinoma (HNSC) is one of the most common types of cancer worldwide (1). According to a recent study, 108,700 new cases were identified and 56,200 mortalities occurred as a result of HNSC in China in 2015 (2). The reasons behind HNSC carcinogenesis include smoking and human papilloma virus (HPV) infection (3). The 5-year survival rate of HNSC is estimated to be ~50% (4); although novel treatment methods have been utilized, the survival rate has not improved significantly over recent decades (5). Therefore, a prognostic model was urgently required.
Non-coding RNAs, particularly long non-coding RNAs (lncRNAs), have been the subjects of considerable attention in recent years, although the abundance of these RNAs is much lower than that of mRNAs (6). lncRNAs serve crucial roles in various cellular processes in HNSC, including carcinogenesis and progression (6–14). Metastasis associated lung adenocarcinoma transcript 1 (MALAT1) was identified as an oncogene, and the high expression of MALAT1 is associated with metastasis and poor survival across different cancer types (15–17). Suppression of HOX transcript antisense RNA expression was reported to induce apoptosis and to inhibit proliferation of HNSC cells (18). In addition to their use as prognostic markers, certain lncRNAs, including growth arrest specific 5, were reported to be participate in treatment response (19). Chemotherapy drugs, including cisplatin and paclitaxel, have been demonstrated to exert effects on lncRNAs (20), to a certain extent.
In line with this, lncRNAs and mRNAs significantly associated with survival were identified using Cox univariate regression based on two independent datasets. To facilitate the utilization and to reduce the size of the panel, random forest variable hunting was implemented and 17 lncRNA-mRNAs were used to develop the model, which estimated the survival with risk scores. The risk score was significantly associated with survival in all the training and test datasets involved. Association analyses revealed that the risk score is a prognostic factor that is independent of other clinical observations.
Materials and methods
Raw data pre-processing
The Cancer Genome Atlas (TCGA) expression data evaluated using RNA-seq was downloaded from the TCGA website (http://cancergenome.nih.gov/), the upper quantile fragments per kilobase per million (FPKM) method (21) was used to normalize primary HNSC samples. The normal, recurrent and metastatic samples were removed and genes expressed in <80% samples were excluded for further analysis. Half of the minimum FPKM value (except for zero) was used in order to avoid zero values for each gene. Subsequently, the expression data were log2-transformed. The pre-processed data was then z-transformed for further analysis. The raw microarrays data were downloaded from the Gene Expression Omnibus (https://www.ncbi.nlm.nih.gov/geo) and the ArrayExpress (http://www.ebi.ac.uk/arrayexpress/) websites (21–23). Following background correction and normalization, the expression values were calculated. If several probes represented the same gene, the mean value was used as the expression value. Z-scores of each sample in each dataset were also evaluated. The probes were matched to lncRNAs, as described in a previous study (24).
Prediction of gene selection and Cox multivariate regression model
Cox univariate regression was performed on the Cancer Genome Atlas Head-Neck Squamous Cell Carcinoma (TCGA-HNSC) (n=407) and GSE41613 (n=97) datasets (24), and the lncRNAs/mRNAs significantly associated with overall survival (OS) (P<0.01) in the two datasets were identified as candidate genes, with 87 genes being identified. To narrow down the panel and optimize the results, random forest variable hunting was performed to identify biomarker combinations for survival prediction with 100 replications and 100 iterations, using z-score-transformed expression values and OS information. The selected 17 lncRNAs and mRNAs were used to develop the Cox multivariate regression model, with the ‘coxph’ function in the R package ‘survival’ (25). In the validation datasets, coefficients were locked and the risk score for each sample was calculated. The risk score was calculated using the following formula; where β indicates the coefficients evaluated with gene expression and xi refers to the relative gene expression level.
The risk score of each sample was calculated in each dataset, and the median risk score value of each dataset was used to divide the high-risk and low-risk group.
Statistical analysis
All statistical analyses involved in the present study were implemented on R (https://www.r-project.org/; v3.0.1) platform and R packages. Normalization of Affymetrix raw data was performed using the R package ‘affy’ (26) using function ‘rma’. The survival analysis and Cox proportional hazards model was performed using the R package ‘survival’ and the random forest for variable hunting performed using the package ‘randomForestSRC’ (27,28). The receiver operating characteristic curves were drawn using R package ‘pROC’ (25), and the nomogram was drawn using R package ‘rms’ (29).
Results
Identification of 87 survival-associated mRNAs and lncRNAs
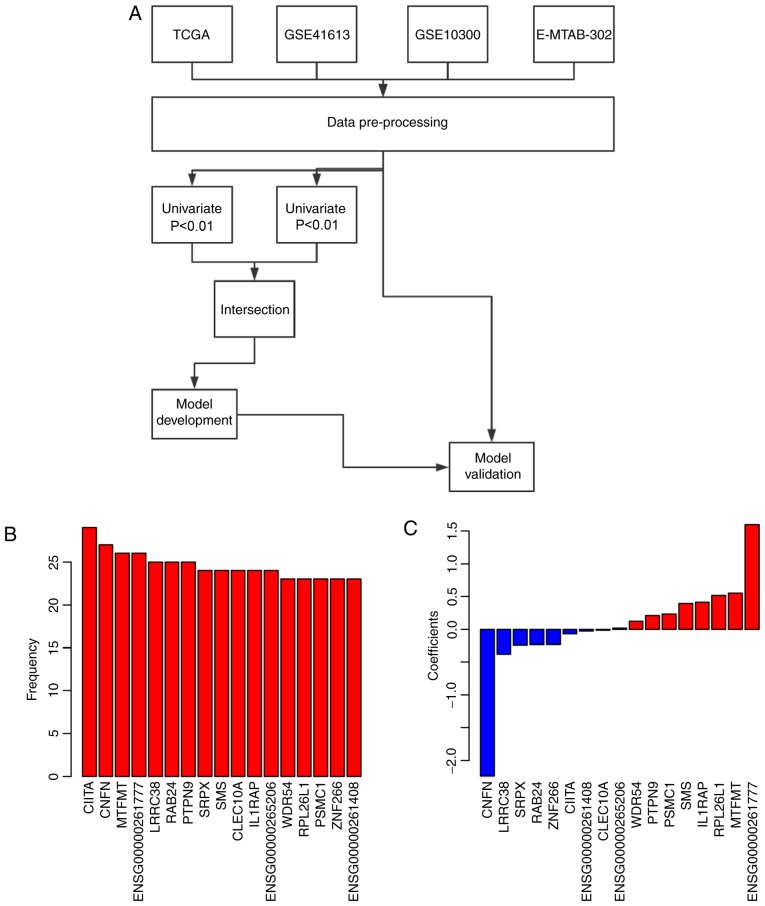
Over-fit often occurs in model development. To avoid this, Cox univariate regression was implement in two independent datasets, TCGA-HNSC (n=407) and GSE41613 (n=97). lncRNAs and mRNAs detected in the two platforms (next-generation sequencing assembly by TCGA and affymetrix HG U133 plus 2) were retained for further analysis. The mRNAs and lncRNAs that were significantly associated with overall survival in the two datasets (Cox univariate regression; P<0.01) were retained for further analysis. In total, 87 genes, including 10 lncRNAs and 77 mRNAs, were identified. To reduce redundancy, a random forest variable hunting algorithm was implemented to optimize the panel of lncRNAs and mRNAs. Finally, 17 genes (14 mRNAs and 3 lncRNAs) were identified (Fig. 1A). The coefficients of 8 genes were negative and those of 9 other genes were positive (Fig. 1B). The Cox univariate regression and multivariate regression parameters are presented in Table I.
Figure 1.
Selection of 17 lncRNAs and mRNAs. (A) The frequency of genes selected during random forest variable hunting and (B) the coefficients of 17 RNAs. (C) The coefficient of each gene was shown. lncRNAs, long non-coding RNAs; TCGA, The Cancer Genome Atlas.
Table I.
Cox univariate and multivariate regression of genes involved.
| Univariate Cox regression | Multivariate Cox regression | |||||
|---|---|---|---|---|---|---|
| Gene | HR | 95% CI | P-value | HR | 95% CI | P-value |
| WDR54 | 2.30 | 1.30–4.10 | 0.004 | 0.68 | 0.32–1.47 | 0.330 |
| RPL26L1 | 3.90 | 1.40–10.00 | 0.007 | 4.95 | 1.38–17.73 | 0.014 |
| PSMC1 | 5.20 | 2.00–14.00 | 0.001 | 1.74 | 0.60–5.07 | 0.311 |
| SRPX | 1.50 | 1.10–2.10 | 0.006 | 0.99 | 0.68–1.44 | 0.945 |
| SMS | 2.80 | 1.40–5.50 | 0.003 | 1.49 | 0.60–3.66 | 0.387 |
| MTFMT | 4.50 | 1.50–13.00 | 0.007 | 1.26 | 0.32–4.91 | 0.736 |
| CNFN | 0.77 | 0.64–0.93 | 0.007 | 0.80 | 0.62–1.02 | 0.070 |
| CLEC10A | 0.59 | 0.44–0.80 | 0.001 | 0.79 | 0.49–1.25 | 0.314 |
| LRRC38 | 1.30 | 1.10–1.60 | 0.007 | 1.13 | 0.92–1.39 | 0.252 |
| RAB24 | 0.42 | 0.23–0.76 | 0.005 | 1.02 | 0.41–2.52 | 0.965 |
| PTPN9 | 4.10 | 1.40–12.00 | 0.008 | 1.52 | 0.36–6.38 | 0.570 |
| ZNF266 | 0.11 | 0.045–0.26 | <0.001 | 0.11 | 0.04–0.29 | <0.001 |
| CIITA | 0.60 | 0.43–0.83 | 0.002 | 0.98 | 0.59–1.62 | 0.924 |
| IL1RAP | 2.00 | 1.20–3.40 | 0.009 | 1.23 | 0.70–2.18 | 0.468 |
| ENSG00000261408 | 0.53 | 0.34–0.84 | 0.007 | 0.93 | 0.51–1.71 | 0.826 |
| ENSG00000261777 | 1.90 | 1.20–3.10 | 0.009 | 1.67 | 0.95–2.95 | 0.074 |
| ENSG00000265206 | 0.55 | 0.42–0.73 | <0.001 | 0.79 | 0.53–1.20 | 0.271 |
HR, hazard ratio; CI, confidence interval; WDR54, WD repeat domain 54; RPL26L1, ribosomal protein L26 like 1; PSMC1, proteasome 26S subunit, ATPase 1; SRPX, sushi repeat containing protein, X-linked; SMS, spermine synthase; MTFMT, mitochondrial methionyl-tRNA formyltransferase; CNFN, cornifelin; CLEC10A, C-type lectin domain containing 10A; LRRC38, leucine rich repeat containing 38; RAB24, member RAS oncogene family; PTPN9, protein tyrosine phosphatase, non-receptor type 9; ZNF266, zinc finger protein 266; CIITA, class II major histocompatibility complex transactivator; IL1RAP, interleukin 1 receptor accessory protein.
Risk score in the training dataset
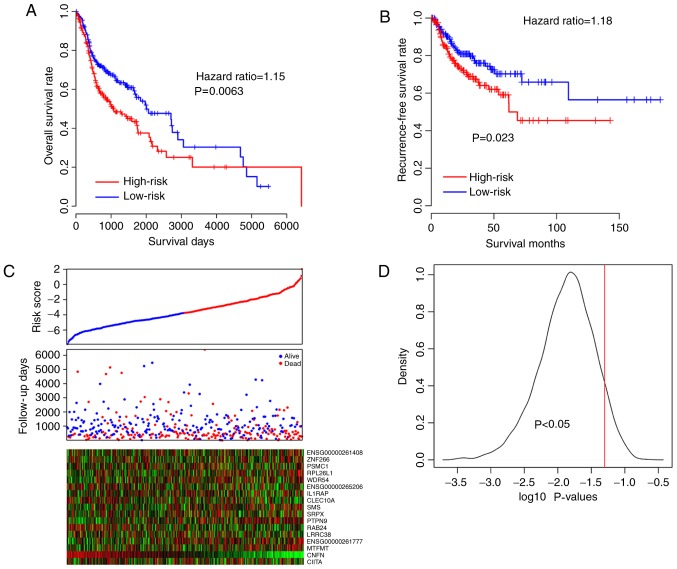
Cox multivariable regression was used to develop the risk score model based on the z-score that transformed the 17 gene expression in the largest cohort, TCGA-HNSC dataset. The risk scores of samples in each dataset were calculated using the following formula: Risk score=(−0.0250*ENSG00000261408) + (−0.2286*zinc finger protein 266) + (0.2334*proteasome 26S subunit, ATPase 1) + (0.5152*ribosomal protein L26 like 1) + (0.1220*WD repeat domain 54) + (0.0203*ENSG00000265206) + (0.4167*interleukin 1 receptor accessory protein) + (−0.0133*C-type lectin domain containing 10A) + (0.3976*spermine synthase) + (−0.2395*sushi repeat containing protein, X-linked) + (0.2100*protein tyrosine phosphatase, non-receptor type 9) + (−0.2305*RAB24, member RAS oncogene family) + (−0.3801*leucine rich repeat containing 38) + (1.5993*ENSG00000261777) + (0.5527*mitochondrial methionyl-tRNA formyltransferase) + (−2.2410*cornifelin) + (−0.0681*class II major histocompatibility complex transactivator). The risk score for each patient was calculated, and the samples were divided into high-risk and low-risk groups using the median risk scores of the TCGA-HNSC samples as cut-off values. The OS times of the high-risk group were significantly (P<0.05) shorter than that of the low-risk group (Fig. 2A). The recurrence-free survival rate was also evaluated in TCGA-HNSC dataset, with the results demonstrating that the high-risk group exhibited significantly shorter recurrence-free survival (RFS) times (Fig. 2B). The high-risk group samples tend to have lower survival rates, high expression of oncogenes and low expression of tumor suppressor genes (Fig. 2C). In order to test the robustness of the risk score, P-values were calculated by retrieving 80% of samples from the dataset (K-fold), and this process was repeated 10,000 times. In 92.59% of cases, the difference in survival rate between the risk-high and risk-low groups was statistically significant, as depicted in Fig. 2D.
Figure 2.
Risk score in The Cancer Genome Atlas (training datasets). (A) Overall survival and (B) recurrence-free survival of the high-risk and low-risk groups. (C) The association between risk score (upper), survival information (middle) and z-score transformed expression value (bottom). (D) The density was assayed.
Risk-score performance validation
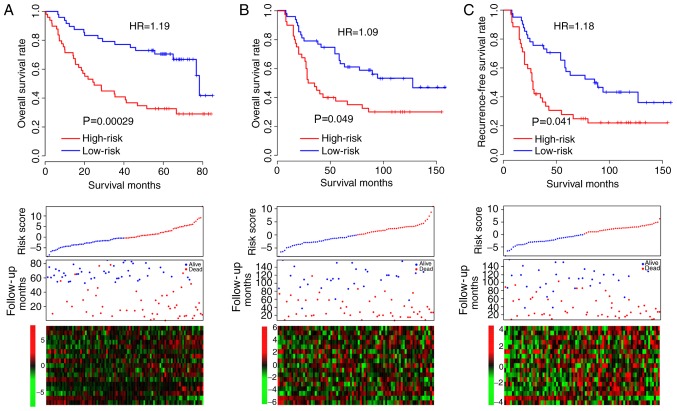
The high performance of the risk score may result from over-fit; thus, the robustness of the risk score was further validated in other independent datasets, GSE41613 (n=97), GSE10300 (n=81) and E-TABM-302 (n=81). Following the locking of coefficients in each dataset, the risk scores were calculated and the high/low-risk groups were divided according to the median risk score in each dataset. The overall survival (OS) and recurrence-free survival (RFS) of the high-risk group were significantly lower than those of the low-risk group (Fig. 3A-C, top). The expression patterns of these 17 genes in these datasets was similar to those of the training dataset (Fig. 3A-C). Together, these results indicated that the risk-score staging model was robust across datasets and platforms (RNA-seq and microarray).
Figure 3.
Risk score validation in three independent datasets. The survival plot (upper), risk score (middle), survival information (bottom) and z-score transformed seventeen gene expression values are presented in the (A) GSE41613 (B) GSE10300 and (C) E-TABM-302 datasets. HR, hazard ratio.
To test the performance of random forest variable hunting, which has previously been used for biomarker combination screening (24,26), 20 randomly-selected 17-gene panels were generated, and the risk score model was developed using these genes. However, the majority of combinations were not statistically significantly different in the four datasets (17/20; Table II), indicating that random forest variable hunting is a powerful tool for candidate gene selection.
Table II.
Twenty (20) random combination performance in datasets.
| Combination/dataset | E302 | GSE10300 | GSE41613 | TCGA-OS |
|---|---|---|---|---|
| ENSG00000245213, ENSG00000212694, LRRC38, NEK6, FOXN1, SRPX, CALML5, STC1, DOT1L, SPOCK1, P4HA1, ZNF823, CLEC10A, EXPH5, MAST4, AHSG, CNFN | 0.034280 | 0.029630 | 0.040090 | 0.000003 |
| ZNF266, STC1, B4GALNT1, PIK3C2B, SSR3, RPL26L1, ENSG00000265206, ENSG00000261269, GPN1, CALML5, TOR1A, AREG, ZBED6CL, SNX20, PPFIBP2, ENSG00000258634, ENSG00000228863 | 0.047550 | 0.029340 | 0.039440 | 0.001180 |
| GABARAPL2, ENSG00000258634, MRPS23, EZH1, TOMM34, VEPH1, SH3BP5L, IL2RG, AREG, ZNF266, SPOCK1, SRPX, ALG2, FOXN1, ZNF697, OSGIN2, ENSG00000261408 | 0.087940 | 0.258250 | 0.943440 | 0.058420 |
| ENSG00000261408, ZNF266, PSMC1, RPL26L1, WDR54, ENSG00000265206, IL1RAP, CLEC10A, SMS, SRPX, PTPN9, RAB24, LRRC38, ENSG00000261777, MTFMT, CNFN, CIITA | 0.013950 | 0.045830 | 0.000290 | 0.006270 |
| RPL26L1, ENSG00000271870, MRPS23, TOR1A, CNFN, NAT8L, IL2RG, LIF, CSTA, LTB, P2RY14, PTPN9, SPINK5, UNK, MAST4, ENSG00000228863, ENSG00000212694 | 0.116500 | 0.026790 | 0.000390 | 0.987820 |
| SSR3, FOXN1, EZH1, SRPX, ZNF266, PLOD2, CLEC10A, LTB, MRPS23, STC1, SPOCK1, BOD1, SGCE, BFAR, SMS, ALG2, CALML5 | 0.186930 | 0.239400 | 0.239550 | 0.166820 |
| OSGIN2, STC1, SMS, ENSG00000261269, PIK3C2B, SSR3, CNFN, GABARAPL2, GRIN3A, ARHGAP30, CLEC10A, BFAR, RASSF2, MSANTD3, IL2RG, SYT14, BOD1 | 0.268740 | 0.807370 | 0.093000 | 0.000001 |
| GAL3ST1, AQP1, ADAP2, MRPS23, ICOS, CAMK2N1, LRRC38, SPINK5, PIK3C2B, CSTA, CIITA, PLOD2, EZH1, PSMC1, ENSG00000261777, ENSG00000212694, GABARAPL2 | 0.435250 | 0.132970 | 0.000002 | 0.000017 |
| ZNF823, CRIPAK, PLOD2, SPOCK1, TRIM32, EZH1, MSANTD3, WDR54, TBC1D17, ENSG00000261269, GPN1, TOR1A, GAL3ST1, CNFN, XPR1, PSMC1, VEPH1 | 0.506950 | 0.441650 | 0.000008 | 0.005540 |
| HMGA2, IL2RG, TRIM32, WDR54, CALML5, RABEP2, ZNF266, PTPN9, CSTA, LRRC38, CNFN, SH3BP5L, P4HA1, ENSG00000228863, VEPH1, HSD17B7, MAST4 | 0.529010 | 0.553860 | 0.045470 | 0.360270 |
| TRIM32, MSANTD3, NAT8L, CSTA, ENSG00000261408, SPOCK1, BOD1, CLEC10A, LIF, RPL26L1, CIITA, IL2RG, EZH1, ENSG00000245213, ADAP2, LTB, GPN1 | 0.625440 | 0.928520 | 0.928520 | 0.000350 |
| TRIM32, ENSG00000265206, ENSG00000261040, IL1RAP, RABEP2, SYT14, GAL3ST1, CNFN, ENSG00000258634, WDR54, LIF, SPOCK1, PSMC1, ENSG00000271870, PIK3C2B, ZNF697, ADAP2 | 0.637600 | 0.596900 | 0.600430 | 0.552850 |
| CIITA, BFAR, SMS, WDR54, GRIN3A, GPN1, CRIPAK, P2RY14, MTFMT, RASSF2, ENSG00000258634, SPINK5, MSANTD3, HMGA2, DOT1L, ZBED6CL, ZNF697 | 0.643950 | 0.270340 | 0.872530 | 0.322990 |
| HSD17B7, LIF, EZH1, SMS, PSMC1, WDR54, FOXN1, GABARAPL2, ZNF266, NEK6, SSR3, HMGA2, XPR1, OSGIN2, ALG2, SNX20, AHSG | 0.713340 | 0.078270 | 0.004130 | 0.000030 |
| EXPH5, TBC1D17, P2RY14, DENND2D, PSMC1, AQP1, RABEP2, CAMK2N1, ENSG00000212694, CRIPAK, ENSG00000271870, HMGA2, SPINK5, HSD17B7, ZBED6CL, LTB, ENSG00000265206 | 0.715320 | 0.883560 | 0.130070 | 0.925960 |
| ENSG00000261040, VEPH1, IL1RAP, AHSG, TRIM32, DOT1L, MAST4, CAMK2N1, LRRC38, SYT14, P4HA1, TBC1D17, CRIPAK, ZNF697, ENSG00000212694, RAB24, ADAP2 | 0.773310 | 0.214790 | 0.720550 | 0.196580 |
| ADAP2, SPINK5, P4HA1, ALG2, ZNF823, ARHGAP30, XPR1, CALML5, HMGA2, EXPH5, AREG, DOT1L, RABEP2, RASSF2, | 0.784390 | 0.944440 | 0.309290 | 0.874740 |
| RPL26L1, PPFIBP2, PLOD2, DOT1L, GABARAPL2, LTB, ZNF823, ICOS, SPINK5, PCF11, FOXN1, RASSF2, BOD1, NEK6, SRPX, ENSG00000261408, THBS1 | 0.876380 | 0.621280 | 0.000017 | 0.000650 |
| LTB, SPOCK1, BOD1, ALG2, CNFN, SRPX, OSGIN2, PCMT1, MTFMT, PSMC1, GPN1, CRIPAK, PIK3C2B, ARHGAP30, AHSG, AQP1, DOT1L | 0.936720 | 0.264460 | 0.022270 | 0.333580 |
| TRIM32, MTFMT, ENSG00000265206, PTPN9, XPR1, NEK6, TOMM34, ZNF266, DENND2D, NAT8L, RAB24, PLOD2, SPOCK1, | 0.963480 | 0.342870 | 0.004220 | 0.000067 |
HMGA2, ENSG00000245213, AQP1, LIF
Risk score and clinicopathological observations
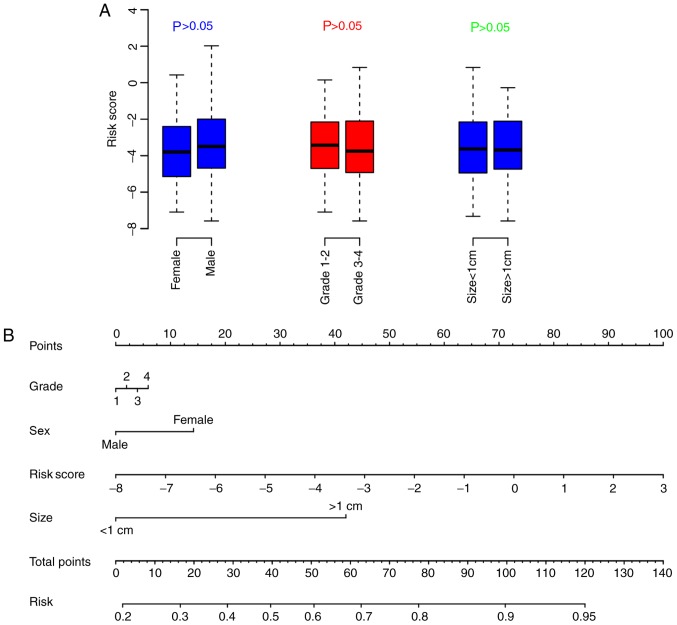
Association analyses between risk score and other clinical observations were performed in the largest dataset, TCGA-HNSC. The results revealed that the risk score was able to predict prognosis independently of sex, differentiation grade and primary tumor size (Fig. 4A), indicating that the risk score served as an independent prognostic indicator. To facilitate the utilization of the risk score and to evaluate its importance among clinical observations, a nomogram (Fig. 4B) for the 3-year OS rate was plotted, and it was demonstrated that the risk score was the most important predictor of the 3-year OS rate (range, 0–100). Taken together, the aforementioned results indicated that the 17 lncRNA-mRNA-based risk score is an independent clinical indicator and that it is more efficient in predicting survival than other clinical observations.
Figure 4.
Association between risk score and other clinical information. (A) The association between risk score and clinical information is not significantly different (P>0.05). (B) Nomogram for predicting mortality using the risk score and clinical information.
Risk score and radiation therapy
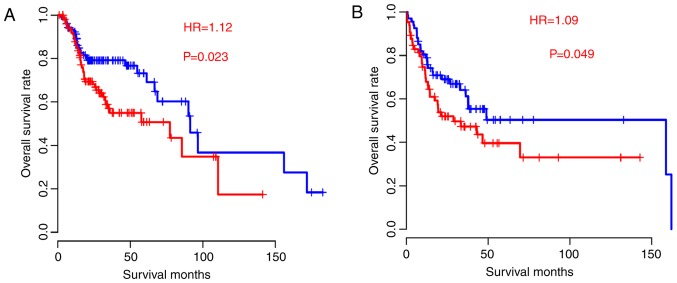
In the present study, patients were artificially divided into radiation-receiving and non-radiation-receiving groups. These groups were further divided into high-risk and low-risk groups based on their corresponding median risk score values. The high-risk group exhibited a significantly poorer survival rate in the radiation-receiving (Fig. 5A) and non-radiation-receiving groups (Fig. 5B), indicating that the risk score was a prognostic indicator independent to radiation therapy.
Figure 5.
Risk score and radiation therapy. Survival rate of high-risk patients who (A) did and (B) did not receive radiation therapy is shorter. HR, hazard ratio.
Discussion
In the present study, using the expression of lncRNAs and mRNAs and random forest variable hunting, a risk-score model was developed and was further validated in another three independent datasets. Furthermore, the risk score is independent of other clinicopathological observations and performs better at survival-prediction than other clinical characteristics.
The clinical outcome of HNSC carcinoma is affected by the heterogeneity of cancer, treatment method and surgery, the latter of which is controllable, while heterogeneity. Therefore, it is important to elucidate the molecular mechanisms underlying the heterogeneity of HNSC carcinoma (27). Clinically, HNSC may result from multiple causes, including smoking, HPV infection and diet, which makes the survival-prediction of HNSC difficult to determine using clinicopathological observations. Another indication of this heterogeneity is that no single gene was associated with survival in all datasets used in the present study. On the other hand, a multigene-based model is more robust in predicting prognosis, according to previous studies (24,28–31). lncRNAs and mRNAs are notable regulators of carcinogenesis and cancer development (32,33).
However, there are limitations to the present study. To begin with, owing to the retrospective nature of the study, important clinical indictors, including the resection margin of surgery and the drugs used during the therapeutic period, were not available. Secondly, although the risk score is an independent prognostic factor, pooled data were required to facilitate its utilization.
In summary, the 17 lncRNA-mRNA-based model is robust across different platforms and is a better survival predictor than other factors.
Acknowledgements
Not applicable.
Funding
The present study was supported by Zhejiang Provincial Health and Family Planning Commission (grant nos. 2015115433 and 201493689), Zhejiang Province Administration of Traditional Chinese Medicine (grant no. 2015ZA051), Department of education of Zhejiang province (grant no. Y201534803), and Zhejiang Science and Technology Department Public Welfare Fund Project (grant no. LGF18H160010).
Availability of data and materials
The datasets generated and/or analyzed during the current study are available from the Gene Expression Omnibus (https://www.ncbi.nlm.nih.gov/geo) and the ArrayExpress (http://www.ebi.ac.uk/arrayexpress/) websites.
Authors' contributions
ZLZ, LJZ, LX, LC, FW and YF conceived the study, participated in its design. ZLZ and YF drafted the manuscript. YPX and SHZ contributed to the acquisition of data, data analysis. All authors read and approved the final manuscript.
Ethics approval and consent to participate
Not applicable.
Patient consent for publication
Not applicable.
Competing interests
The authors declare that they have no competing interests.
References
- 1.Parkin DM, Bray F, Ferlay J, Pisani P. Global cancer statistics, 2002. CA Cancer J Clin. 2005;55:74–108. doi: 10.3322/canjclin.55.2.74. [DOI] [PubMed] [Google Scholar]
- 2.Chen W, Zheng R, Baade PD, Zhang S, Zeng H, Bray F, Jemal A, Yu XQ, He J. Cancer statistics in China, 2015. CA Cancer J Clin. 2016;66:115–132. doi: 10.3322/caac.21338. [DOI] [PubMed] [Google Scholar]
- 3.Katiyar SK. Emerging phytochemicals for the prevention and treatment of head and neck cancer. Molecules. 2016;21(pii):E1610. doi: 10.3390/molecules21121610. [DOI] [PMC free article] [PubMed] [Google Scholar]
- 4.de Andrade DA, Machiels JP. Treatment options for patients with recurrent or metastatic squamous cell carcinoma of the head and neck, who progress after platinum-based chemotherapy. Curr Opin Oncol. 2012;24:211–217. doi: 10.1097/CCO.0b013e3283510773. [DOI] [PubMed] [Google Scholar]
- 5.Pfister DG, Ang KK, Brizel DM, Burtness BA, Cmelak AJ, Colevas AD, Dunphy F, Eisele DW, Gilbert J, Gillison ML, et al. Head and neck cancers. J Natl Compr Canc Netw. 2011;9:596–650. doi: 10.6004/jnccn.2011.0053. [DOI] [PubMed] [Google Scholar]
- 6.Song W, Zou SB. Prognostic role of lncRNA HOTAIR in esophageal squamous cell carcinoma. Clin Chim Acta. 2016;463:169–173. doi: 10.1016/j.cca.2016.10.035. [DOI] [PubMed] [Google Scholar]
- 7.Chen Z, He A, Wang D, Liu Y, Huang W. Long noncoding RNA HOTTIP as a novel predictor of lymph node metastasis and survival in human cancer: A systematic review and meta-analysis. Oncotarget. 2017;8:14126–14132. doi: 10.18632/oncotarget.12981. [DOI] [PMC free article] [PubMed] [Google Scholar]
- 8.He A, Hu R, Chen Z, Liao X, Li J, Wang D, Lv Z, Liu Y, Wang F, Mei H. Role of long noncoding RNA UCA1 as a common molecular marker for lymph node metastasis and prognosis in various cancers: A meta-analysis. Oncotarget. 2017;8:1937–1943. doi: 10.18632/oncotarget.12463. [DOI] [PMC free article] [PubMed] [Google Scholar]
- 9.Chen J, Miao Z, Xue B, Shan Y, Weng G, Shen B. Long non-coding RNAs in urologic malignancies: Functional roles and clinical translation. J Cancer. 2016;7:1842–1855. doi: 10.7150/jca.15876. [DOI] [PMC free article] [PubMed] [Google Scholar]
- 10.Nohata N, Abba MC, Gutkind JS. Unraveling the oral cancer lncRNAome: Identification of novel lncRNAs associated with malignant progression and HPV infection. Oral Oncol. 2016;59:58–66. doi: 10.1016/j.oraloncology.2016.05.014. [DOI] [PMC free article] [PubMed] [Google Scholar]
- 11.Zou AE, Ku J, Honda TK, Yu V, Kuo SZ, Zheng H, Xuan Y, Saad MA, Hinton A, Brumund KT, et al. Transcriptome sequencing uncovers novel long noncoding and small nucleolar RNAs dysregulated in head and neck squamous cell carcinoma. RNA. 2015;21:1122–1134. doi: 10.1261/rna.049262.114. [DOI] [PMC free article] [PubMed] [Google Scholar]
- 12.Denaro N, Merlano MC, Russi EG, Lo Nigro C. Non coding RNAs in head and neck squamous cell carcinoma (HNSCC): A clinical perspective. Anticancer Res. 2014;34:6887–6896. [PubMed] [Google Scholar]
- 13.Xu CZ, Jiang C, Wu Q, Liu L, Yan X, Shi R. A feed-forward regulatory loop between HuR and the long noncoding RNA HOTAIR promotes head and neck squamous cell carcinoma progression and metastasis. Cell Physiol Biochem. 2016;40:1039–1051. doi: 10.1159/000453160. [DOI] [PubMed] [Google Scholar]
- 14.Zou AE, Zheng H, Saad MA, Rahimy M, Ku J, Kuo SZ, Honda TK, Wang-Rodriguez J, Xuan Y, Korrapati A, et al. The non-coding landscape of head and neck squamous cell carcinoma. Oncotarget. 2016;7:51211–51222. doi: 10.18632/oncotarget.9979. [DOI] [PMC free article] [PubMed] [Google Scholar]
- 15.Tian X, Xu G. Clinical value of lncRNA MALAT1 as a prognostic marker in human cancer: Systematic review and meta-analysis. BMJ Open. 2015;5:e008653. doi: 10.1136/bmjopen-2015-008653. [DOI] [PMC free article] [PubMed] [Google Scholar]
- 16.Jadaliha M, Zong X, Malakar P, Ray T, Singh DK, Freier SM, Jensen T, Prasanth SG, Karni R, Ray PS, Prasanth KV. Functional and prognostic significance of long non-coding RNA MALAT1 as a metastasis driver in ER negative lymph node negative breast cancer. Oncotarget. 2016;7:40418–40436. doi: 10.18632/oncotarget.9622. [DOI] [PMC free article] [PubMed] [Google Scholar]
- 17.Huang C, Yu Z, Yang H, Lin Y. Increased MALAT1 expression predicts poor prognosis in esophageal cancer patients. Biomed Pharmacother. 2016;83:8–13. doi: 10.1016/j.biopha.2016.05.044. [DOI] [PubMed] [Google Scholar]
- 18.Kong L, Zhou X, Wu Y, Wang Y, Chen L, Li P, Liu S, Sun S, Ren Y, Mei M, et al. Targeting HOTAIR induces mitochondria related apoptosis and inhibits tumor growth in head and neck squamous cell carcinoma in vitro and in vivo. Curr Mol Med. 2015;15:952–960. doi: 10.2174/1566524016666151123112716. [DOI] [PubMed] [Google Scholar]
- 19.Fayda M, Isin M, Tambas M, Guveli M, Meral R, Altun M, Sahin D, Ozkan G, Sanli Y, Isin H, et al. Do circulating long non-coding RNAs (lncRNAs) (LincRNA-p21, GAS 5, HOTAIR) predict the treatment response in patients with head and neck cancer treated with chemoradiotherapy? Tumour Biol. 2016;37:3969–3978. doi: 10.1007/s13277-015-4189-1. [DOI] [PubMed] [Google Scholar]
- 20.Chen H, Xin Y, Zhou L, Huang JM, Tao L, Cheng L, Tian J. Cisplatin and paclitaxel target significant long noncoding RNAs in laryngeal squamous cell carcinoma. Med Oncol. 2014;31:246. doi: 10.1007/s12032-014-0246-7. [DOI] [PubMed] [Google Scholar]
- 21.Lohavanichbutr P, Méndez E, Holsinger FC, Rue TC, Zhang Y, Houck J, Upton MP, Futran N, Schwartz SM, Wang P, Chen C. A 13-gene signature prognostic of HPV-negative OSCC: Discovery and external validation. Clin Cancer Res. 2013;19:1197–1203. doi: 10.1158/1078-0432.CCR-12-2647. [DOI] [PMC free article] [PubMed] [Google Scholar]
- 22.Cohen EE, Zhu H, Lingen MW, Martin LE, Kuo WL, Choi EA, Kocherginsky M, Parker JS, Chung CH, Rosner MR. A feed-forward loop involving protein kinase Calpha and microRNAs regulates tumor cell cycle. Cancer Res. 2009;69:65–74. doi: 10.1158/0008-5472.CAN-08-0377. [DOI] [PMC free article] [PubMed] [Google Scholar]
- 23.Tang Y, Xiang W, Terry L, Kretzschmar HA, Windl O. Transcriptional analysis implicates endoplasmic reticulum stress in bovine spongiform encephalopathy. PLoS One. 2010;5:e14207. doi: 10.1371/journal.pone.0014207. [DOI] [PMC free article] [PubMed] [Google Scholar]
- 24.Zhang ZL, Zhao LJ, Chai L, Zhou SH, Wang F, Wei Y, Xu YP, Zhao P. Seven lncRNA-mRNA based risk score predicts the survival of head and neck squamous cell carcinoma. Sci Rep. 2017;7:309. doi: 10.1038/s41598-017-00252-2. [DOI] [PMC free article] [PubMed] [Google Scholar]
- 25.Robin X, Turck N, Hainard A, Tiberti N, Lisacek F, Sanchez JC, Müller M. pROC: An open-source package for R and S+ to analyze and compare ROC curves. BMC Bioinformatics. 2011;12:77. doi: 10.1186/1471-2105-12-77. [DOI] [PMC free article] [PubMed] [Google Scholar]
- 26.Liu Q, Diao R, Feng G, Mu X, Li A. Risk score based on three mRNA expression predicts the survival of bladder cancer. Oncotarget. 2017;8:61583–61591. doi: 10.18632/oncotarget.18642. [DOI] [PMC free article] [PubMed] [Google Scholar]
- 27.Sawabe M, Ito H, Oze I, Hosono S, Kawakita D, Tanaka H, Hasegawa Y, Murakami S, Matsuo K. Heterogeneous impact of alcohol consumption according to treatment method on survival in head and neck cancer: A prospective study. Cancer Sci. 2017;108:91–100. doi: 10.1111/cas.13115. [DOI] [PMC free article] [PubMed] [Google Scholar]
- 28.Bou Samra E, Klein B, Commes T, Moreaux J. Development of gene expression-based risk score in cytogenetically normal acute myeloid leukemia patients. Oncotarget. 2012;3:824–832. doi: 10.18632/oncotarget.571. [DOI] [PMC free article] [PubMed] [Google Scholar]
- 29.Kim SK, Kim SY, Kim JH, Roh SA, Cho DH, Kim YS, Kim JC. A nineteen gene-based risk score classifier predicts prognosis of colorectal cancer patients. Mol Oncol. 2014;8:1653–1666. doi: 10.1016/j.molonc.2014.06.016. [DOI] [PMC free article] [PubMed] [Google Scholar]
- 30.Bou Samra E, Klein B, Commes T, Moreaux J. Identification of a 20-gene expression-based risk score as a predictor of clinical outcome in chronic lymphocytic leukemia patients. Biomed Res Int. 2014;2014:423174. doi: 10.1155/2014/423174. [DOI] [PMC free article] [PubMed] [Google Scholar]
- 31.Massari F, Bria E, Ciccarese C, Munari E, Modena A, Zambonin V, Sperduti I, Artibani W, Cheng L, Martignoni G, et al. Prognostic value of beta-tubulin-3 and c-Myc in muscle invasive urothelial carcinoma of the bladder. PLoS One. 2015;10:e0127908. doi: 10.1371/journal.pone.0127908. [DOI] [PMC free article] [PubMed] [Google Scholar]
- 32.Schmitt AM, Chang HY. Long noncoding RNAs in cancer pathways. Cancer Cell. 2016;29:452–463. doi: 10.1016/j.ccell.2016.03.010. [DOI] [PMC free article] [PubMed] [Google Scholar]
- 33.Weng M, Wu D, Yang C, Peng H, Wang G, Wang T, Li X. Noncoding RNAs in the development, diagnosis, and prognosis of colorectal cancer. Transl Res. 2017;181:108–120. doi: 10.1016/j.trsl.2016.10.001. [DOI] [PubMed] [Google Scholar]
Associated Data
This section collects any data citations, data availability statements, or supplementary materials included in this article.
Data Availability Statement
The datasets generated and/or analyzed during the current study are available from the Gene Expression Omnibus (https://www.ncbi.nlm.nih.gov/geo) and the ArrayExpress (http://www.ebi.ac.uk/arrayexpress/) websites.


