

Abstract
In the canonical STAT3 signaling pathway, IL-6 receptor engagement leads to the recruitment of latent STAT3 to the activated IL-6 complex and the associated Janus kinase (JAK) phosphorylates STAT3 at Y705. pSTAT3-Y705 dimers traffic into the nucleus and bind to specific DNA response elements in the promoters of target genes to regulate their transcription. However, IL-6 receptor activation induces the phosphorylation of both the Y705 and S727 residues of STAT3, and S727 phosphorylation is required to achieve maximal STAT3 transcriptional activity. STAT3 continuously shuttles between the nucleus and cytoplasm and maintains a prominent nuclear presence that is independent of Y705 phosphorylation. The constitutive nuclear entry of un-phosphorylated STAT3 (U-STAT3) drives expression of a second round of genes by a mechanism distinct from that used by pSTAT3-Y705 dimers. The abnormally elevated levels of U-STAT3 produced by the constitutive activation of pSTAT3-Y705 observed in many tumors drive the expression of an additional set of pSTAT3-independent genes that contribute to tumorigenesis. In this chapter, we describe the HCS assay methods to measure IL-6-induced STAT3 signaling pathway activation in head and neck tumor cell lines as revealed by the expression and subcellular distribution of pSTAT3-Y705, pSTAT3-S727, and U-STAT3. Only the larger dynamic range provided by the pSTAT3-Y705 antibody would be robust and reproducible enough for screening.
Keywords: STAT3 pathway activation, Head and neck cancer, High content screening, Imaging, Image analysis
1. Introduction
The Signal Transducer and Activator of Transcription 3 (STAT3) signaling pathway is hyper-activated in many cancers [1–5]. Activation of the canonical STAT3 pathway involves the phosphorylation of a conserved tyrosine residue (Y705) of the C-terminal transactivation domain (TAD) downstream of growth factor, cytokine, or G-protein-coupled (GPCRs) receptor ligand binding [5–13] (Fig. 1). Src family kinases (SFKs) can also phosphorylate STAT3-Y705 either directly or downstream of receptor tyrosine kinase or GPCR engagement [5, 7, 8, 10–12, 14]. After Y705 phosphorylation, pSTAT3-Y705 dimers traffic into the nucleus where they bind to specific DNA response elements in the promoters of target genes to regulate transcription [2,4, 5, 8–10] (Fig. 1). ElevatedpSTAT3-Y705 levels are often detected in tumor cell lines and are frequently associated with a poor clinical prognosis when observed in human tumor biopsy samples [1, 2,4, 6, 10,15]. Several STAT3 signaling pathway components that are commonly altered in many cancers result in elevated pSTAT3-Y705 expression levels; overexpression/ amplification of EGFRs, receptor tyrosine kinase (RTK) mutations that result in constitutive activation, overexpression/amplification of SFKs, and hyper-activating mutations of Janus kinases (JAKs) [4–6, 8–11, 13]. Increased levels of growth factors and cytokines, such as transforming growth factor alpha (TGFα) or interleukin-6 (IL-6), may also lead to inappropriate or sustained activation of the STAT3 pathway that in turn promotes tumor development and/or survival [1, 5, 10, 15, 16].
Fig. 1.
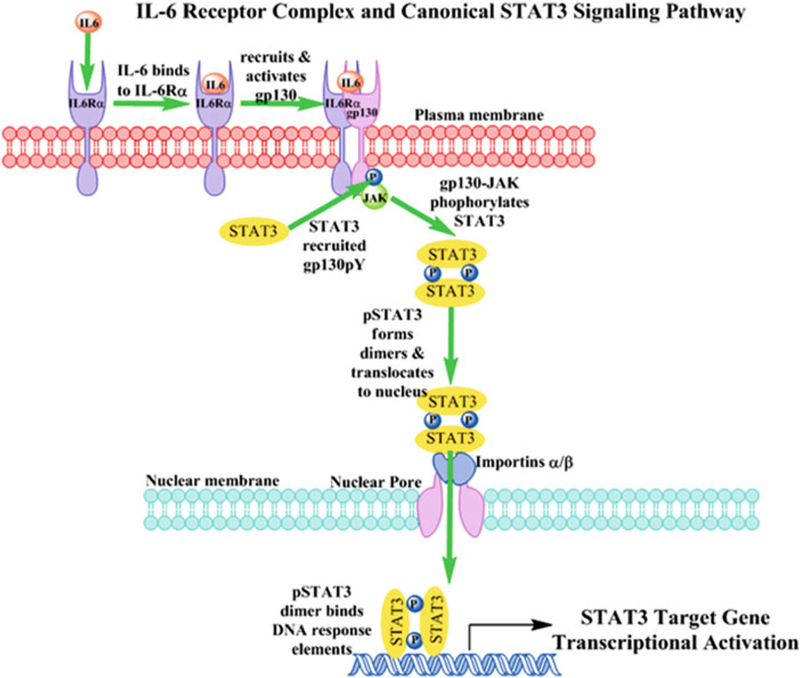
Interleukin-6 receptor complex activation and canonical STAT3 signaling pathway. Interleukin-6 (IL-6) first engages and binds to IL-6-receptor-α subunit (IL-6Rα, gp80) in the plasma membrane of cells and the IL-6-IL-6Rα complex then recruits the gp130 signaling subunit. The gp130 subunit and its constitutively associated Janus kinases (JAKs) are rapidly activated as indicated by the auto-phosphorylation and activation of the JAK together with phosphorylation of a number of tyrosine residues on gp130 (pYs 767, 814, 905 and 915). Latent STAT3 in the cytoplasm is recruited to specific pY docking sites on the gp130 subunits of IL-6-activated receptor complexes through interactions with the STAT3 SH domain. The associated JAK of the activated IL-6 receptor complex phosphorylates STAT3 at pY705. Reciprocal interactions between SH-2 domains of pSTAT3 monomers and the pY705 residue of another pSTAT3 partner lead to dimerization and translocation to the nucleus. Large protein complexes like activated pSTAT3-Y705 dimers may only enter the nucleus through the nuclear pore complex in a process facilitated by importin α and β proteins. pSTAT3-Y705 dimers interact with importins α5 and α7 and in conjunction with importin β these proteins mediate the entry of pSTAT3-Y705 through the nuclear pore. Inside the nucleus pSTAT3 dimers bind specific DNA response elements in the promoters of target genes to regulate their transcription
In addition to the canonical STAT3 signaling pathway depicted in Fig. 1, cytokine or growth factor stimulation also induces phosphorylation of a serine 727 (S727) residue in a conserved (LPMSP) sequence of the STAT3 C-terminal TAD [17–20]. The differential splice variant STAT3β lacks the C-terminal region that contains the LPMSP motif and exhibits markedly reduced transcriptional activity compared to wild-type STAT3α [18–20]. Overexpression of a STAT3 mutant in which S727 was mutated to A727 did not alter ligand-induced DNA binding, but dramatically reduced its transcriptional activity relative to wild-type STAT3 [18–20]. In contrast, overexpression of a STAT3 mutant in which S727 was mutated to an D727 did not affect either IL-6-induced STAT3 DNA binding or transcriptional activation, but transcriptional activation by this mutant was independent of Rac-1-mediated signal transduction and the MEKK-1 and MKK-4 kinases [18]. IL-6 receptor activation induces the phosphorylation of both the Y705 and S727 residues ofSTAT3 and produces a strong association with the p300 transcriptional coactivator [18]. Overexpression of p300 enhances the transcriptional activity of wild-type STAT3α but not the STAT3β isoform or the STAT3 S727A mutant, and the STAT3 S727D mutant forms a strong constitutive association with p300 [18]. Collectively, these data suggest that the p300 coactivator may be involved in the recruitment and assembly of the basal transcriptional machinery by pSTAT3-S727. While Y705 phosphorylation is obligatory for STAT3 dimerization, nuclear translocation, and DNA binding, S727 phosphorylation is required to achieve maximal STAT3 transcriptional activity [17–20].
The transcriptional activity of STAT3 also depends upon its ability to gain entry into the nucleus and to bind to specific DNA sequences [21–23]. The passage of large molecules between the cytoplasm and the nucleus is restricted and only proteins bearing appropriate nuclear localization signals (NLS) and/or nuclear export signals (NES) can be escorted through the nuclear pore complexes by the importin and exportin family of cargo transporters [21–23]. Unlike other members of the STAT family, STAT3 continuously shuttles between the nucleus and the cytoplasm and maintains a prominent nuclear presence that is independent of Y705 phosphorylation [22, 23]. While the constitutive nuclear entry of un-phosphorylated STAT3 (U-STAT3) is mediated by importin-α3 [22, 23], the nuclear-cytoplasmic shuttling of v-Src-activated pSTAT3-Y705 is mediated by importins α5 and α7 [21]. The STAT3 gene itself is one of the target genes activated by the IL-6-induced formation of pSTAT3-Y705 and the resulting increase in U-STAT3 drives expression of a second round of genes (RANTES, IL-6, IL-8, MET, and MRAS) that do not respond to pSTAT3-Y705 [24–26]. U-STAT3 drives gene expression by a mechanism distinct from that used by pSTAT3-Y705 dimers [24–26]. U-STAT3 competes with IκB for the un-phosphorylated NFκB (p65/p50, U-NFκB)) and the STAT3 NLS of the resulting U-STAT3::U-NFκB complexes promotes their accumulation in the nucleus where they active a subset of κB-responsive target genes [24–26]. The abnormally elevated levels of U-STAT3 produced by the constitutive activation of pSTAT3-Y705 observed in many tumors drive the expression of an additional set of pSTAT3-independent genes that contribute to tumorigenesis [24–26].
Head and neck cancer (HNC) is the eighth leading cause of cancer worldwide with a projected incidence of 540,000 new cases and 271,000 deaths per annum [27–29]. The front line therapies for HNC are surgical resection and chemo-radiotherapy. Surgical therapy can be disfiguring and there can be significant deleterious effects on swallowing, speech, and appearance. Radiation and chemotherapy treatment has produced limited improvement in prognosis and the 5-year survival rate for HNC has remained at 50% for over 30 years. There is, therefore, a need for new effective therapies. Elevated levels of activated STAT3 are frequently detected in HNC tumor samples and in head and neck squamous cell carcinoma cell lines used in mouse xenograft models that respond to STAT3 inhibition [4, 5, 7,10, 15, 30, 31]. STAT3 constitutively activated in an EGFR-independent manner by the autocrine/paracrine activation of the IL-6 receptor complex in HNSCC cells provides growth and survival benefits and may contribute to their resistance to EGFR-targeted therapies [16]. We recently described the development, optimization, and validation of high content imaging (HCS) assays to measure IL-6-induced pSTAT3-Y705 and interferon-gamma (IFNγ)-induced pSTAT1-Y701 levels in HNC cell lines [32], and used these phenotypic assays to screen for compounds that selectively inhibited STAT3 but not STAT1 path-way activation in HNSCC cells [33]. The IL-6-induced pSTAT3-Y705 and IFNγ-induced pSTAT1-Y701 HCS assays have subsequently been used to support the chemical lead optimization of hits that selectively inhibited STAT3 but not STAT1 pathway activation in HNSCC cells [33–35]. In this chapter, we describe the HCS assay method to measure IL-6-induced pSTAT3-Y705 activation, and because STAT3 S727 phosphorylation is required to achieve maximal STAT3 transcriptional activity and elevated levels of U-STAT3 drive the expression of genes that may contribute to tumorigenesis, we also describe methods to measure the expression and subcellular distribution of pSTAT3-S727 and U-STAT3.
Cal33 HNSCC cells that had been seeded into 384-well plates in serum containing medium were cultured overnight and then serum starved for 24 h prior to a 15 min treatment ±50 ng/mL IL-6. The cells were then fixed in 3.7% paraformaldehyde containing Hoechst, permeabilized with methanol, and then stained with the indicated primary anti-STAT3 antibodies and a FITC-conjugated anti-species secondary antibody. We then utilized the ImageXpress Ultra (IXU) confocal automated imaging platform to sequentially acquire images for the Hoechst (Ch 1) and FITC (Ch 2) fluorescent channels using a 20 × 0.45 NAELWD objective (Fig. 2). Fluorescent images of Hoechst stained nuclei from Cal33 cells acquired on the IXU were unaffected by treatment with IL-6 (Fig. 2a). In untreated Cal33 cells immuno-stained with a rabbit polyclonal antibody that recognizes total-STAT3 independently of its phosphorylation status, uniform STAT3 staining was observed throughout the cytoplasm and nuclear compartments in both gray-scale and color composite images (Fig. 2a, b). In Cal33 cells that had been exposed to IL-6 however, there was an apparent increase in STAT3 staining in the nuclear compartment even though STAT3 was also still apparent in the cytoplasm (Fig. 2a, b). In Cal33 cells immuno-stained with mouse monoclonal antibodies that recognize pSTAT3-Y705 or pSTAT3-S727, the indirect immuno-fluorescent staining was clearly higher in images acquired of Cal33 cells treated with IL-6 compared to those of un-stimulated cells (Fig. 2b). The color composite overlays of the Ch 1 and Ch 2 fluorescent images indicate that the increased immuno-fluorescent pSTAT3-Y705 and pSTAT3-S727 staining are predominantly localized within the nuclei of IL-6-treated Cal33 cells (Fig. 2b).
Fig. 2.

Images of IL-6-induced STAT3 signaling pathway activation. (a) Grayscale and color composite images of total-STAT3 in Cal33 Cells ± IL-6 treatment. 20 × grayscale images of Hoechst 33342 stained nuclei (Ch 1) and total-STAT3 staining (Ch 2) and the corresponding color composite images of non-stimulated and IL-6-treated (50 ng/mL,15 min) Cal33 HNSCC cells. (b) Color composite images of total STAT3, pSTAT3-Y705, and pSTAT3-S727 in Cal33 cells ± IL-6 treatment. 20× color composite images of Hoechst 33342 stained nuclei (Ch 1) and total STAT3, pSTAT3-Y705, and pSTAT3-S727 staining (Ch 2) of non-stimulated and IL-6-treated (50 ng/mL,15 min) Cal33 HNSCC cells. The ImageXpress Ultra (IXU) platform (Molecular Devices LLC, Sunnyvale, CA) is a fully integrated point-scanning confocal automated imaging platform configured with four independent solid-state lasers providing four excitation wavelengths of 405, 488, 561, and 635 nm. The IXU was equipped with a Quad filter cube providing emission ranges of 417–477, 496–580, 553–613, and 645–725 nm and four independent photomultiplier tubes (PMTs) each dedicated to a single detection wavelength. The IXU utilizes a dedicated high-speed infra-red laser auto-focus system, has a 4-position automated objective changer with air objectives (10×, 20×, 40×, and 60×), and the detection pinhole diameter of the confocal optics was configurable in the software. For the STAT3 HCS assays the IXU was set up to acquire two images using a 20× 0.45 NA ELWD objective in each of two fluorescent channels that were acquired sequentially. The Hoechst channel laser autofocus Z-offset was −6.98 μm, the 405 laser was set at 10% power, and the PMT gain was 550. The pSTAT3-Y705 FITC channel Z-offset from W1 (the Hoechst channel) was 12.96 μm, the 488 laser was set at 10% power, and the PMT gain was 625. On average, the IXU scanned a single 384-well plate, two images per channel, in 90 min using these settings. Similar settings were used to acquire images of total-STAT3 and pSTAT3-S727 immuno-staining
To extract and analyze quantitative data from these digital images, we used the translocation enhanced (TE) image analysis module of the MetaXpress software on the IXU platform (Fig. 3). Hoechst DNA-stained objects in Ch 1 that exhibited fluorescent intensities above a background threshold and had suitable morphology (width, length, and area) characteristics were classified by the TE image segmentation as nuclei and were used to create nuclear masks for each cell (Fig. 3a). The Ch 1 nuclear mask was then eroded 1 μm in from the edge of the detected nucleus and the reduced Ch 2 “inner” mask was established to quantify the target STAT3 Ch 2 fluorescence within the nucleus (Fig. 3a, light green and red). A Ch 2 “outer” cytoplasm mask was then established 1μm out from the edge of the Ch 1 detected nucleus and the width was set at 3 μm, to cover a region of the cytoplasm within the cell boundary (Fig. 3a, dark green and red). The Ch 2 “outer” mask was used to quantify the amount of target STAT3 fluorescence within this region of the cytoplasm (Fig. 3a). The TE image analysis module outputs quantitative individual cell or well-averaged data including the selected object or cell counts per image in Ch 1 (Fig. 3b), and the average fluorescent intensities of the STAT3 Ch 2 signal in the nucleus (Fig. 3c). While exposure to 50 ng/mL of IL-6 for 15 min had no significant effect on the cell counts per image (Fig. 3b), the average fluorescent intensities of nuclear total-STAT3, pSTAT3-Y705, and pSTAT3-S727 were higher in IL-6-treated Cal33 cells compared to untreated cells (Figs. 2b and 3c). Although IL-6 treatment induced increases in the average fluorescent intensities of total-STAT3 and pSTAT3-S727 in the nuclei of Cal33 cells by 50% and 45% respectively, the corresponding increase in nuclear pSTAT3-Y705 was much greater, typically >5-fold higher than in untreated cells (Figs. 2b and 3c). Based on the IL-6-induced assay signal windows of the three STAT3 antibodies (Fig. 3c), only the larger dynamic range provided by the pSTAT3-Y705 antibody would be robust and reproducible enough to use as a screening assay for inhibitors of STAT3 pathway activation.
Fig. 3.

Translocation enhanced image analysis module. (a) Translocation enhanced image segmentation. Hoechst 33342 was used to stain and identify the nuclei of Cal33 cells, and this fluorescent signal in the images of channel 1 (Ch 1) was used by the translocation enhanced (TE) image analysis module to define an “inner” nuclear mask and an “outer” cytoplasm mask in channel 2 (Ch 2). Hoechst stained objects in Ch 1 that exhibited fluorescent intensities above an established background threshold intensity value and had the suitable size (width, length, and area) characteristics were identified and classified by the image segmentation as nuclei. For Hoechst stained Cal33 cells the following settings typically proved effective; objects defined as nuclei had to exhibit fluorescent intensities >1500 gray levels over background, and they had to have an approximate width of 10 μm with a minimum area of 20 μm2, and did not exceed a maximum area of 1000 μm2. Objects with these criteria were used to create “inner” nuclear masks for each cell. The nuclear mask was eroded by 1 μm in from the edge of the detected nucleus to reduce cytoplasmic contamination within the nuclear area, and the reduced “inner” mask (light green or red) was used to quantify the amount of target channel (Ch 2) fluorescence (Total-STAT3, pSTAT3-S727, or pSTAT3-Y705) within the nucleus. The “outer” cytoplasm mask (dark green or red) was then established 1 μm out from the edge of the detected nucleus and width of the outer mask was set at 3 μm, to cover as much of the cytoplasm region as possible without going outside the cell boundary. The “outer” mask was used to quantify the amount of target Ch 2 fluorescence (Total-STAT3, pSTAT3-S727, or pSTAT3-Y705) within the cytoplasm. (b) Cell counts. The TE image analysis module outputs quantitative data including the average fluorescent intensities of the Hoechst stained objects in Ch 1, and the selected object or cell count in Ch 1. The average cell counts per image ± sd from 32 wells each for Cal33 cells ± IL-6 treatment are presented. (c) Nuclear STAT3 Intensity. The average fluorescent intensities of the Ch2 signals in the nuclear (inner) regions of Cal33 cells ± IL-6 stained with three different primary STAT3 antibodies are presented; Total-STAT3, pSTAT3-S727, and pSTAT3-Y705. The average inner STAT3 intensity ± sd from 32 wells each for Cal33 cells ± IL-6 treatment are presented. The IL-6-induced translocation of STAT3 from the cytoplasm to the nucleus is indicated by an increase in the average inner intensity parameter output by the translocation enhanced image analysis module
2. Materials
Methanol.
Formaldehyde.
Triton X-100.
Tween 20.
Hoechst 33342.
Dimethyl sulfoxide (DMSO) (99.9% high performance liquid chromatography-grade, under argon).
Recombinant human interleukin-6 (IL-6).
Mouse monoclonal anti-pSTAT3-Y705 primary antibody.
Mouse monoclonal ant-pSTAT3-S727 primary antibody.
Rabbit polyclonal anti-STAT3 antibody primary antibody.
Goat anti mouse-IgG conjugated with Alexa Fluor 488 secondary antibody.
Goat anti-rabbit-IgG conjugated with Alexa Fluor 488 secondary antibody.
Washing and antibody dilution buffer - Dulbecco’s Mg2+ and Ca2+ free phosphate buffered saline (PBS).
Blocking buffer—0.1% (v/v) Tween 20 in Mg2+ and Ca2+ free PBS.
Cal33 head and neck squamous cell carcinoma (HNSCC) cell line [36, 37].
Dulbecco’s Modified Eagle Medium (DMEM) with 2 mM l-glutamine supplemented with 10% fetal bovine serum, 100 μM nonessential amino acids, 100 μM sodium pyruvate, and 100 U/mL penicillin and streptomycin.
Trypsin 0.25%, 1 g/L EDTA solution (trypsin-EDTA).
Uncoated black walled clear-bottomed 384-well tissue culture-treated microtiter plates.
3. Methods
Aspirate spent tissue culture medium from Cal33 cells in tissue culture flasks that are <70% confluent (see Note 1), wash cell monolayers 1× with PBS, and expose cells to trypsin-EDTA until they detached from the surface of the tissue culture flasks. Add serum containing tissue culture medium to neutralize the trypsin. Transfer the cell suspension to a 50 mL capped sterile centrifuge tube and centrifuge at 500 × g for 5 min to pellet the cells. Resuspend cells in serum containing tissue culture medium and count the number of trypan blue excluding viable cells using a hemocytometer.
Use an automated bulk reagent dispenser to seed Cal33 HNSCC cells at 2000 cells per well in 45 μL of DMEM tissue culture medium into 384-well assay plates and culture cells overnight at 37 °C, 5% CO2, and 95% humidity (see Note 2).
Use an automated liquid handling platform to aspirate serum containing medium from Cal33 cell monolayers and to exchange with 45μL of serum free medium (SFM) twice and return the assay plates to an incubator at 37 °C, 5% CO2, and 95% humidity for 24 h (see Note 3).
Use an automated liquid handling platform to transfer 5 μL of compounds or controls pre-diluted in SFM to the wells of the assay plates (0.2% DMSO final), centrifuge the plates at 50 × g for 1–2 min, and return them to the incubator for 1–3 h at 37 °C, 5% CO2, and 95% humidity (see Note 4).
Use an automated liquid-handling platform to transfer 10 μL of IL-6 (50 ng/mL final) diluted in SFM to compound wells and maximum (Max) control wells, minimum (Min) control wells receive SFM, centrifuge the assay plate at 50 × g for 1–2min, and return to the incubator at 37 °C, 5% CO2, and 95% humidity for 15 min (see Note 5).
Use an automated bulk reagent dispenser to add 50 μL of pre-warmed (37 °C) 7.4% paraformaldehyde containing 2 μg/mL Hoechst 33342 to fix cells and stain nuclei (see Note 6).
After 30 min at room temperature use an automated plate washer-dispenser to aspirate the fixative and then wash the fixed cell monolayers 2× with PBS (see Note 7).
Use an automated plate washer-dispenser to aspirate the PBS and permeabilize the fixed cells by adding 50 μL of 95% ice-cold methanol and place the plates on ice for 30 min (see Note 8).
Use an automated plate washer-dispenser to aspirate the 95% methanol from the permeabilized cell monolayers, wash 2× with 50 μL of Tween 20 blocking buffer, and incubate the permeabilized cells in 50 μL of Tween 20 blocking buffer at room temperature for 15 min (see Note 9).
Aspirate the blocking buffer and using an automated bulk reagent dispenser add 25 μL of the primary antibody (mouse anti-pSTAT3-Y705, mouse anti-pSTAT3-S727, or rabbit anti-STAT3) diluted 1:100 in dilution in PBS to the wells of the 384-well assay plates and incubate the plate for 1 h in the dark at room temperature (see Note 10).
Use an automated plate washer-dispenser to aspirate the primary antibody solution and wash cell monolayers 2× with Tween 20 blocking buffer, and incubate the cells in 50 μL of Tween 20 blocking buffer at room temperature for 15 min (see Note 11).
Aspirate the blocking buffer and using an automated bulk reagent dispenser add 25 μL of secondary antibody (Goat anti-mouse-IgG conjugated with Alexa-488 or Goat anti-rabbit-IgG conjugated with Alexa-488) diluted 1:500 in PBS to the wells of the 384-well assay plates and incubate the plate for 45 min in the dark at room temperature (see Note 12).
Use an automated plate washer-dispenser to aspirate the secondary antibody and wash cell monolayers 2× with PBS, and seal assay plates with aluminum foil seals (see Note 13).
Acquire fluorescent images in two channels on an automated imaging platform (see Note 14). On the ImageXpress Ultra (IXU) confocal automated HCS platform, the images of the Hoechst (Ch1) and STAT3 (Ch2) channels are sequentially acquired using a 20× 0.45 NA objective, the 405 and 488 nm excitation laser lines, a Quad filter cube set, and individual PMTs for each channel (Fig. 2).
Analyze the acquired digital images using an appropriate image analysis algorithm to extract quantitative data (see Note 15). In our case, the images ofpSTAT3-Y705, pSTAT3-S727 and total STAT3 in Cal33 cells ± IL-6 treatment are analyzed using the Translocation Enhanced image analysis module of the MetaX-press™ software to analyze (Fig. 3).
4. Notes
Typically better responses are obtained when Cal33 cells are harvested from tissue culture flasks that are <70% confluent.
Optimizing the cell seeding density is a critical component of assay development for any cell-based assay, and perhaps most especially HCS assays [32, 38–43]. The objective is to find a balance between the efforts expended in cell culture support while making sure that sufficient numbers of cells are acquired per image to give statistical significance to the image analysis parameters of interest. Typically variability increases as the number of cells captured and analyzed decreases.
HNSCC cell lines have previously been shown to synthesize and secrete TGFα and IL-6 into a culture medium that can constitutively activate the STAT3 pathway in an autocrine or paracrine manner [7, 10, 15, 16, 32]. To control for potential autocrine/paracrine activation of the STAT3 signaling pathway, we introduced a medium exchange and serum starvation protocol [32]. The IL-6-induced assay signal window collapsed from >5-fold using this protocol to around twofold in Cal33 cells cultured “undisturbed” in a serum-containing medium, because un-stimulated pSTAT3-Y705 levels were higher and the response to IL-6 was smaller in a serum-containing medium [32].
Determining the DMSO tolerance of an assay is critical because together with the concentration of the screening library it limits the maximum compound concentration that can be tested. DMSO has two major effects on HCS assays [32, 38–43]; at concentrations >5% there is significant cell loss due to cytotoxicity and/or reduced cell adherence, and at concentrations >1% but <5%, cells change from a well-spread and well-attached morphology to a more rounded loosely attached morphology that interferes with the image analysis segmentation. An appropriate compound exposure period should be determined empirically for each new assay. Although compounds with poor cell permeability may benefit from extended compound exposure times, prolonged compound exposures can also produce significant levels of cytotoxicity that may reduce the reliability of measurements.
During the development HCS assays it is critical to define the concentration and time-dependent responses for stimuli that are used to activate signaling pathways or to induce cellular phenotypes [32, 38–43]. The time course of deactivation is equally important since signal stability has a direct impact on assay throughput and capacity. In situations where the stimulus is expensive or of limited availability, the dead volume of a bulk reagent dispenser may be prohibitive, and either a hand-held multichannel pipettor or liquid handler outfitted with a 384-well transfer head may be preferable for transferring the reagent to the assay plate.
The selection of cell fixation and nuclear staining protocols are important sample preparation/assay development parameters for end point HCS assays. Cell fixation methods need to preserve the biological features of interest and are required because scanning an assay plate may range anywhere from 10 to 15 min to 2–3 h per plate, depending upon the complexity of the image acquisition procedure. The excitation and emission spectra of the nuclear stain selected will impact a number of image acquisition parameters; light source, filter sets, detector settings, exposure times and which other fluorescent probes can be imaged. Combining cell fixation with nuclear staining in a single procedure saves time and reduces the number of protocol steps.
To reduce/control environmental exposure levels to formaldehyde, we recommend dispensing, aspirating, and washing assay plates on an automated plate dispenser-washer platform.
The selection of the cell permeabilization method can have a significant impact on the performance of HCS assays that use antibodies for indirect immuno-fluorescence. In our hands, cell permeabilization with 95% ice-cold methanol typically works best for phospho-specific antibodies, but we recommend that different cell permeabilization methods should be evaluated for each new antigen and/or antibody pair.
Blocking buffers are typically used to reduce or control non-specific antibody binding in indirect immuno-fluorescence assays and thereby lower the background staining. A variety of different components are typically incorporated into blocking buffers including bovine serum albumin, nonfat dry milk, fetal bovine serum, serum from the same species as the secondary antibody, or nonionic detergents like Tween 20. In our hands, 0.1% (v/v) Tween 20 in Mg2+ and Ca2+ free PBS works well as blocking buffer, and can also be used as the diluent for primary and secondary antibodies.
The selection of suitable primary antibodies, working dilutions, and incubation times needs to be empirically determined for each antigen and cell type. Typically, this process involves the pairwise cross titration testing of several different primary and secondary antibody pairs at a variety of different antibody dilutions, ranging from 1:50 for lower affinity antibodies all the way up to 1:2000 for higher affinity antibodies. The length of incubation for primary antibodies can be ≤1 h with higher affinity antibodies, or as long as overnight with lower affinity antibodies. In situations where the primary antibody is expensive or needs to be applied at lower dilutions, the dead volume of a bulk reagent dispenser may be prohibitive, and either a hand-held multichannel pipettor or liquid handler outfitted with a 384-well transfer head may be preferable for transferring the antibody to the assay plate.
Given the number and importance of the reagent addition, aspiration and washing steps involved in an indirect immune-fluorescence HCS assay protocol, the selection of an automated plate washer-dispenser platform is probably the most critical automation decision that impacts the performance of the assay.
There are many sources of anti-species-IgG fluorophore-conjugated antibodies and typically these higher affinity antibodies can be used at larger dilutions (≥ 1:500). Since nonspecific binding fluorophore-conjugated secondary antibodies can be a major component of background staining, some investigators use serum from the same species as the secondary antibody in their blocking buffers.
For the long-term storage of fixed and stained assay plates, we recommend aspirating the secondary antibody, washing the cell monolayers with PBS, adding PBS to the wells, and sealing the plates with adhesive foil seals for storage at 4 °C in the dark.
Although we have described the image acquisition process on the ImageXpress Ultra confocal platform, most automated imaging platforms designed for HCS should be capable of capturing these images.
Although we have described the translocation enhanced image analysis module of the MetaXpress™ software that is integrated with the IXU platform, most automated imaging systems designed for HCS provide similar image analysis algorithms that should be capable of analyzing these images.
Acknowledgments
This project has been funded in part with Federal Funds from the National Cancer Institute, National Institutes of Health, under Contract No. HSN261200800001E. The content of this publication does not necessarily reflect the views or policies of the Department of Health and Human Services, nor does mention of trade names, commercial products, or organizations imply endorsement by the U.S. Government.” NExT-CBC Project ID #1015, S08–221 Task Order 6 “STAT3 Pathway Inhibitor HCS” (Grandis, PI), NCI Chemical Biology Consortium, Pittsburgh Specialized Application Center (PSAC) (Lazo & Johnston, co-PIs). The project was also supported in part by funds from the American Cancer Society (Grandis) and a Head and Neck Spore P50 award (Grandis, CA097190).
References
- 1.Frank DA (2007) STAT3 as a central mediator of neoplastic cellular transformation. Cancer Lett 251:199–210 [DOI] [PubMed] [Google Scholar]
- 2.Germain D, Frank DA (2007) Targeting the cytoplasmic and nuclear functions of signal transducers and activators of transcription 3 for cancer therapy. Clin Cancer Res 13:5665–5669 [DOI] [PubMed] [Google Scholar]
- 3.Jing N, Tweardy DJ (2005) Targeting Stat3 in cancer therapy. Anti-Cancer Drugs 16:601–607 [DOI] [PubMed] [Google Scholar]
- 4.Johnston PA, Grandis JR (2011) STAT3 signaling: anticancer strategies and challenges. Mol Interv 11:18–26 [DOI] [PMC free article] [PubMed] [Google Scholar]
- 5.Quesnelle KM, Boehm AL, Grandis JR (2007) STAT-mediated EGFR signaling in cancer. J Cell Biochem 102:311–319 [DOI] [PubMed] [Google Scholar]
- 6.Aggarwal BB, Kunnumakkara AB, Harikumar KB, Gupta SR, Tharakan ST, Koca C, Dey S, Sung B (2009) Signal transducer and activator of transcription-3, inflammation, and cancer: how intimate is the relationship? Ann N Y Acad Sci 1171:59–79 [DOI] [PMC free article] [PubMed] [Google Scholar]
- 7.Egloff AM, Grandis JR (2009) Improving response rates to EGFR-targeted therapies for head and neck squamous cell carcinoma: candidate predictive biomarkers and combination treatment with Src inhibitors. J Oncol 2009:896407, 12 pages [DOI] [PMC free article] [PubMed] [Google Scholar]
- 8.Heinrich PC, Behrmann I, Müller-Newen G, Schaper F, Graeve L (1998) Interleukin-6-type cytokine signalling through the gp130/Jak/STAT pathway. Biochem J 334:297–314 [DOI] [PMC free article] [PubMed] [Google Scholar]
- 9.Heinrich PC, Behrmann I, Haan S, Hermanns HM,Müller-Newen G, Schaper F (2003) Principles of interleukin (IL)-6-type cytokine signaling and its regulation. Biochem J 374:1–20 [DOI] [PMC free article] [PubMed] [Google Scholar]
- 10.Leeman RJ, Lui VW, Grandis JR (2006) STAT3 as a therapeutic target in head and neck cancer. Expert Opin Biol Ther 6:231–241 [DOI] [PubMed] [Google Scholar]
- 11.Ram PT, Iyengar R (2001) G protein coupled receptor signaling through the Src and Stat3 pathway: role in proliferation and transformation. Oncogene 20:1601–1606 [DOI] [PubMed] [Google Scholar]
- 12.Silva CM (2004) Role ofSTATs as downstream signal transducers in Src family kinase-mediated tumorigenesis. Oncogene 23:8017–8023 [DOI] [PubMed] [Google Scholar]
- 13.Wilks AF (2008) The JAK kinases; not just another kinase drug discovery target. Semin Cell Dev Biol 19:319–328 [DOI] [PubMed] [Google Scholar]
- 14.Murray P (2007) The JAK-STAT signaling pathway: input and output integration. J Immunol 178:2632–2629 [DOI] [PubMed] [Google Scholar]
- 15.Seethala RR, Gooding WE, Handler PN, Collins B, Zhang Q, Siegfried JM, Grandis JR (2008) Immunohistochemical analysis of phos-photyrosine signal transducer and activator of transcription 3 and epidermal growth factor receptor autocrine signaling pathways in head and neck cancers and metastatic lymph nodes. Clin Cancer Res 14:1303–1309 [DOI] [PMC free article] [PubMed] [Google Scholar]
- 16.Sriuranpong V, Park JI, Amornphimoltham P, Patel V, Nelkin BD, Gutkind JS (2003) Epidermal growth factor receptor-independent constitutive activation of STAT3 in head and neck squamous cell carcinoma is mediated by the autocrine/paracrine stimulation of the interleukin 6/gp130 cytokine system. Cancer Res 63:2948–2956 [PubMed] [Google Scholar]
- 17.Lufei C, Koh TH, Uchida T, Cao X (2007) Pin1 is required for the Ser727 phosphorylation-dependent Stat3 activity. Oncogene 26:7656–7664 [DOI] [PubMed] [Google Scholar]
- 18.Schuringa J, Schepers H, Vellenga E, Kruijer W (2001) Ser727-dependent transcriptional activation by association of p300 with STAT3 upon IL-6 stimulation. FEBS Lett 495:71–76 [DOI] [PubMed] [Google Scholar]
- 19.Wen Z, Zhong Z, Darnell JE Jr (1995) Maximal activation of transcription by Stat1 and Stat3 requires both tyrosine and serine phosphorylation. Cell 82:241–250 [DOI] [PubMed] [Google Scholar]
- 20.Wen Z, Darnell JE Jr (1997) Mapping of Stat3 serine phosphorylation to a single residue (727) and evidence that serine phosphorylation has no influence on DNA binding of Stat1 and Stat3. Nucleic Acids Res 25:2062–2067 [DOI] [PMC free article] [PubMed] [Google Scholar]
- 21.Herrmann A, Vogt M, Mönnigmann M, Clahsen T, Sommer U, Haan S, Poli V, Heinrich PC, Müller-Newen G (2007) Nucleocytoplasmic shuttling of persistently activated STAT3. J Cell Sci 120:3249–3261 [DOI] [PubMed] [Google Scholar]
- 22.Liu L, McBride KM, Reich NC (2005) STAT3 nuclear import is independent of tyrosine phosphorylation and mediated by importin-alpha3. Proc Natl Acad Sci USA 102:8150–8155 [DOI] [PMC free article] [PubMed] [Google Scholar]
- 23.Reich N, Liu L (2006) Tracking STAT nuclear traffic. Nat Rev Immunol 6:602–612 [DOI] [PubMed] [Google Scholar]
- 24.Yang J, Chatterjee-Kishore M, Staugaitis SM, Nguyen H, Schlessinger K, Levy DE, Stark GR (2005) Novel roles of unphosphorylated STAT3 in oncogenesis and transcriptional regulation. Cancer Res 65:939–947 [PubMed] [Google Scholar]
- 25.Yang J, Stark GR (2008) Roles of unphosphorylated STATs in signaling. Cell Res 18:443–451 [DOI] [PubMed] [Google Scholar]
- 26.Ynag J, Liao X, Agarwal MK, Barnes L, Auron PE, Stark GR (2010) Unphosphorylated STAT3 accumulates in response to IL-6 and activates transcription by binding to NFkB. Genes Dev 21:1396–1408 [DOI] [PMC free article] [PubMed] [Google Scholar]
- 27.Brockstein B (2011) Management of recurrent head and neck cancer: recent progress and future directions. Drugs 71:1551–1559 [DOI] [PubMed] [Google Scholar]
- 28.Goerner M, Seiwert TY, Sudhoff H (2010) Molecular targeted therapies in head and neck cancer—an update of recent developments. Head Neck Oncol 2:8–12 [DOI] [PMC free article] [PubMed] [Google Scholar]
- 29.Stransky N, Egloff AM, Tward AD, Kostic AD, Cibulskis K, Sivachenko A, Kryukov GV, Lawrence MS, Sougnez C, McKenna A, Shefler E, Ramos AH, Stojanov P, Carter SL, Voet D, Cortés ML, Auclair D, Berger MF, Saksena G, Guiducci C, Onofrio RC, Parkin M, Romkes M, Weissfeld JL, Seethala RR, Wang L, Rangel-Escareño C, Fernandez-Lopez JC, Hidalgo-Miranda A, Melendez-Zajgla J, Winckler W, Ardlie K, Gabriel SB, Meyerson M, Lander ES, Getz G, Golub TR, Garraway LA, Grandis JR (2012) The mutational landscape of head and neck squamous cell carcinoma. Science 333:1157–1160 [DOI] [PMC free article] [PubMed] [Google Scholar]
- 30.Boehm AL, Sen M, Seethala R, Gooding WE, Freilino M, Wong SM, Wang S, Johnson DE, Grandis JR(2008) Combined targeting of epidermal growth factor receptor, signal transducer and activator of transcription-3, and Bcl-X(L) enhances antitumor effects in squamous cell carcinoma of the head and neck. Mol Pharmacol 73:1632–1642 [DOI] [PMC free article] [PubMed] [Google Scholar]
- 31.Leeman-Neill RJ, Wheeler SE, Singh SV, Thomas SM, Seethala RR, Neill DB, Panahan- deh MC, Hahm ER, Joyce SC, Sen M, Cai Q, Freilino ML, Li C, Johnson DE, Grandis JR (2009) Guggulsterone enhances head and neck cancer therapies via inhibition of signal transducer and activator of transcription-3. Carcino-genesis 30:1848–1856 [DOI] [PMC free article] [PubMed] [Google Scholar]
- 32.Johnston P, Sen M, Hua Y, Camarco D, Shun TY, Lazo jS, Grandis JR(2014) High-content pSTAT3/1 imaging assays to screen for selective inhibitors of STAT3 pathway activation in head and neck cancer cell lines. Assay Drug Dev Technol 12:55–79 [DOI] [PMC free article] [PubMed] [Google Scholar]
- 33.Johnston P, Sen M, Hua Y, Camarco DP, Shun TY, Lazo jS, Wilson GM, Resnick LO, LaPorte MG, Wipf P, Huryn DM, Grandis JR (2015) HCS campaign to identify selective inhibitors of IL-6-induced STAT3 pathway activation in head and neck cancer cell lines. Assay Drug Dev Technol 13:356–376 [DOI] [PMC free article] [PubMed] [Google Scholar]
- 34.LaPorte M, da Paz Lima DJ, Zhang F, Sen M, Grandis JR, Camarco D, Hua Y, Johnston PA, Lazo JS, Resnick LO, Wipf P, Huryn DM (2014) 2-Guanidinoquinazolines as new inhibitors of the STAT3 pathway. Bioorg Med Chem Lett 24:5081–5085 [DOI] [PMC free article] [PubMed] [Google Scholar]
- 35.LaPorte M, Wang Z, Colombo R, Garzan A, Peshkov VA, Liang M, Johnston PA, Schurdak ME, Sen M, Camarco DP, Hua Y, Pollock NI, Lazo JS, Grandis JR, Wipf P, Huryn DM (2016) Optimization of pyrazole-containing 1,2,4-triazolo-[3,4-b]thiadiazines, a new class of STAT3 pathway inhibitors. Bioorg Med Chem Lett 26:3581–3585 [DOI] [PMC free article] [PubMed] [Google Scholar]
- 36.Bauer V, Hieber L, Schaeffner Q, Weber J, Braselmann H, Huber R, Walch A, Zitzelsberger H (2010) Establishment and molecular cytogenetic characterization of a cell culture model of head and neck squamous cell carcinoma (HNSCC). Genes 1:338–412 [DOI] [PMC free article] [PubMed] [Google Scholar]
- 37.Gioanni J, Fischel JL, Lambert JC, Demard F, Mazeau C, Zanghellini E, Ettore F, Formento P, Chauvel P, Lalanne CM et al. (1988) Two new human tumor cell lines derived from squamous cell carcinomas of the tongue: establishment, characterization and response to cytotoxic treatment. Eur J Cancer Clin Oncol 24:1445–1455 [DOI] [PubMed] [Google Scholar]
- 38.Dudgeon D, Shinde SN, Shun TY, Lazo JS, Strock CJ, Giuliano KA, Taylor DL, Johnston PA, Johnston PA (2010) Characterization and optimization of a novel protein-protein interaction biosensor HCS assay to identify disruptors of the interactions between p53 and hDM2. Assay Drug Dev Technol 8:437–458 [DOI] [PMC free article] [PubMed] [Google Scholar]
- 39.Johnston PA, Shinde SN, Hua Y, Shun TY, Lazo JS, Day BW (2012) Development and validation of a high-content screening assay to identify inhibitors of cytoplasmic dynein-mediated transport of glucocorticoid receptor to the nucleus. Assay Drug Dev Technol 10:432–456 [DOI] [PMC free article] [PubMed] [Google Scholar]
- 40.Nickischer D, Laethem C, Trask OJ Jr et al. (2006) Development and implementation of three mitogen-activated protein kinase (MAPK) signaling pathway imaging assays to provide MAPK module selectivity profiling for kinase inhibitors: MK2-EGFP translocation, c-Jun, and ERK activation. Methods Enzymol 414:389–418 [DOI] [PubMed] [Google Scholar]
- 41.Trask O, Nickischer D, Burton A, Williams RG, Kandasamy RA, Johnston PA, Johnston PA (2009) High-throughput automated confocal microscopy imaging screen of a kinase-focused library to identify p38 mitogen-activated protein kinase inhibitors using the GE InCell 3000 analyzer. Methods Mol Biol 565:159–186 [DOI] [PubMed] [Google Scholar]
- 42.Trask OJ Jr, Baker A, Williams RG et al. (2006) Assay development and case history of a 32K-biased library high-content MK2-EGFP translocation screen to identify p38 mitogen-activated protein kinase inhibitors on the ArrayScan 3.1 imaging platform. Methods Enzymol 414:419–439 [DOI] [PubMed] [Google Scholar]
- 43.Williams RG, Kandasamy R, Nickischer D et al. (2006) Generation and characterization of a stable MK2-EGFP cell line and subsequent development of a high-content imaging assay on the Cellomics ArrayScan platform to screen for p38 mitogen-activated protein kinase inhibitors. Methods Enzymol 414:364–389 [DOI] [PubMed] [Google Scholar]