Abstract
T cells become dysfunctional when they encounter self antigens or are exposed to chronic infection or to the tumour microenvironment1. The function of T cells is tightly regulated by a combinational co-stimulatory signal, and dominance of negative co-stimulation results in T cell dysfunction2. However, the molecular mechanisms that underlie this dysfunction remain unclear. Here, using an in vitro T cell tolerance induction system in mice, we characterize genome-wide epigenetic and gene expression features in tolerant T cells, and show that they are distinct from effector and regulatory T cells. Notably, the transcription factor NR4A1 is stably expressed at high levels in tolerant T cells. Overexpression of NR4A1 inhibits effector T cell differentiation, whereas deletion of NR4A1 overcomes T cell tolerance and exaggerates effector function, as well as enhancing immunity against tumour and chronic virus. Mechanistically, NR4A1 is preferentially recruited to binding sites of the transcription factor AP-1, where it represses effector-gene expression by inhibiting AP-1 function. NR4A1 binding also promotes acetylation of histone 3 at lysine 27 (H3K27ac), leading to activation of tolerance-related genes. This study thus identifies NR4A1 as a key general regulator in the induction of T cell dysfunction, and a potential target for tumour immunotherapy.
T cell tolerance maintains T cell unresponsiveness to self tissues to avoid autoimmune diseases. Activation versus tolerance of T cells is determined by a combinational signal consisting of both positive co-stimulation and negative co-inhibition2–4. Dominant co-inhibitory signals induce T cell tolerance1,5. Moreover, higher expression of co-inhibitory receptors, including PD-1, programmes CD8+ T cells to become dysfunctional or exhausted in cancer or chronic viral infection1,5. However, the epigenetic and transcriptional regulation that underlies T cell dysfunction remains elusive.
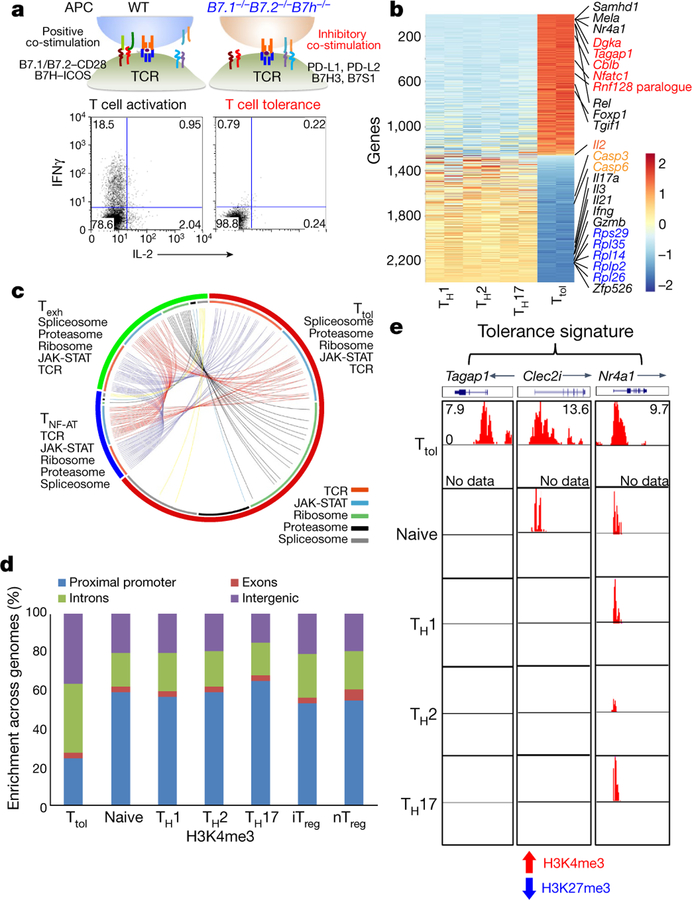
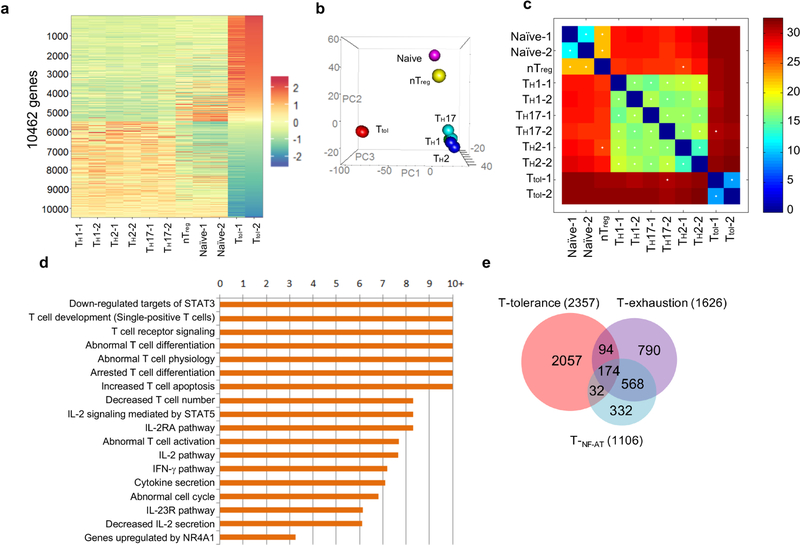
To address this, we generated tolerant T (Ttol) cells from mice using our previously reported in vitro system2, and carried out a genome-wide transcriptomic and epigenetic assessment on these cells (Fig. 1a). Gene expression analysis revealed that Ttol cells were distinct from other T cell subpopulations including in vitro-differentiated helper T (TH1, TH2 and TH17), natural regulatory T (nTreg) (also known as thymus-derived T; nTreg) and naive T cells (Extended Data Fig. 1a–c). A total of 2,357 genes were uniquely expressed in Ttol cells (Fig. 1b and Supplementary Table 1)—a change of twofold in comparison with TH1, TH2 and TH17 cell subpopulations. Specifically, anergy-related genes (Cblb, Dgka, Rnf149, Tagap1 and Nfatc1) and transcriptional repressors (Rel, Foxp1 and Tgif1) were greatly upregulated in Ttol cells, whereas the expression of effectors (Il2, Ifng, Gzmb, Il17a and Il21) and translational components (ribosomal genes such as Rps29, Rpl35, Rpl14, Rplp2 and Rpl26) were substantially decreased (Fig. 1b), indicating a quiescent state in these cells. Ingenuity pathway analysis (IPA) displayed a close association of T cell tolerance with abnormal T cell differentiation, as well as with the IL-2/STAT5 signalling axis and with NR4A1-regulated transcriptional changes (Extended Data Fig. 1d). When we compared the Ttol transcriptome with other dysfunctional T cell types including chronic virus-induced exhausted CD4+ T (Texh) cells (1,626 differentially expressed genes in Texh cells compared with effector T cells) and NF-AT1-overexpressed anergic CD4+ T (TNF-AT) cells (1,106 differentially expressed genes in TNF-AT compared with the control group)6,7, we found that 174 genes were shared among these three T cell populations (Extended Data Fig. 1e, and Supplementary Tables 1 and 2). Notably, genes associated with the dysregulation of the T cell receptor (TCR) and JAK-STAT signalling pathways showed the greatest overlap among Ttol, Texh and TNF-AT cells, whereas genes involved in ribosome-, proteasome-, and spliceosome-related pathways were altered to a larger extent in Ttol cells (Fig. 1c).
Fig. 1. Ttol cells exhibit distinct transcriptional and epigenetic features.
a, Experimental strategy for generating activated or tolerant T cells in vitro. WT, wild type. b, Heatmap of 2,357 genes for four groups of T cells (TH1, TH2, TH17 and Ttol). The colour coding indicates the expression level of 2,357 genes, with 0 as the median (gene expression level standardized by z-score). c, Circos plots showing overlapping genes in five gene modules from Ttol, TNF-AT and Texh cells. Line connections indicate shared genes between groups. d, Comparison of global distribution of H3K4me3 modifications at promoter, exon, intron and intergenic regions among Ttol, naive, TH1, T H2, TH17, iTreg and nTreg cells. e, Histone modifications of H3K4me3 and H3K27me3 in the Ttol cell-related genes Tagap1, Clec2i and Nr4a1, among Ttol, naive, TH1, TH 2 and TH17 cells. Experiments or analyses were independently repeated twice with similar results (a, d, e).
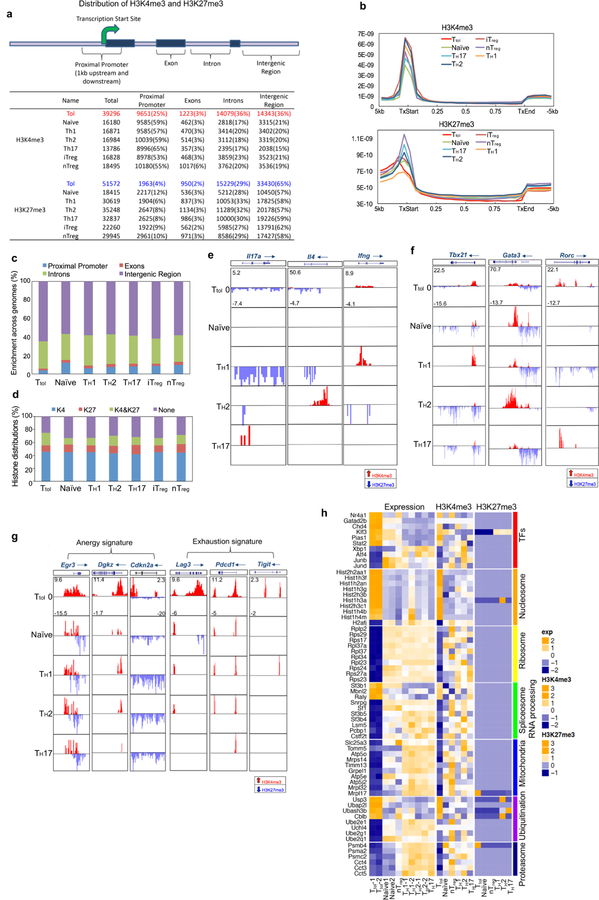
We next examined the histone modification status in Ttol cells (Extended Data Fig. 2a). Trimethylation of Lys4 on histone 3 (H3K4me3), which is a marker of actively transcribed genes, showed clear differences between Ttol cells and other T cell subsets including TH1, TH2, TH17, nTreg, induced regulatory T (iTreg) and naive T cells. Only 25% of H3K4me3 islands were located near transcription start sites (TSSs) in Ttol cells, compared with 53–65% in other T cell subsets8 (Fig. 1d and Extended Data Fig. 2a). These findings are consistent with a recent observation that chromatin accessibility was reduced at TSS regions in Texh cells9. By contrast, H3K27me3 occupancy at TSSs was negligibly altered among T cell subsets (Extended Data Fig. 2b, c). We further quantified H3K4me3 and H3K27me3 modifications for each gene, and revealed that the percentage of genes associated with dual modifications of H3K4me3 and H3K27me3 was higher in Ttol cells than in other T cell types (Extended Data Fig. 2d). Visualization of gene loci showed that in Ttol cells, lineage-specific effectors (Ifng, Il4 and Il17a) and transcription factors (Tbx21, Gata3 and Rorc) were marked by low levels or absence of H3K4me3 and H3K27me3—consistent with their transcriptional silence. Conversely, anergy-associated genes (Egr3, Dgkz and Cdkn2a), as well as exhaustion-related genes (Lag3, Pdcd1 and Tigit), displayed higher levels of H3K4me3 (Extended Data Fig. 2e–g and Supplementary Table 1)10–14, verifying that the signatures of T cell tolerance, anergy and exhaustion share common features15. Notably, Tagap1, Clec2i and Nr4a1, which were identified as tolerance-related genes based on their transcript levels in Ttol cells, showed increased H3K4me3 signals (Fig. 1e and Supplementary Table 1). Integration of our epigenetic and transcriptome data showed that 112 genes were upregulated and marked with overall permissive histone modifications in Ttol cells, whereas 228 genes were downregulated and displayed repressive histone modifications (Supplementary Table 3). Seven modules were categorized (Extended Data Fig. 2h). Ribosome-, mitochondria-and proteasome-related genes were suppressed in Ttol cells, and changes in the expression of genes encoding transcription factors or proteins involved in the ubiquitination pathway (upregulation, Nr4a1 and Gatad2b; downregulation, AP-1 subunits Junb and Jund) were also observed (Extended Data Fig. 2h). Collectively, these results show that CD4+ tolerant T cells display distinct gene expression and epigenetic changes compared with other T cell types.
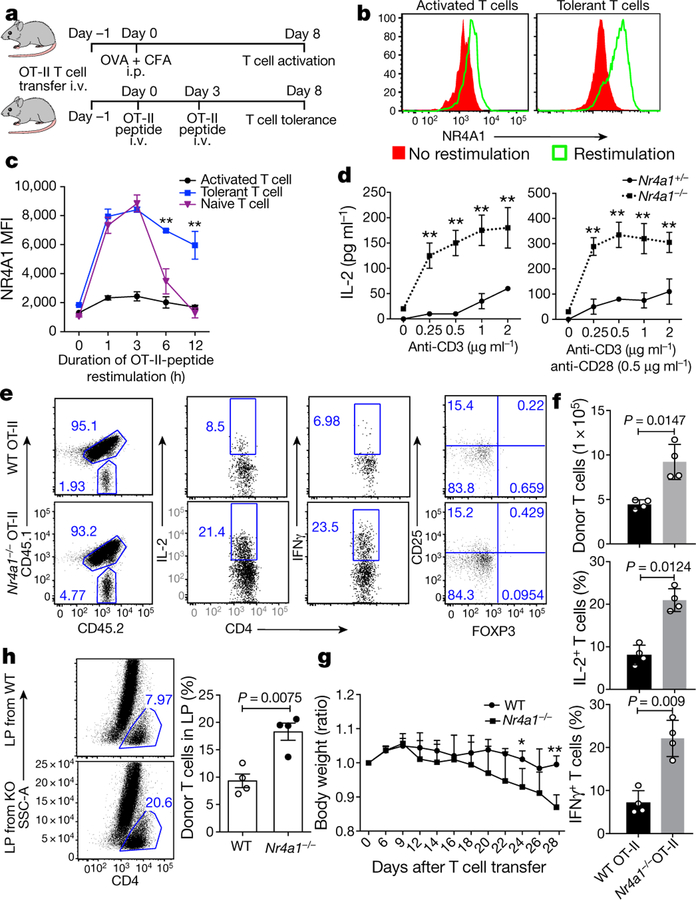
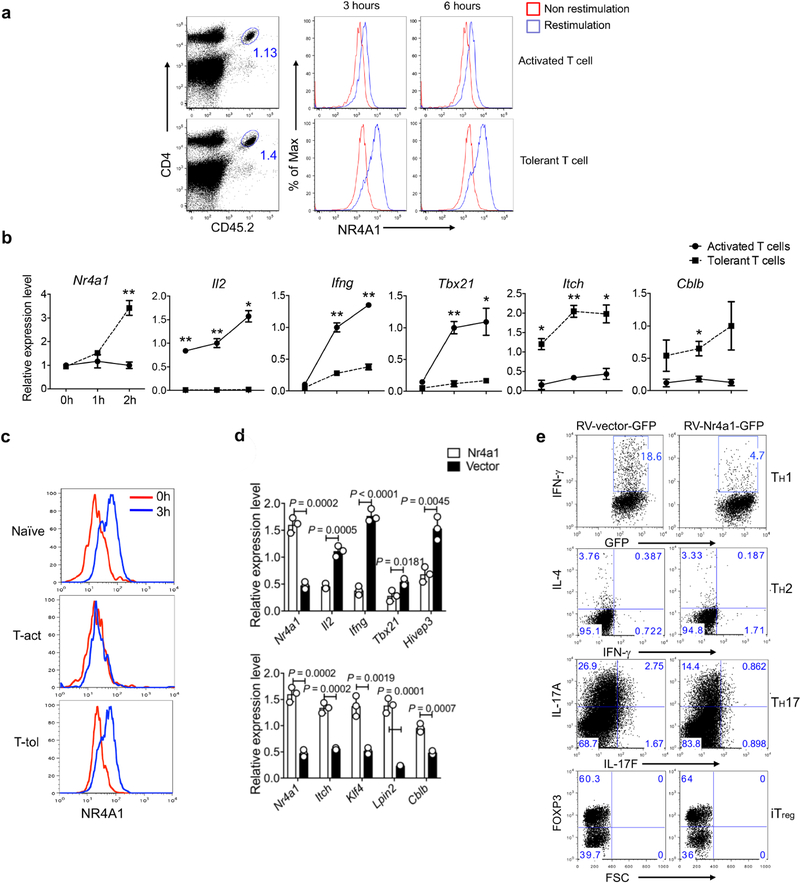
Our transcriptome analysis above identified specific upregulation of the transcription factor NR4A1 in Ttol cells. To investigate this further, we examined NR4A1 expression in in vivo-generated Ttol cells16 (Fig. 2a–c and Extended Data Fig. 3a–c). We observed a transcriptional reduction of Il2, Ifng and Tbx21, and an increase in Cblb and Itch mRNA expression, confirming the upregulation of NR4A1. In contrast with activated and naive T cells, a substantial amount of NR4A1 was stably expressed in Ttol cells after restimulation either with anti-CD3 antibody or with antigen-presenting cells (APCs) loaded with chicken ovalbumin (OVA) residues 323–339 (OT-II peptide) (Fig. 2b, c and Extended Data Fig. 3a). We next overexpressed NR4A1 in CD4+ T cells and found that Il2, Ifng, Tbx21 and Hivep3 (which is a coactivator for IL-2 production)17 were strongly suppressed, whereas the expression of anergy-related genes Cblb, Itch and Klf4 was increased, compared with control vector-transduced T cells (Extended Data Fig. 3d). Under TH cell polarizing conditions, enforced NR4A1 expression severely impaired both TH1 and TH17 cell differentiation, but no appreciable changes were observed in iTreg and TH2 cells (Extended Data Fig. 3e). In addition, overexpression of NR4A1 inhibited IFNγ expression in CD8+ T cells (data not shown). Furthermore, a loss-of-function assessment showed that ablation of NR4A1 resulted in a considerable enhancement of IL-2 and/or IFNγ production in both CD4+ and CD8+ T cells (Fig. 2d and Extended Data Fig. 4a, b), as well an increase in cell expansion (data not shown).
Fig. 2. NR4A1 is required for T cell tolerance formation.
a, Experimental strategy for OT-II peptide-induced CD4+ T cell tolerance in vivo. CFA, complete Freund’s adjuvant; i.p., intraperitoneally; i.v., intravenously. b, Flow cytometry measurement of NR4A1 expression in sorted donor-derived T cells after restimulation with OT-II peptide-loaded APCs for 3 h. c, Quantification of NR4A1 expression (mean fluorescence intensity; MFI) in naive T cells and donor-derived T cells from both activated and tolerant groups, after restimulation with OT-II peptide-loaded APCs. d, ELISA measurement of IL-2 from Nr4a1+/− and Nr4a1−/− CD4+ T cells activated either by anti-CD3 alone or by anti-CD3 and anti-CD28 in a dosage-dependent manner. e, Flow cytometry analysis of IFNγ, IL-2 and FOXP3 expression in wild-type and Nr4a1−/− OT-II T cells in spleens in the context of peptide-induced tolerance. f , Quantification of donor-derived wild-type and Nr4a1−/ − OT-II T cells. g, Body weight measurement (shown as ratio compared with original body weight) of Rag1−/− mice after receiving wild-type or Nr4a1/−/− naive CD4+ CD45RBhi T cells. h, Flow cytometry analysis of donor-derived T cells in lamina propria (LP) four weeks after T cell transfer. KO, knockout. Eight-week-old mice; n = 3 (c, d); n = 4 (f–h). *P < 0.05, **P < 0.01 (two-sided unpaired Student’s t-test). Data are representative of at least two individual experiments and are presented as mean ± s.d.
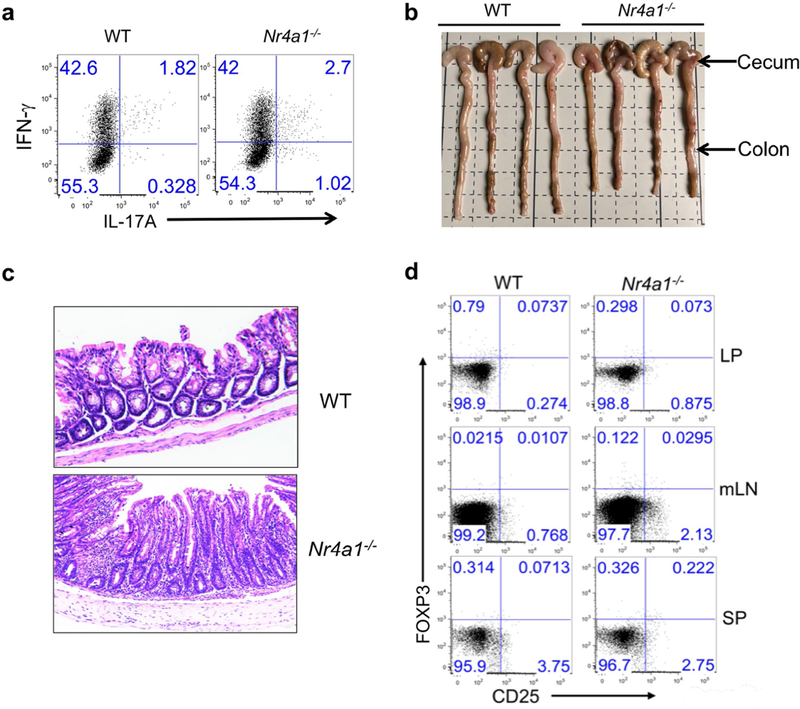
We then examined whether NR4A1 is required for the induction of T cell tolerance in vivo. In an oral tolerance or a peptide-induced tolerance model16,18, NR4A1 deficiency blocked the formation of T cell tolerance, and enhanced the production of IL-2 and IFNγ (Extended Data Fig. 4c, Fig. 2e, f). By contrast, no appreciable change was evident in Foxp3+ Treg populations (Fig. 2e and data not shown). These results suggested a conventional T cell-intrinsic function of NR4A1 in T cell tolerance. We also generated chimeric mice reconstituted with wild-type and Nr4a1−/− bone marrow cells, which demonstrated that NR4A1 deficiency did not affect Treg cell development or homeostasis (Extended Data Fig. 4d)—consistent with previous work that found that NR4A1 was dispensable in the control of these processes19. Furthermore, we investigated whether NR4A1 is involved in T cell-mediated colitis, by transferring Nr4a1−/− CD4+ T cells into Rag1−/− mice. Mice transduced with Nr4a1−/− T cells exhibited more severe weight loss and colon inflammation than those with wild-type cells, and twice as many IL-17A-and IFNγ-producing T cells were detected in colon lamina propria from Nr4a1−/− T cell-bearing mice (Fig. 2g, h and Extended Fig. 5a–d). Altogether, our findings indicate that NR4A1 controls T cell tolerance.
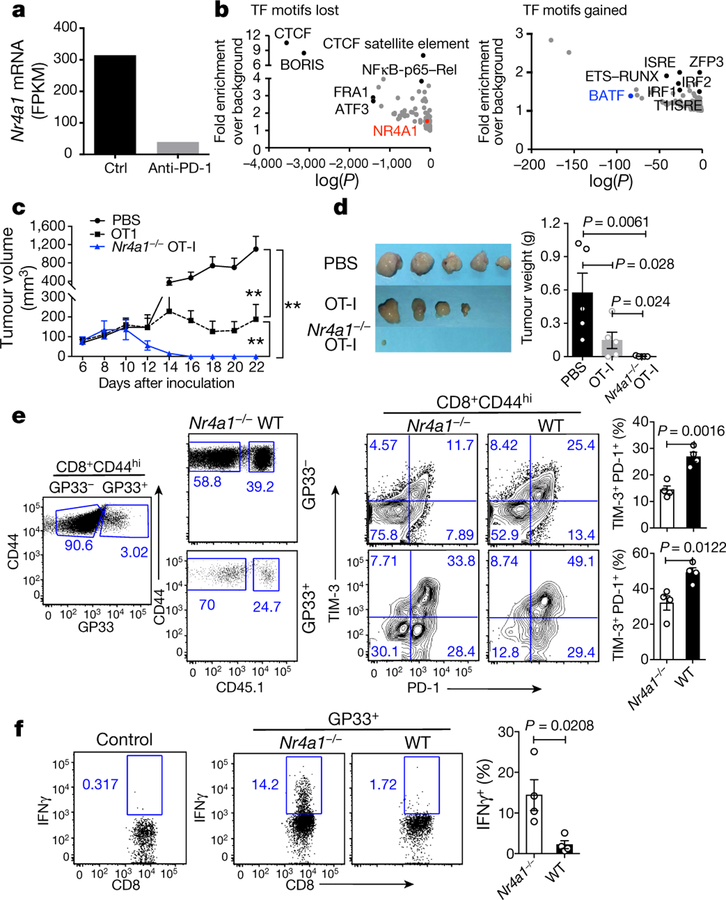
Previous studies showing the upregulation of NR4A1 in chronic virus-associated T cell exhaustion20,21 led us to investigate the role of NR4A1 in tumour-specific CD8+ T cells. In mice with OVA-expressing EL4 cells (E.G7 lymphoma), treatment via PD-1 blockade not only led to tumour shrinkage (data not shown), but also substantially reduced Nr4a1 mRNA expression in tumour-infiltrating OVA-specific CD8+ T cells compared with the control group (Fig. 3a). Open chromatin region analysis of these cells revealed that the NR4A1-binding motif was significantly reduced after anti-PD1 treatment, whereas binding motifs for BATF, IRF1 and ETS–RUNX were significantly enriched (Fig. 3b). These data, together with previous work on PD-L1 blockade in chronic viral infection20, support the hypothesis that NR4A1 is linked to CD8+ T cell dysfunction.
Fig. 3. Disruption of NR4A1 prevents T cell exhaustion caused by tumour and viral infection.
a, Nr4a1 mRNA levels (measured as fragments per kilobase of exon per million fragments mapped (FPKM) in OVA-specific CD8+ tumour-infiltrating lymphocytes (TILs) from E.G7 tumour cell-bearing mice treated with control (ctrl) or anti-PD-1 antibodies. RNA-seq data were obtained from the GEO accession GSE11024930. b, Analysis of open chromatin regions lost (left) or gained (right) in OVA-specific CD8+ TILs following anti-PD-1 treatment. Assay for transposase-accessible chromatin using sequencing (ATAC-seq), combined with assessment of enrichment of transcription factor (TF)-binding motifs. n = 6 mice per group. Data are mean ± s.e.m and P values were calculated using one-way analysis of variance (ANOVA). c, Growth of E.G7 tumour in mice receiving PBS, wild-type or Nr4a1−/− OT-I cells (3 × 10⁶ cells per mouse). d, Representative images of tumours from mice 22 days after transplant. e, Flow cytometry measurement and quantification of TIM-3 and PD-1 expression in splenic wild-type and Nr4a1−/− CD8+ T cells (both GP33+ and GP33−) in the context of LCMV-clone 13 infection. f, Flow cytometry analysis of IFNγ expression in splenic wild-type and Nr4a1−/− GP33+CD8+ T cells. n = 5 (c, d); n = 4 (e, f,). *P < 0.05, **P < 0.01 (two-sided unpaired Student’s t-test). Experiments were independently repeated three times (c, d) or twice (a, b, e, f). Data are mean ± s.d.
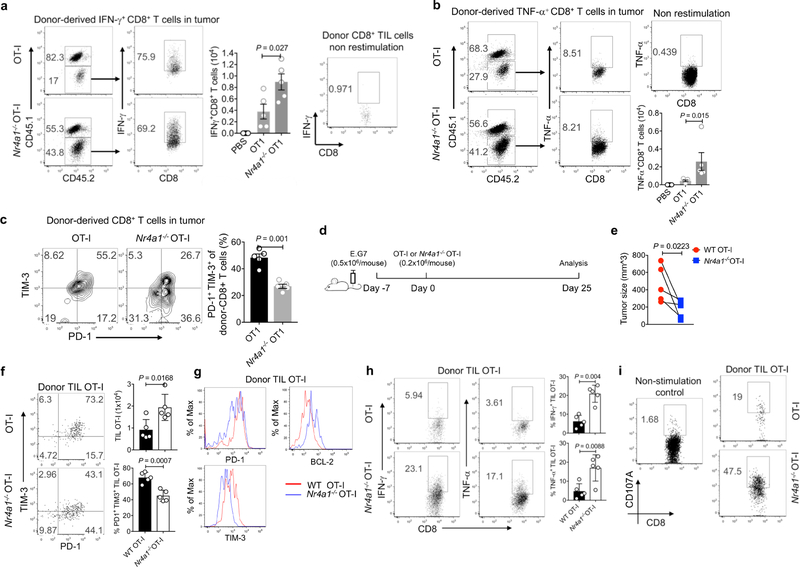
Adoptive transfer of Nr4a1−/− transgenic CD8+ T recognizing OVA257–264 peptide (OT-I) cells into E.G7 tumour cell-bearing mice nearly eliminated tumours, in contrast with wild-type OT-I cells and a PBS control group (Fig. 3c, d). Six days after T cell transfer, two to three times as many tumour-infiltrating Nr4a1−/− OT-I cells were recovered than cells of the wild-type OT-I group. Although wild-type and Nr4a1−/− T cells did not show much difference in their expression of IFNγ and TNF (also known as TNFα), surface PD-1 and TIM-3 expression were significantly decreased in the absence of NR4A1 (Extended Data Fig. 6a–c). Moreover, we extended the tumour model to 25 days in a new transfer assay (Extended Data Fig. 6d). Tumour sizes in mice receiving Nr4a1−/− OT-I were significantly smaller than the wild-type control group (Extended Data Fig. 6e). Approximately twice as many Nr4a1−/− than wild-type OT-I cells were recovered from tumours and PD-1 and TIM-3 expression levels in donor T cells were significantly reduced, whereas BCL2 expression was notably increased (Extended Data Fig. 6f, g). By contrast, IFNγ, TNF and CD107A expression levels were appreciably higher in Nr4a1−/− than in wild-type OT-I cells (Extended Data Fig. 6h, i).
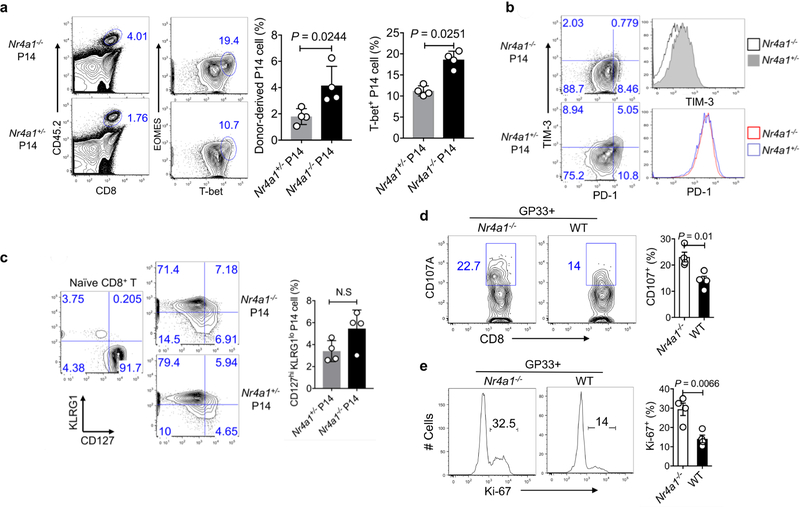
In the context of acute viral infection (lymphocytic choriomeningitis virus (LCMV); Armstrong strain), Nr4a1 ablation in P14 T cells increased CD8+ T cell proliferation and T-bet expression, but had no effect on KLRG1loCD127hiCD8+ memory precursor cell formation, when compared with the Nr4a1+/− control group (Extended Data Fig. 7a–c). We then looked at chronic viral infection (LCMV, clone 13 strain) in chimeric mice reconstituted with Nr4a1−/− and wild-type bone marrow cells. Four weeks after viral infection, higher percentages of both GP33+ and GP33− Nr4a1-deficient CD8+ T cells in spleens were observed compared with wild-type cells, and Nr4a1-deficient CD8 + T cells were marked with lower PD-1 and TIM-3 expression than wild-type cells (Fig. 3e). IFNγ, CD107A and Ki-67 expression were significantly enhanced in GP33+ Nr4a1−/− T cells compared with wild-type cells (Fig. 3f and Extended Data Fig. 7d, e). Similar patterns were also observed in peripheral lymph nodes, blood, lung and liver (data not shown). Collectively, our data show that NR4A1 deficiency can prevent CD8+ T cell dysfunction.
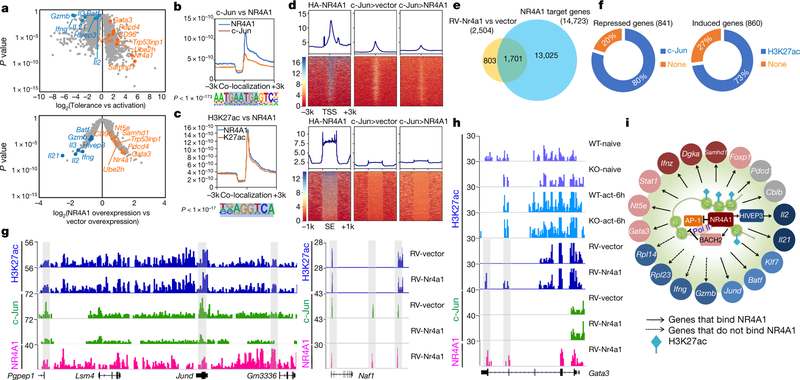
Microarray analysis showed that 2,504 genes altered their expression in CD4+ T cells that overexpressed NR4A1 compared with mock-transduced cells (Extended Data Fig. 8a). Among NR4A1-regulated genes, 290 (of which 178 were downregulated and 112 upregulated) overlapped with genes associated with Ttol cell generation (Extended Data Fig. 8a and Supplementary Table 4). Notably, a core cluster of genes that are critical for T cell activation or dysfunction were similarly regulated in both Nr4a1-overexpressing T cells and Ttol cells, including Il2, Ifng, Il21, Gzmb, Stat1, Batf, Jund, Dgka, Hivep317, Nt5e (encoding CD73)22, Cd96 (also known as Tactile)23, Gata324 and Cdkn1b (Fig. 4a and Supplementary Table 4).
Fig. 4. NR4A1-mediated transcriptional regulation of T cell tolerance.
a, Volcano plot comparison of 2,357 Ttol genes with 2,504 NR4A1-regulated genes (retrovirus RV-Nr4a1-GFP versus vector control). Blue, downregulated genes; orange, upregulated genes. Microarray data were analysed with the ‘limma’ package in R. The x axis values represent log2 (gene expression in Ttol/gene expression in activated T cells) (top), and log2(NR4A1 overexpression/vector overexpression) (bottom). n = 2 per group. A false discovery rate (FDR) < 0.05 was used as the threshold for significance. b, c, The library was screened (using hypergeometric enrichment calculations in the HOMER program) for reliable motifs that could be used as targets; each enriched motif with a specific P value. b, Top, genome-wide comparison of c-Jun and NR4A1 binding; bottom, top binding motif for regions of co-localization. c, Top, genome-wide comparison of H3K27ac peaks and NR4A1 binding; bottom, top binding motif for overlapping regions. d, Heatmaps for genome-wide distribution of NR4A1 and c-Jun peaks at TSSs and super-enhancer (SE) regions in RV-vector-and RV-Nr4a1-transduced CD4+ T cells. HA, haemagglutinin. e, Venn diagram of NR4A1-regulated genes and NR4A1-bound genes. f, Left, percentage of genes directly repressed by NR4A1 that showed a reduction of c-Jun recruitment; right, percentage of induced genes that were marked with NR4A1-orchestrated H3K27ac. g, H3K27ac, c-Jun and NR4A1 peaks at the Pgpep1, Jund and Naf1 gene loci in RV-vector-and RV-Nr4a1-transduced CD4+ T cells. h, H3K27ac, c-Jun and NR4A1 peaks at the Gata3 locus in naive and 6-h-activated wild-type and NR4A1 knockout CD4+ T cells, as well as RV-vector-and RV-Nr4a1-transduced CD4+ T cells. i, Integrated network analysis that identifies NR4A1-centred transcriptional modules. Colours indicate expression levels: red, higher; blue, lower; grey, minor or no change. More detail for ChIP–seq samples (b–d, f–h; n = 1) is provided in Supplementary Table 5. Peaks with FDR of 5% (versus control input DNA) were considered as significant.
Next, we conducted a chromatin-immunoprecipitation followed by sequencing (ChIP–seq) assessment on NR4A1 to define its target. Global mapping analysis showed that most of the 50 million short reads were enriched at intergenic regions, exons and introns, and 14,723 gene loci were bound by NR4A1 (Extended Data Fig. 8b–d, and Supplementary Table 5). We then compared NR4A1-occupied genes with those that were differentially expressed in Ttol cells and/or T cells that overexpressed NR4A1, and found that around 70% of Ttol genes were bound by NR4A1 (Extended Data Fig. 8d). Analysis of NR4A1-binding sites unexpectedly revealed that the top NR4A1-binding motifs were AP-1-containing consensus sequences and canonical NR4A1-binding sequences (Extended Data Fig. 8e). To validate this, we performed anti-c-Jun (c-Jun is a subunit of AP-1) ChIP–seq assays in activated T cells, and found that a substantial number of NR4A1-binding sites overlapped with c-Jun sites (Fig. 4b and Extended Data Fig. 8f).
As NR4A1 bound predominantly at non-promoter regions (Extended Data Fig. 8c), we conducted ChIP–seq on H3K27ac, a super-enhancer marker that reflects epigenetic status for T cell activation25–27. Notably, NR4A1 peaks overlapped sharply with H3K27ac sites in NR4A1-overexpressing T cells, and the dominant region of co-localization was the classical NR4A1-binding consensus sequence (Fig. 4c). Further examination of H3K27ac distribution in the presence or absence of NR4A1 demonstrated that NR4A1 binding positively correlated with H3K27ac modifications in activated T cells at the super-enhancer region (Extended Data Fig. 8g).
In a context of normal NF-AT signal transduction, insufficient AP-1 mediates T cell hyporesponsiveness7,28. We reasoned that, given that Nr4a1 peaks co-localized with AP-1-binding sites, NR4A1 might regulate T cell tolerance by occupying these sites. Electrophoretic mobility shift assays (EMSAs) and a luciferase reporter assay demonstrated that NR4A1 specifically antagonized the AP-1-mediated transcriptional program (Extended Data Fig. 9a, b). Moreover, inspection of genome-wide NR4A1 and c-Jun distribution revealed that enforced NR4A1 expression suppressed the enrichment of c-Jun at TSSs (Fig. 4d). To corroborate this result, we conducted anti-c-Jun ChIP assays on activated wild-type and Nr4a1−/− CD4+ T cells. NR4A1 deletion increased the recruitment of c-Jun to the Jund, Pgpep1 and Naf1 genes, but had no effect on c-Jun binding at the promoter region of the Il2 gene locus. This suggests that NR4A1 has an indirect role in regulating Il2 transcription via downregulation of HIVEP3 (Extended Data Fig. 9c–e, g).
Next, we tested whether NR4A1-mediated antagonism of AP-1 and enhancement of H3K27ac were directly correlated with transcriptional alterations in T cells. Combinational analysis of ChIP–seq and transcriptome data revealed that among 1,701 genes that were directly bound and regulated by NR4A1, 80% of the 841 downregulated gene loci exhibited reduction of c-Jun binding, whereas 73% of the 860 upregulated gene loci were marked with enhanced H3K27ac signals (Fig. 4e, f, and Supplementary Tables 6 and 7). As shown in Fig. 4g, NR4A1 bound to the loci of repressed genes Jund and Naf1 and antagonized c-Jun recruitment, but the H3K27ac signal remained intact. In addition, NR4A1 was able to bind at induced gene loci including Gata3, Nr4a1, Nt5e, Bach2 and Samhd1 concomitantly with H3K27ac enhancement (Fig. 4h and Extended Data Fig. 9f), suggesting that NR4A1 might coordinate the action of these inhibitors22,24,29 and thereby enforce a repressive program in Ttol cells. T cell exhaustion-related genes such as Pdcd1, Havcr2 and Lag3, the expression levels of which were not increased in NR4A1-overexpressing T cells, were also found to recruit NR4A1—indicative of poised chromatin status for potential transcriptional activities (Extended Data Fig. 9h).
In summary, our validation and classification of NR4A1-regulated genes have identified an NR4A1-centred regulatory circuit that orchestrates the characteristics of Ttol cells (Fig. 4i). Our findings, together with recent observations on the upregulation of NR4A1 in dysfunctional T cells20,22, indicate that this regulatory circuit may be a suitable target for future therapeutic intervention.
Methods
Mice and viral infection.
B7.1−/− (also known as Cd80−/−), B7.2−/− (also known as Cd86−/−), C57BL/6, OT-I, OT-II, CD4–Cre, Rag1−/− and B6SJL mice were purchased from Jackson Laboratories. The Nr4a1−/− mouse strain, a gift from O. M. Conneely, was bred with C57BL/6 mice for at least seven generations. B7.1−/−B 7.2−/−B7h−/− (B7h is also known as Icosl) triple knockout mice were generated and maintained as previously described2. Nr4a1−/− mice were bred with OT-I and OT-II mice to generate Nr4a1−/− OT-I and Nr4a1−/− OT-II mice. P14 mice, which were provided by L. Ye, were bred with Nr4a1−/− mice to generate Nr4a1−/− P14 mice. Junfl/fl CD4–Cre mice were provided by X. Liu. Mice were maintained in a specific pathogen-free animal facility and in accordance with governmental and institutional guidelines (Laboratory Animal Welfare and Ethics Committee of the Third Military Medical University) for animal welfare. Age-and sex-matched donor or recipient mice were selected and included in different groups (typically 3–5 mice per group).
Acute and chronic viral infection.
Mice were generally infected intraperitoneally with LCMV-Armstrong (2 × 10⁵ plaque-forming units (PFU)) or intravenously with LCMV-clone 13 (2 × 10⁶ PFU). Mice were infected at 6–10 weeks of age, and both sexes were included without randomization or blinding. For LCMV-Armstrong infection, congenic CD45.1+B6SJL mice received equal amounts of CD45.2+ Nr4a1−/− or Nr4a1+/− P14 cells (1 × 10⁴ per mouse) and were infected with LCMV-Armstrong at a dosage of 2 ×10⁵ PFU. Eight days after infection, mice were euthanized and donor cells were assessed. For LCMV-clone 13 infection, chimeric mice were generated by transferring equal amounts of CD45.1+ wild-type and CD45.2+ Nr4a1−/− bone marrow cells into Rag1−/− mice. Eight weeks after reconstitution, mice were infected with LCMV-clone 13. Four weeks after infection, flow cytometry analysis of wild-type and Nr4a1−/− CD8+ T cells in the spleen was performed using LCMV-GP33–41-tetramer (GP33+) staining.
Oral tolerance induction,.
Wild-type or Nr4a1−/− mice were fed five times with OVA (20 mg in PBS; grade V; Sigma) or PBS as previously described18. Seven days after the last feeding, all mice were immunized subcutaneously with 100 μg OVA emulsified in CFA. Seven days later, mice were euthanized and analysed. Control mice were given PBS alone. Spleen cells were stimulated in 96-well plates as triplicates with or without OVA protein. IL-2 and IFNγ production was determined by ELISA (PharMingen) after T cell activation.
Peptide-induced tolerance.
Naive wild-type OT-II or Nr4a1−/− OT-II cells (1 × 10⁶ per mouse) were injected into congenic B6SJL or CD45.1+ CD45.2 + (B6SJL × C57BL6) recipient mice, followed by 500 μg of OT-II peptide on days 0 and 3. Mice with or without peptide treatment were immunized intraperitoneally with OVA in CFA. Eight days after immunization, donor-derived T cells were sorted from spleens and subjected to flow cytometry analysis, or sorted for quantitative polymerase chain reaction with reverse transcription (qRT–PCR) analysis.
E.G7 tumour experiments.
E.G7 tumour cells were implanted subcutaneously into the right flank of CD45.1+CD45.2+ (B6SJL ×C57BL6) recipient mice. For adoptive transfer, six days after tumour transplant, naive (CD8+CD62LhiCD44lo) wild-type or Nr4a1−/− OT-I cells were sorted and adoptively transferred into tumour-bearing mice intravenously. Tumour size was measured in two dimensions by caliper and was expressed as the product of two perpendicular diameters. Tumours were isolated and processed with a mouse tumour dissociation kit (Miltenyi; 130–096-730). Tumour-infiltrating T cells were collected using Percoll density centrifugation (40% versus 70%), and subjected to flow cytometry analysis. Specifically, for Fig. 3c, d and Extended Data Fig. 6a–c, CD45.1+CD45.2+ (B6SJL ×C57BL6) congenic mice were subcutaneously injected with E.G7 tumour cells (5 × 10⁵ cells per mouse) in one flank. Six days later, PBS, wild-type or Nr4a1−/− OT-I cells (3 × 10⁶ cells per mouse) were adoptively transferred into mice intravenously. Tumour sizes were monitored after adoptive transfer. To assess tumour-infiltrating donor T cells, mice were euthanized 6 days after T cell transfer. Donor-derived T cells were collected from tumour, draining lymph nodes and spleens, and subjected to flow cytometry analysis. For Extended Data Fig. 6d–i, CD45.1+ B6SJL congenic mice were subcutaneously injected with E.G7 tumour cells (5 × 10⁵ cells per mouse) in one flank. Seven days later, mice were adoptively transferred with wild-type or Nr4a1−/− OT-I cells (2 ×10⁵ cells per mouse) intravenously. Twenty-five days after adoptive transfer, mice were euthanized and tumour sizes were measured. Donor-derived T cells were collected from tumour, draining lymph nodes and spleens, and subjected to flow cytometry analysis.
ATAC-seq, data analysis for open chromatin regions and RNA sequencing.
A total of 1 × 10⁶ E.G7 cells were injected subcutaneously into 6 to ~10-week-old female C57BL/6J mice (six mice per group). This was followed by intraperitoneal injection of control or anti-PD-1 antibody at a dosage of 75 μg per mouse every 3 days starting from day 9. On day 21, mice were euthanized and subcutaneous tumours were digested with 1 mg ml−1 collagenase D supplemented with 10 U ml−1 DNase I. OVA-specific CD8+ TILs were stained with H-2Kb–SIINFEKL tetramer and sorted using a BD FACSAria cell sorter, and gene profiling, ATAC-seq library construction and high-throughput sequencing30 were performed on approximately 15,000–50,000 sorted cells. ATAC-seq data for tumour-infiltrating OVA-specific CD8+ T cells isolated from E.G7 tumour cell-bearing mice treated with anti-PD-1 or control antibody are available at the Gene Expression Omnibus (GEO), with accession code GSE11025130.
Paired-end reads were mapped to the mm10 reference genome using Bowtie2. Only concordantly mapped pairs were kept for further analysis. Peak calling was performed using MACS2 to identify areas of sequence tag enrichment. BedTools was used to find common intersections between identified peaks (1 base pair (bp) minimum overlap) and to create a merged peak list. DNA transcription factor motif analysis across the merged peak list was computed using hypergeometric optimization of motif enrichment (HOMER; homer.ucsd.edu/homer/) . Fold enrichment over background was calculated by dividing the number of target sequences with motif (12,391) by the number of background sequences with motif (37,059). Transcription factors with a fold enrichment over background that was larger than one were plotted.
RNA-sequencing data of tumour-infiltrating OVA-specific CD8+ T cells from E.G7 tumour cell-bearing-mice treated with anti-PD-1 or control antibody were obtained from GEO accession GSE11024930. Clean reads were mapped to the mm10 reference genome and the fragments per kilobase of exon per million fragments mapped (FPKM) was calculated using Bowtie2. NR4A1 expression was compared between OVA-specific CD8+ TILs from mice treated with anti-PD-1 and control antibody.
Colitis model.
Rag1−/− mice were injected intravenously with 4 × 10⁵ syngeneic CD4+CD45RBhi wild-type or Nr4a1−/− T cells. Body weights were monitored daily. Mice with clinical signs of disease were euthanized so that the severity of colitis could be assessed. After removal of Peyer’s patches, intestine and colon tissues were cut into pieces for haematoxylin and eosin (H&E) staining. After digestion with collagenase D, T cells from the lamina propria were isolated using Percoll density centrifugation and subjected to flow cytometry analysis.
Immunization and flow cytometry.
Mice (6–8 weeks old; 3–5 per group) were immunized with OT-II peptide or OVA (100 μg ml−1) emulsified in CFA (0.5 mg ml−1) subcutaneously or intraperitoneally (100 µl per mouse). T cells from various experiments were stained with fluorescence-labelled antibodies and analysed with a Fortessa instrument and Flowjo software. Intracellular staining was carried out with a Cytofix/Cytoperm Fixation/Permeabilization Kit (554714, BD Biosciences). Data were analysed with Flowjo.
Retroviral transduction.
Naive CD4+CD25−CD44loCD62L hi T cells from OT-II or C57BL/6 mice were sorted using fluorescence-activated cell sorting (FACS) and activated with plate-bound anti-CD3e (clone 2C11, BD Biosciences) and anti-CD28 (clone 37.51, BD Biosciences) under neutral conditions. Thirty-six hours after activation, cells were infected with retrovirus RV-Nr4a1-GFP or control empty vector (RV-vector-GFP). Two days after infection, cells were sorted (using FACS) for adoptive transfer or were restimulated with pre-coated anti-CD3e. Cell transfer numbers were 1 × 10⁵–4 × 10⁵ for GFP+ T cells.
In vitro Ttol cell generation and microarray assay.
Naive CD25loCD44lo CD62LhiCD4+ T cells purified from OT-II mice were activated with OVA in the presence of irradiated B7.1−/−B7.2−/−B7h−/− or wild-type APCs for 4 days, and analysed for IFNγ and IL-2 expression2. Total cellular RNA was extracted from in vitro-generated Ttol cells, sorted RV-Nr4a1-GFP-and RV-vector-GFP-infected GFP+ CD4+ T cells with TRIzol reagent (Invitrogen). DNA microarray labelling and analysis were performed at the Institute for System Biology. Approximately 5 μg of RNA was labelled and hybridized to GeneChip Mouse Genome 430 2.0 arrays (Affymetrix), according to the manufacturer’s protocols. Expression values were defined with GeneChip Operating Software (GCOS). P values were adjusted using FDR methods, and an FDR lower than 0.05 was considered to be significant. Microarray data from Ttol cells were normalized with GC robust multi-array average (GCRMA) and compared with gene expression profiles from other T cells including TH1, TH2, TH17, nTreg and naive T cells. T cell correlation analyses were conducted with a k shared nearest neighbours classification algorithm and principal component analysis.
ChIP–PCR and ChIP–seq.
ChIP was performed following the Active Motif protocol. In brief, in vitro-generated Ttol cells; naive wild-type and Nr4a1−/− CD4+ T cells; 6-h, 36-h or 72-h-stimulated wild-type and Nr4a1−/− CD4+ T cells; and sorted RV-Nr4a1-GFP-infected and RV-vector-infected CD4+ T cells were restimulated with plate-coated anti-CD3 and fixed with 1% formaldehyde, followed by digestion with MNase cocktail (Active Motif). Chromatin from 4 × 10⁶ cells was used for each ChIP experiment. Antibodies against H3K4me3 (ab8580; Abcam), H3K27me3 (07–449; Millipore), H3K27ac (ab4729; Abcam), NR4A1 (14–5964-82; clone 357, eBioscience), c-Jun (sc-45x; Santa Cruz) and haemagglutinin (3724, clone C29F4; Cell Signaling Technology) were used. Antibody–DNA complexes were captured by protein A magnetic beads (Invitrogen). The immunoprecipitated DNA was purified and subjected to PCR assessment or/and sequencing library preparation. All sequencing libraries were prepared using the TruSeq ChIP Sample Prep Kit (Illumina) according to the manufacturer’s protocol. The DNA libraries of H3K4me3 and H3K27me3 for Ttol cells were sequenced with the Illumina 1G Genome Analyzer at the Institute for Systems Biology, and the rest of the DNA libraries were sequenced with Illumina HiSeq 2500 at the BGI Genomics company. Sequence reads of 50 bp were obtained using the CASAVA v.1.8.2 package (Illumina). All reads were mapped to the mm9 mouse genome and uniquely mapped reads were processed further for peak identification. SICER v.1.18 was used to identify significant peaks (FDR of 5%) with input DNA (ChIP–seq) as the control. Outputs of the peak files were converted to browser-extensible data (BED) files and viewed with the University of California, Santa Cruz (UCSC) genome browser and the integrative genomics viewer (IGV; v.2.4.5). HOMER was used to perform the consensus binding motif analysis for NR4A1. To calculate the tag density of NR4A1 binding, the epigenetic modifications around TSSs, or the centres of NR4A1-binding sites, uniquely mapped tags were summarized in 20-bp windows and all window tag counts were normalized by the total number of bases in the windows and the total read number of the given sample. Co-localization of NR4A1-binding sites with AP-1 and H3K27ac consensus motifs was analysed with HOMER software, and the binding sites of NR4A1, H3K27ac and AP-1 were first defined using SICER v.1.1. A binding site was defined as one or several consecutive 200-bp windows of the genome in which there was a statistically significant enrichment of sequencing reads against the background. Any area where part of one transcription factor-binding site overlapped with another one was defined as the overlay of the two binding sites. Genomic coordinates of mouse CD4+ T cell super-enhancers were calculated using the rank ordering of super-enhancers (ROSE) algorithm25,27on H3K27ac signal intensity across the genome26.
EMSA and luciferase reporter assays.
Nuclear extracts were prepared from empty vector-or RV-Nr4a1-GFP-transduced CD4+ T cells with or without phorbol myristate acetate (PMA)/ionomycin stimulation. Nuclear extracts of 5 × 10⁶ cells were prepared with a nuclear and cytoplasmic extraction kit (78833; ThermoFisher Scientific) and protein concentrations were determined with a bicinchoninic acid (BCA) protein assay kit (23225; ThermoFisher Scientific), using bovine serum albumin standards. For further quantification of c-Jun and c-Fos in nuclear extracts, western blotting assays were performed using anti-c-Fos (clone 9F6; Cell Signaling Technology) and anti-c-Jun (clone 60A8; Cell Signaling Technology) antibodies. EMSA analysis was performed with 5 μg of nuclear extracts and a biotin-labelled double-stranded AP-1 probe (5′-CGCTTGATGACTCAGCCGGAA-3′; Santa Cruz) and OCT-1 (5′-TGTCGAATGCAAATCACTAGAA-3′; Santa Cruz). For the supershift assay, 0.5 μg of anti-c-Jun antibody (sc-45x; Santa Cruz) was pre-incubated with nuclear extract. EMSA samples were run on a 5% native polyacrylamide gel. The gels were blotted onto a positively charged nylon membrane, blocked, incubated with horseradish peroxidase (HRP)-conjugated avidin and developed using the chemiluminescent nucleic acid detection module kit (89880; ThermoFisher Scientific).
Jurkat cells were co-transfected with RV-Nr4a1-GFP or empty vector with AP-1 or NF-AT reporter constructs (firefly; Clontech) treated with PMA/ionomycin for 6 h. Renilla luciferase plasmid was used as a control. Cell samples were lysed and subjected to luciferase assessment (Promega).
qRT–PCR analysis.
Total RNA was extracted with Trizol reagent (Invitrogen). Oligo (dT)18 Primer and M-MLV Reverse Transcriptase (Invitrogen) were used to generate cDNA. Gene expression was examined with the iQ SYBR real-time kit (Bio-Rad Laboratories). Data were normalized using beta-actin (Actb) as the reference gene. The primer pairs for qRT–PCR analysis of Il2, Ifng, Cblb and Tbx21 were previously described18. Primer pairs for detection of mouse Nr4a1, Itch, Klf4, Hivep3 and Lpin2 were as follows: Nr4a1, forward, 5′-AGTTGGGGGAGTGTGCTAGA-3′; reverse, 5′-GCTTGAATACAGGGCATCTCCAG-3′. Itch, forward, 5′-ACCCT AAAGTTGTGGGGATGG-3′; reverse, 5′-GTTTGGCTGAGATGACAGTGA-3′. Klf4, forward, 5′-GACTAACCGTTGGCGTGAGG-3′; reverse, 5′-GTCTAGGTCCAGGAGGTCGT-3′. Hivep3, forward, 5′-CCCCCTA GTTCTC TGCCTCT-3′; reverse, 5′-GCTTAGATCGCAGGAGGGAC-3′. Lpin2, forward, 5′-TGTTTGTGGTGCCTTCACCT-3′; reverse, 5′-TGGTTTGAGA CAGAATCCCAGG-3′.
Statistics.
Unless otherwise indicated, a Student’s t-test or one-way ANOVA was used for two-group comparisons. P values of <0.05 were considered significant. Statistical analysis was performed with Graphpad Prism 7. No statistical methods were used to predetermine sample size.
Reporting summary.
Further information on research design is available in the Nature Research Reporting Summary linked to this paper.
Data availability
ChIP–seq and microarray data have been deposited in the GEO, with accession code GSE96969. All microarray and ChIP–seq profiling data and analysis can also be found in Supplementary Tables 1–7.
Extended Data
Extended Data Fig. 1. Comparison of gene expression profiles among CD4+ T cell subsets including Ttol, TH1, TH2, T H17, nTreg, naive T, TNF-AT and Texh cells.
a, Hierarchical clusters for six groups of CD4+ T cells. The colour coding indicates the expression level of 10,462 genes, with 0 as the median. All of the samples, except nTreg cells, were duplicated. b, Hierarchical clustering and principal component analysis of six types of CD4+ T cells (Ttol , naive, TH1, TH2, TH17 and nTreg). n = 2 (naive, TH1, TH2, TH17 and Ttol); n = 1 (nTreg). c, Correlation analysis of CD4+ T cell subsets using a k shared nearest neighbours classification algorithm. d, Ingenuity pathway analysis (IPA) of differentially expressed genes in Ttol cells, with twofold as the cut-off. e, Venn diagram comparison of Ttol cell-relevant genes with TNF-AT cell-and Texh cell-relevant genes.
Extended Data Fig. 2. Distribution of H3K4me3 and H3K27me3 peaks in mouse CD4+ T cells.
a, Summaries of H3K4me3 and H3K27me3 peaks in mouse CD4+ T cells including Ttol, TH1, TH2, TH17, nTreg, iTreg and naive T cells. The mouse genome (mm9) is divided into four regions: promoter (1 kb upstream and downstream of the TSS), exon, intron and intergenic regions. For each sample, the total number of identified islands is listed, followed by the number of islands for each genomic region (with the percentage of the total). b, Distribution of H3K4me3 and H3K27me3 modifications within gene bodies in mouse CD4+ T cells. TxStart, start of transcription; TxEnd, end of transcription. c, Comparison of global distribution of H3K27me3 modifications at promoter, exon, intron and intergenic regions among different T cell subsets. d, Percentage of genes associated with H3K4me3 alone (K4), H3K27me3 alone (K27), both H3K4me3 and H3K27me3 (K4&K27), or neither (None), for each T cell subset as indicated. e, H3K4me3 and H3K27me3 histone modifications across the Ifng, Il4 and Il17a gene loci in indicated T cell subsets. f, Genome-wide H3K4me3 and H3K27me3 histone modifications across the gene loci for three master transcription factors (Tbx21, Gata3 and Rorc) for indicated T cell subsets. g, H3K4me3 and H3K27me3 histone modifications across the T cell-anergy-related genes Egr3, Dgkz and Cdkn2a, and the T cell-exhaustion-related genes Lag3, Pdcd1 and Tigit, for indicated T cell subsets. h, H3K4me3 and H3K27me3 modifications as well as gene expression profiles were normalized separately with GeneSpring software. Hierarchical clusters of gene modules of transcription factors, nucleosomes, ribosomes, spliceosome/RNA processing, mitochondria, ubiquitination and proteasome are shown. The colour coding depicts the normalized value for each gene based on the following scales: expression (−2 to +2), H3K4me3 (−2 to +3) and H3K27me3 (−1 to +3), with 0 as the median.
Extended Data Fig. 3. NR4A1 is stably overexpressed in Ttol cells.
a–c, Naive OT-II cells were transferred into naive CD45.1+ (B6SJL) recipient mice, followed by either intraperitoneal injection of OVA emulsified in CFA (activated group), or intravenous injection of soluble OT-II peptide (500 μg per mouse) twice at day 0 and day 3 (tolerant group). Eight days later, donor-derived T cells were sorted from spleens and assessed. a, Sorted donor-derived T cells from the activated and tolerant groups of mice were restimulated with plate-coated anti-CD3 for different periods of time (3 h or 6 h). Flow cytometry analysis of NR4A1 expression. b, qRT–PCR measurement of T cell activation-related and tolerance-related genes. *P < 0.05, **P < 0.01. c, Sorted donor-derived T cells and naive OT-II cells were restimulated with peptide-loaded APCs in vitro for 3 h. Flow cytometry analysis of NR4A1 expression. d, qRT–PCR measurement of gene expression in RV-Nr4a1-GFP-and empty vector-transduced CD4+ T cells under neutral polarization conditions. e, Flow cytometry analysis of IFNγ, IL-4, IL-17A and FOXP3 in RV-vector-GFP-or RV-Nr4a1-GFP-infected CD4+ T cells under TH1, TH2, TH17 and iTreg cell polarization conditions. n = 3 mice per group. P values were calculated using a two-sided unpaired Student’s t-test. All data are representative of two independent experiments and graphs show mean ± s.d.
Extended Data Fig. 4. Deletion of NR4A1 in T cells results in overexpression of IL-2 and IFN γ.
a, qRT–PCR measurement of expression of Nr4a1, Il2 and Ifng in wild-type and Nr4a1−/− CD4+ and CD8+ T cells stimulated with plate-coated anti-CD3 and anti-CD28 at indicated time points. b , Flow cytometry analysis of IFNγ and IL-17A expression in wild-type and Nr4a1−/ − CD4+ and CD8+ T cells from lymph nodes (LN) and spleens (SP). c, ELISA measurement of IFNγ and IL-2 expression in splenocytes from wild-type and Nr4a1−/ − mice in the context of food oral tolerance. PBS-treated mice were used as a control group. *P < 0.05. OD, optical density. d, Equal amounts of CD45.1+ wild-type and CD45.2+Nr4a1−/− bone marrow cells (4 × 10⁶ per mouse) were transferred into Rag1−/− mice. Flow cytometry analysis of CD4+FOXP3+ Treg cells in thymus, spleen and lymph nodes (LN) from chimeric mice two months after reconstitution. Six-week-old mice; n = 3 per group (a–c); n = 4 per group (d). P values were calculated using a two-sided unpaired Student’s t-test. N.S., not significant. All data are representative of two independent experiments and graphs show mean ± s.d.
Extended Data Fig. 5. Deletion of NR4A1 in T cells exacerbates colitis.
a, Wild-type and Nr4a1−/− CD4+CD45RBhi T cells (4 × 10 5 per mouse) were transferred into Rag1−/− mice. Mice were euthanized four weeks after T cell transfer. Donor-derived T cells were collected from the lamina propria and analysed for IFNγ and IL-17A expression by flow cytometry. n = 4 per group. b, Caeca and colons were collected from Rag1−/− mice with wild-type or Nr4a1−/− CD4+ T cells. n = 4 per group. c, Haematoxylin and eosin staining of colon tissues. d. Flow cytometry analysis of donor-derived CD25+FOXP3+ Treg cells in lamina propria (LP), mesenteric lymph nodes (mLN) and spleens (SP) 28 days after T cell transfer. All data are representative of two independent experiments with similar results.
Extended Data Fig. 6. Deletion of NR4A1 in CD8+ T cells enhances immunity against tumours.
a–c, CD45.1+CD45.2+ (B6SJL × C57BL6) recipient mice were injected subcutaneously with E.G7 tumour cells (5 × 10⁵ cells per mouse) in one flank. Six days later, the mice were adoptively transferred with PBS, wild-type or Nr4a1− /− OT-I cells (3 × 10⁶ cells per mouse) intravenously. Mice were euthanized 6 days after T cell transfer. Donor-derived T cells were collected from tumour, draining lymph nodes and spleens, and subjected to flow cytometry analysis. a, b, Flow cytometry analysis and quantification of IFNγ expression (a ) and TNF expression (b ) in donor-derived T cells from tumours. c, Flow cytometry analysis and quantification of the T cell exhaustion surface markers PD-1 and TIM-3 in tumour-infiltrating donor T cells. d, Experimental strategy for assay of adoptively transferred T cells in tumour-bearing mice. e, Sizes of E.G7 tumour. f, Flow cytometry analysis of PD-1 and TIM-3 expression in tumour-infiltrating donor cells, and quantification of total cellularity of tumour infiltrating donor cells. g, Histogram showing PD-1, TIM-3 and BCL-2 expression in tumour-infiltrating donor T cells. h, Flow cytometry analysis and quantification of IFNγ and TNF expression in tumour-infiltrating donor cells after OT-I peptide restimulation. i, Flow cytometry analysis and quantification of CD107A expression in tumour-infiltrating donor cells. n = 5 mice (8 weeks old) per group. P values were calculated using a two-sided unpaired Student’s t-test. Data are representative of three individual experiments and graphs show mean ± s.d.
Extended Data Fig. 7. NR4A1 deficiency promotes CD8+ T cell effector function during viral infection.
a– c, Congenic CD45.1+B6SJL mice received equal amounts of CD45.2+ Nr4a1− /− cells or Nr4a1+/− P14 cells (1 × 10⁴ per mouse) and were infected with LCMV-Armstrong at the dosage of 2 × 10 5 PFU. Eight days after infection, mice were euthanized and donor cells were assessed. a, Flow cytometry analysis and quantification of EOMES and T-bet expression in Nr4a1−/− and Nr4a1+/− P14 cells in the spleen. b, Flow cytometry analysis and quantification of PD-1 and TIM-3 expression in Nr4a1−/ − and Nr4a1+/− P14 cells in the spleen. c, Flow cytometry analysis and quantification of KLRG1 and CD127 expression in Nr4a1−/− and Nr4a1+/− P14 cells in the spleen. d, e, Chimeric mice were generated by transferring equal amounts of CD45.1+ wild-type and CD45.2+ Nr4a1−/− bone marrow cells into Rag1−/− mice. Eight weeks after reconstitution, mice were infected with LCMV-clone 13. Four weeks after infection, wild-type and Nr4a1−/− CD8+ T cells in the spleen were analysed by flow cytometry. d, Flow cytometry analysis of CD107A in splenic wild-type and Nr4a1−/− GP33+CD8+ T cells after GP33 peptide restimulation. e, Flow cytometry analysis of Ki-67 in splenic wild-type and Nr4a1−/− GP33 +CD8+ T cells after GP33 peptide restimulation. n = 4 per group. P values were calculated using a two-sided unpaired Student’s t-test. Data are representative of two individual experiments and graphs show mean ± s.d.
Extended Data Fig. 8. ChIP–seq and data analysis of NR4A1 and H3K27ac in CD4+ T cells.
a, Venn diagram shows the numbers of genes that were significantly upregulated or downregulated in Ttol cells and RV-Nr4a1-GFP-transduced CD4+ T cells. b, RV-vector-and RV-Nr4a1-transduced CD4+ T cells were subjected to intracellular staining by primary rabbit monoclonal anti-HA antibody and secondary Alexa Fluor 647-conjugated goat anti-rabbit IgG antibody. Data are representative of two individual experiments. c , ChIP–seq dataset for NR4A1 in RV-Nr4a1-transduced CD4 + T cells was generated using anti-HA antibody. Pie chart represents the genome-wide distribution of NR4A1 occupancy in promoter, exon, intron and intergenic regions in RV-Nr4a1-transduced CD4+ T cells, after peak calling and subtraction of IgG control peaks. d, Venn diagram of NR4A1-regulated genes, Ttol cell-related genes and NR4A1-targeted genes. e, NR4A1-binding consensus in CD4+ T cells. SICER v.1.1 was used to identify significant peaks (FDR of 5%), with input DNA (ChIP–seq) as the control. The library was screened (using hypergeometric enrichment calculations in the HOMER program) for reliable NR4A1 motifs; each enriched motif with a specific P value. Top, the most representative NR4A1 motifs in CD4+ T cells based on the P values. Bottom, the classical NR4A1-binding consensus sequence. Detailed information for ChIP–seq samples is provided in Supplementary Table 5. n = 1 for ChIP–seq samples. f, Genome-wide co-localization of c-Jun with NR4A1-binding sites in CD4+ T cells. Histogram indicates the number of peaks at various distances from NR4A1 to c-Jun peak summits. Binomial tests were used to determine peak significance within ChIP–seq data, and a threshold of FDR < 0.01 was used for peak calling. g, ChIP–seq for H3K27ac (K27ac) was performed on naive (0 h) and six-hour (6 h)-activated wild-type and Nr4a1−/− (KO) CD4+ T cells, as well as RV-vector-and RV-Nr4a1-transduced CD4+ T cells. Genome-wide distributions and heatmaps are shown for H3K27ac around TSS and super-enhancer regions.
Extended Data Fig. 9. NR4A1 inhibits recruitment of AP-1 components in CD4+ T cells.
a, Top, EMSA analysis of AP-1 binding. Using the AP-1 consensus motif as a probe, DNA binding was performed on nuclear extracts from empty vector or RV-Nr4a1-GFP-transduced CD4+ T cells stimulated with PMA/ionomycin (PMA/Iono) for the indicated time periods. Super-shift experiments (lane 3) were conducted in the presence of anti-c-Jun antibody. An OCT-1-binding consensus probe was used as a control. Bottom, western blotting (WB) analysis of c-Fos, c-Jun and lamin B1 in nuclear extract. b, Luciferase reporter assay to measure the effect of NR4A1 on AP-1-and NF-AT-mediated transcription. RV-Nr4a1-GFP or empty vector were co-transfected with AP-1 or NF-AT reporter constructs into pre-activated T cells and treated with PMA and ionomycin for 6 h. Cell samples were lysed and luciferase activity was assessed. c, Naive CD4+ T cells were sorted from wild-type and Nr4a1−/− mice and activated with plated anti-CD3 and anti-CD28 for 36 or 72 h. Activated T cells were collected and subjected to ChIP assay using anti-c-Jun antibody, followed by qPCR analysis. Graphs show ChIP–qPCR measurement of c-Jun enrichment at the Jund locus and Pgpep1 and Naf1 promoter regions. Chr, chromosome. d, Distribution of H3K27ac peaks at the Il2 locus in naive and 6-h-activated wild-type and NR4A1 knockout CD4+ T cells, as well as RV-vector-and RV-Nr4a1-transduced CD4+ T cells; and distribution of NR4A1 peaks at the Il2 locus in RV-Nr4a1-transduced CD4+ T cells. e, ChIP–qPCR measurement of c-Jun enrichment at the Il2 locus in wild-type and Nr4a1−/ − CD4+ T cells activated with plated anti-CD3 and anti-CD28 for 36 or 72 h. f, H3K27ac and NR4A1 peaks at the Nr4a1, Bach2 , Nt5e and Samhd1 loci in RV-vector-and RV-Nr4a1-transduced CD4+ T cells. g, H3K27ac and NR4A1 peaks at the Hivep3 locus in naive and 6-h-activated wild-type and NR4A1 knockout CD4+ T cells, as well as RV-vector-and RV-Nr4a1-transduced CD4 + T cells. h , H3K27ac and NR4A1 peaks at Pdcd1, Havcr2 and Lag3 loci. For d , f–h, SICER v.1.1 was used to identify significant peaks (FDR of 5%) with input DNA (ChIP– seq) as the control. Detailed information for ChIP–seq samples is provided in Supplementary Table 5. n = 3 (b, c, e); n = 1 (d, f–h ). P values were calculated using a two-sided unpaired Student’s t-test; NS, not significant. Data are representative of two individual experiments and graphs show mean ± s.d.
Supplementary Material
Acknowledgements
We thank the C.D., X.L. and X.-W.B. laboratory members for their assistance and O. M. Conneely for the Nr4a1−/− mouse strain. The study was supported by the National Key Research and Development Program of China (2016YFA0101200 to X.L. and X.-W.B.); Beijing Municipal Science and Technology (Z171100000417005 to C.D.); the Ministry of Science and Technology of China (2016YFC0906200 to C.D.); the National Natural Science Foundation of China (31630022 and 91642201 to C.D., and 31770973 to X.L.); the Natural Science Foundation Project of Chongqing (CSTC2014JCYJYS10001 to X.L.); an Institute Project grant (SWH2015QN07 and SWH2016HWHZ-01 to X.L.); an Odyssey Fellowship (to X.L.) from MD Anderson Cancer Center; and NIH grants (R01HL143520, R56AI125269, R21AI120012 and R03CA219760 to R.N.).
Competing interests C.D. and X.L. have filed a patent application (PCT/ CN2018/072044) on the role of NR4A1 in T cells.
Footnotes
Online content
Any methods, additional references, Nature Research reporting summaries, source data, statements of data availability and associated accession codes are available at https://doi.org/10.1038/s41586–019-0979–8.
Additional information
Extended data is available for this paper at https://doi.org/10.1038/s41586–019-0979–8.
Supplementary information is available for this paper at https://doi.org/10.1038/s41586–019-0979–8.
Reprints and permissions information is available at http://www.nature.com/reprints.
Correspondence and requests for materials should be addressed to X.L. or X.-W.B. or C.D.
Publisher’s note: Springer Nature remains neutral with regard to jurisdictional claims in published maps and institutional affiliations.
Reviewer information Nature thanks Golnaz Vahedi and the other anonymous reviewer(s) for their contribution to the peer review of this work.
References
- 1.Wherry EJ & Kurachi M Molecular and cellular insights into T cell exhaustion. Nat. Rev. Immunol 15, 486–499 (2015). [DOI] [PMC free article] [PubMed] [Google Scholar]
- 2.Nurieva R et al. T-cell tolerance or function is determined by combinatorial costimulatory signals. EMBO J 25, 2623–2633 (2006). [DOI] [PMC free article] [PubMed] [Google Scholar]
- 3.Greenwald RJ, Freeman GJ & Sharpe AH The B7 family revisited. Annu. Rev. Immunol 23, 515–548 (2005). [DOI] [PubMed] [Google Scholar]
- 4.Nurieva RI, Liu X & Dong C Molecular mechanisms of T-cell tolerance. Immunol. Rev 241, 133–144 (2011). [DOI] [PMC free article] [PubMed] [Google Scholar]
- 5.Anderson AC, Joller N & Kuchroo VK Lag-3, Tim-3, and TIGIT: co-inhibitory receptors with specialized functions in immune regulation. Immunity 44, 989–1004 (2016). [DOI] [PMC free article] [PubMed] [Google Scholar]
- 6.Crawford A et al. Molecular and transcriptional basis of CD4+ T cell dysfunction during chronic infection. Immunity 40, 289–302 (2014). [DOI] [PMC free article] [PubMed] [Google Scholar]
- 7.Martinez GJ et al. The transcription factor NFAT promotes exhaustion of activated CD8+ T cells. Immunity 42, 265–278 (2015). [DOI] [PMC free article] [PubMed] [Google Scholar]
- 8.Wei G et al. Global mapping of H3K4me3 and H3K27me3 reveals speci city and plasticity in lineage fate determination of diferentiating CD4+ T cells. Immunity 30, 155–167 (2009). [DOI] [PMC free article] [PubMed] [Google Scholar]
- 9.Sen DR et al. The epigenetic landscape of T cell exhaustion. Science 354, 1165–1169 (2016). [DOI] [PMC free article] [PubMed] [Google Scholar]
- 10.Saford M et al. Egr-2 and Egr-3 are negative regulators of T cell activation. Nat. Immunol 6, 472–480 (2005). [DOI] [PubMed] [Google Scholar]
- 11.Harris JE et al. Early growth response gene-2, a zinc-nger transcription factor, is required for full induction of clonal anergy in CD4+ T cells. J. Immunol 173, 7331–7338 (2004). [DOI] [PubMed] [Google Scholar]
- 12.Zheng Y, Zha Y & Gajewski TF Molecular regulation of T-cell anergy. EMBO Rep 9, 50–55 (2008). [DOI] [PMC free article] [PubMed] [Google Scholar]
- 13.Zhong XP et al. Enhanced T cell responses due to diacylglycerol kinase ζ de ciency. Nat. Immunol 4, 882–890 (2003). [DOI] [PubMed] [Google Scholar]
- 14.Rudd CE Cell cycle ‘check points’ T cell anergy. Nat. Immunol 7, 1130–1132 (2006). [DOI] [PubMed] [Google Scholar]
- 15.Schietinger A & Greenberg PD Tolerance and exhaustion: de ning mechanisms of T cell dysfunction. Trends Immunol 35, 51–60 (2014). [DOI] [PMC free article] [PubMed] [Google Scholar]
- 16.Jeon MS et al. Essential role of the E3 ubiquitin ligase Cbl-b in T cell anergy induction. Immunity 21, 167–177 (2004). [DOI] [PubMed] [Google Scholar]
- 17.Oukka M, Wein MN & Glimcher LH Schnurri-3 (KRC) interacts with c-Jun to regulate the IL-2 gene in T cells. J. Exp. Med 199, 15–24 (2004). [DOI] [PMC free article] [PubMed] [Google Scholar]
- 18.Nurieva RI et al. The E3 ubiquitin ligase GRAIL regulates T cell tolerance and regulatory T cell function by mediating T cell receptor-CD3 degradation. Immunity 32, 670–680 (2010). [DOI] [PMC free article] [PubMed] [Google Scholar]
- 19.Sekiya T et al. Nr4a receptors are essential for thymic regulatory T cell development and immune homeostasis. Nat. Immunol 14, 230–237 (2013). [DOI] [PubMed] [Google Scholar]
- 20.Pauken KE et al. Epigenetic stability of exhausted T cells limits durability of reinvigoration by PD-1 blockade. Science 354, 1160–1165 (2016). [DOI] [PMC free article] [PubMed] [Google Scholar]
- 21.Scott-Browne JP et al. Dynamic changes in chromatin accessibility occur in CD8+ T cells responding to viral infection. Immunity 45, 1327–1340 (2016). [DOI] [PMC free article] [PubMed] [Google Scholar]
- 22.Kalekar LA et al. CD4+ T cell anergy prevents autoimmunity and generates regulatory T cell precursors. Nat. Immunol 17, 304–314 (2016). [DOI] [PMC free article] [PubMed] [Google Scholar]
- 23.Chan CJ et al. The receptors CD96 and CD226 oppose each other in the regulation of natural killer cell functions. Nat. Immunol 15, 431–438 (2014). [DOI] [PubMed] [Google Scholar]
- 24.Singer M et al. A distinct gene module for dysfunction uncoupled from activation in tumor-in ltrating T cells. Cell 166, 1500–1511.e9 (2016). [DOI] [PMC free article] [PubMed] [Google Scholar]
- 25.Whyte WA et al. Master transcription factors and mediator establish super-enhancers at key cell identity genes. Cell 153, 307–319 (2013). [DOI] [PMC free article] [PubMed] [Google Scholar]
- 26.Kitagawa Y et al. Guidance of regulatory T cell development by Satb1-dependent super-enhancer establishment. Nat. Immunol 18, 173–183 (2017). [DOI] [PMC free article] [PubMed] [Google Scholar]
- 27.Hnisz D et al. Super-enhancers in the control of cell identity and disease. Cell 155, 934–947 (2013). [DOI] [PMC free article] [PubMed] [Google Scholar]
- 28.Macián F et al. Transcriptional mechanisms underlying lymphocyte tolerance. Cell 109, 719–731 (2002). [DOI] [PubMed] [Google Scholar]
- 29.Roychoudhuri R et al. BACH2 regulates CD8+ T cell diferentiation by controlling access of AP-1 factors to enhancers. Nat. Immunol 17, 851–860 (2016). [DOI] [PMC free article] [PubMed] [Google Scholar]
- 30.Li J et al. Co-inhibitory molecule B7 superfamily member 1 expressed by tumor-in ltrating myeloid cells induces dysfunction of anti-tumor CD8+ T cells. Immunity 48, 773–786.e5 (2018). [DOI] [PubMed] [Google Scholar]
Associated Data
This section collects any data citations, data availability statements, or supplementary materials included in this article.
Supplementary Materials
Data Availability Statement
ChIP–seq and microarray data have been deposited in the GEO, with accession code GSE96969. All microarray and ChIP–seq profiling data and analysis can also be found in Supplementary Tables 1–7.


