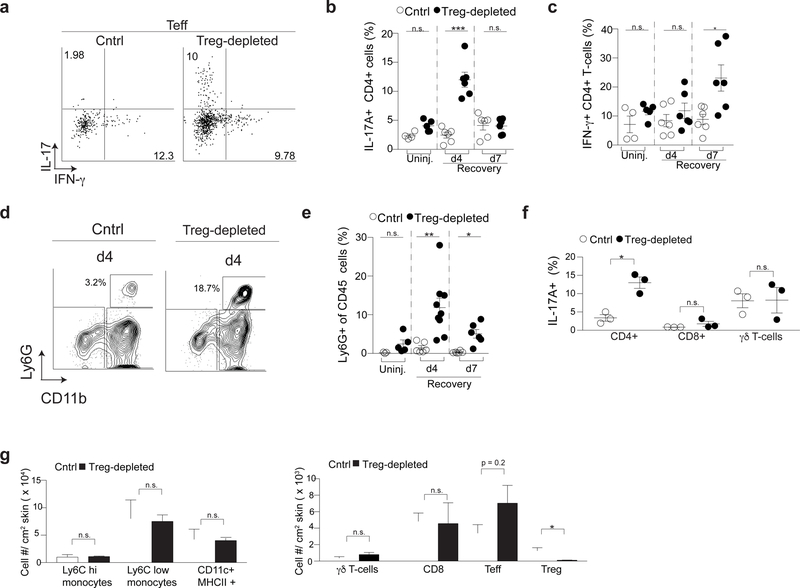
Figure 2. Regulatory T cells preferentially regulate Th17 and neutrophil accumulation in skin early during barrier repair.
(a) Representative flow cytometry plots of IL-17A+ CD4+ (Th17) and IFN-γ+ CD4+ (Th1) T cells in skin following PMA/ionomycin stimulation of single cell suspensions 4 days after skin barrier disruption.
(b) Quantification of Th17 and (c) Th1 cells of Treg cell-depleted mice following skin injury compared to Treg cell-sufficient cntrls (Cntrl) at the indicated times of barrier recovery.
(d) Representative flow cytometry plots of CD11b+ Ly6G+ cells (neutrophils) in the skin 4 days after injury. Plots are pregated on live, CD45+ cells.
(e) Percent of CD45+CD11b+Ly6G+ neutrophils in skin at the indicated times of barrier recovery.
(f) Percent of IL-17+ CD4+, CD8+ and γδ T cells in the skin of Cntrl and Treg cell-depleted mice following PMA/ionomycin stimulation of single cell suspensions 4 days after skin barrier disruption.
(g) Absolute number of the indicated cell types in the skin of Cntrl and Treg cell-depleted mice 4 days after injury.
d4 – day 4; d7 – day 7; Uninj- uninjured skin; For all relevant panels, error bars are +/−SEM. n.s. – no significance; *p < 0.05; **p < 0.01; ***p < 0.001 according to a Student’s t-test. (n=3 mice per group) Data are pooled (b,c,e) or representative (f-h) of two independent experiments. (See also Supplementary Figure 3).

