Abstract
The need for Long-Term Care (LTC) arises in the elderly population, especially those reaching age 65 each year. This elderly population will grow tremendously in the United States over the next decade, resulting in short- and long-term challenges of matching resource capacity with uncertain demand for hospitals and other healthcare providers. This paper describes research involving the development of a simulation model of patient flow in order to understand the relationship between capacity and demand, and to investigate the impacts on performance measures such as average wait times for LTC patients. We propose an aggregate capacity model to consider patient flow among various types of care providers by integrating hospitals, nursing homes, assisted living facilities, and home health care. Using the data including patient demographics and service provider information, we forecast patient demand for LTC. The computational results demonstrate the efficacy of a simulation-based optimisation solution approach for capacity planning.
Keywords: Long-term care, capacity planning, patient flow, discrete event simulation
1. Introduction
Long-Term Care (LTC) includes different types of care services to meet medical and non-medical needs of people who have difficulty caring for themselves for prolonged periods of time as a result of chronic disease or disability. While most LTC is accessible to people of any age, it is a more common need among ageing populations.
The population aged 65 years and older in the United States numbered 43.1 million in 2012 according to Administration on Ageing in Department of Health and Human Services (HHS) (2014) as depicted in Figure 1. This elderly population represented about 13.7% of the US population in 2012 and has increased by 21% (7.6 million) since 2002, compared to an increase of 7% for those who were under 65. As life expectancy increases and more people are entering an age in need of care, the US health care system needs to find sustainable ways to cope with the demographic shift. According to the US Centres for Medicare and Medicaid Services [CMS] (2014) about 12 million Americans over the age of 65 will need long-term care in 2020, increased from 9 million in 2006. A study by HHS estimates that 40% of people reaching age 65 will enter a nursing home at some point in their lives, 10% of whom are expected to stay there five years or longer.
Figure 1.
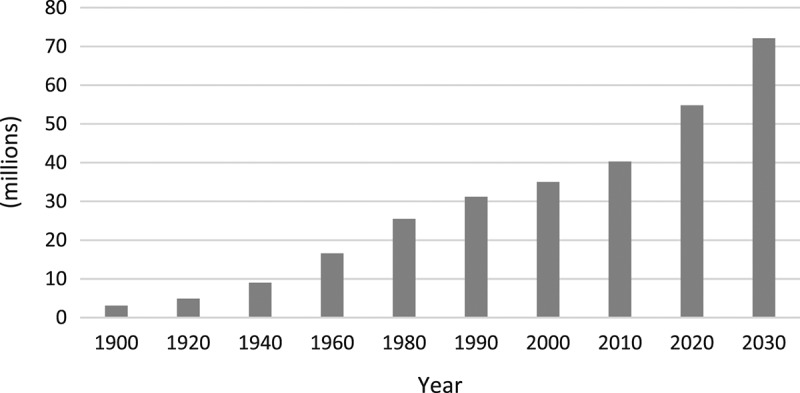
Growth of population aged 65 and over in US. Source: US Department of Health and Human Services.
Under the Affordable Care Act (ACA) in the United States, states can afford new and expanded opportunities including enhanced federal financing by adopting several provisions to improve deficiencies in the nation's long-term care system. The ACA provisions impacting Medicaid Long-Term Services and Supports (LTSS) include new options and financial incentives for states to provide home and community-based services with improved access to and delivery of healthcare. This will affect patient demand for healthcare resources and as a result change patient flows in a healthcare network that includes LTC.
The need for LTC arises mostly in the elderly population with chronic disease or disability, whereby causing limitations from activities of daily living (ADLs) such as walking and eating to instrumental activities of daily living (IADLs) such as driving and shopping. LTC services can be provided in a variety of settings including homes, adult daycare centres, residential/community care facilities, assisted living facilities, and nursing homes. When a serious illness occurs or family care givers are no longer available to provide assistance, independent living may no longer be viable, prompting many patients to require adjustments in their living arrangements by seeking assistance for personal care and resorting to nursing homes and assisted living facilities.
According to the US Bureau of the Census (2014), the number of residents aged 65 and older in the Commonwealth of Kentucky was estimated at 616,000 in 2012, accounting for 14.2% of the state total population, and over 1 million in 2032 (Houser et al., 2012). A large number of the baby boomer generation reaching 65 each year is expected to accelerate the growth within this age group in many counties over the next decade. With the increase in state elderly population and the new healthcare mandate, hospitals and other types of healthcare providers in the region will face short- and long-term challenges of matching fixed resource capacity with uncertain variable demand. Despite this significant implication of the national and regional healthcare systems, however, very little attention has been given to the issue of planning LTC capacity.
Based on a recent publication by the AARP Public Policy Institute (2015) that reports LTC services and support state by state, 81% of the Kentucky Medicaid funds are spent on ageing and disability on institutional care whereas 19% on community-based care in 2009. Moreover, waiting lists for many programmes initiated by the Kentucky Department of Ageing and Independent Living involve waiting times as long as five years. In addition, more than 730,000 Kentuckians are considered unpaid family caregivers often due to the fact that the LTC cost remains high and unaffordable for most middle-income families.
Motivated by these observations, we propose a discrete event simulation model that quantifies the projected demands and capacities, and identifies the corresponding LTC service gap for healthcare provisions in each of the Kentucky Area Development Districts (ADD) areas (see Figure 13 in Appendix A1). A simulation-based optimisation solution approach for demand forecasting and system capacity planning is developed to provide better service to LTC patients. Furthermore, with the use of the model, we investigate the impacts of statewide improvements on a Kentucky LTC system.
Figure 13.
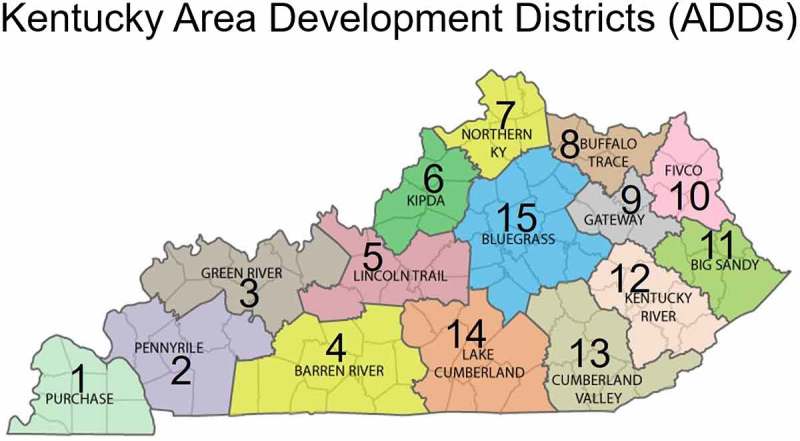
Kentucky area development districts (ADDs).
In our review of prior research, there exist few simulation studies that have addressed the healthcare system in an integrated manner. Our aggregate and quantitative approach provides insights to the current and future LTC status of a region, and exploits large-scale data to obtain tractable solutions. Overall, the results of our proposed model and solution approach discussed in this study demonstrate potential impacts on patient wait time, resource utilisation, and provider service quality by jointly considering patient inter-flows among several healthcare facility types in a long-term healthcare network.
2. Related literature
Only a handful of modelling and solution approaches have been proposed to address the problems related to the separate healthcare operational processes in LTC. In contrast, a vast majority of research with regard to managing healthcare capacity is devoted to acute care facilities. For example, some studies have focused on capacity planning for specific medical services such as intensive care units (Ridge et al., 1998) and bed capacity in hospitals (Harper & Shahani, 2002), while other studies have modelled bed allocation for various healthcare service settings such as a public healthcare delivery system (Kao & Tung, 1981) and a hospital inpatient department (Vassilacopoulos, 1985).
Understanding the progression of patients through healthcare facilities would provide an insight about specific patient needs to deliver quality healthcare, and further help healthcare providers better allocate resources (Cote & Stein, 2000; Fetter & Thompson, 1968). A patient flow model can, in turn, effectively measure the impact of different care and treatment decisions on resource utilisation, patient outcomes, and costs (Davies & Davies, 1994). In particular, the outflow of patients from acute care into other healthcare facilities remains important when hospitals face severe bed blockages due to the inability to expedite discharge processes of their patients. Maintaining sufficient capacity at a downstream level and determining an optimal policy regarding the discharge of hospital patients waiting for placement in LTC can mitigate this type of congestion (Patrick, 2011; Patrick et al., 2015). In the same vein, the optimal capacity for publicly funded community-based LTC facilities was studied using optimal control theory (Lin et al., 2012).
A substantial amount of chronic care takes place outside hospitals (Bodenheimer et al., 2002), and notable impacts of improvement in community-based healthcare on the outcomes of various chronic diseases have been reported (Tsai et al., 2005). Hare et al. (2009) proposed a deterministic Markov model of the home and community care service system for patients with various healthcare needs including acute and chronic disease. The model was used to predict changes in the age demographics as well as the relationship between age and health status, and it provided strategic provincial and aggregate level decisions without considering patients individually and any specific service level. A similar Markov model by Kucukyazici et al. (2011) was also used to provide an analytical framework for designing community-based care to patients with a specific chronic disease. The proposed approach facilitated identifying the patterns of care, assessing the care provider visits as well as patient characteristics, and estimating the potential influence of policy interventions on patient outcomes.
Developing a large-scale network of LTC requires properly predicting future demand and planning LTC service resources. Cardoso et al. (2012) presented a simulation model to develop such networks and considered demand uncertainty by combining various scenarios with probabilistic sensitivity analysis using Monte Carlo simulation. The model used socio-economic and health characteristics of the population at the small area level to define the need for LTC. In order to better estimate uncertain demand for LTC, it is necessary to capture patient flows accurately throughout a healthcare network. A simulation approach to healthcare problems can provide the basis for better understanding of solutions by examining the outcomes of making different decisions. Evidently, simulation has been used in a wide range of healthcare applications such as optimal allocation of hospital resources (Brailsford & Hilton, 2001), operational planning of emergency departments (Connelly & Bair, 2004), and assessing the impact of long-term care policies on informal care providers (Ansah et al., 2013). A patient flow model using simulation methodology has demonstrated that it can effectively assess a complex healthcare system and contribute to making critical decisions and planning new policies that improve patient wait times, reduce length of stay (LOS), and facilitate patient throughput (Jun et al., 1999). Zhang et al. (2012) solved a capacity planning problem for long-term care and developed a decision support system (DSS) for use in practice. Their approach used demographic and survival analysis for demand forecasting, and discrete event simulation and optimisation to achieve target service levels of wait time.
3. Model development
We develop a discrete event simulation model using commercial software (Simio) in conjunction with a simulation-based optimisation solution approach for demand forecasting and capacity allocation. The proposed LTC patient flow model integrates various healthcare provider types beyond LTC facilities, and captures patient flows between the facilities in order to estimate key performance measures of service levels, e.g., patient wait time, bed utilisation, and number of patients waiting beyond a threshold. In this section, we describe the use of input data as well as a patient flow system of a healthcare network used for the proposed model.
3.1. Input data
Two data-sets used for this study including patient demand and service provider information were obtained from The Office of Health Policy under the Kentucky Cabinet for Health and Family Services. The Kentucky Inpatient Hospitalisation Claims Files is an annual reporting of each patient encounter in a Kentucky hospital including patient demographic information, hospital identification, and detailed patient care data including discharge and transfer. For example, an annual data-set contains about 650,000 records, each of which has up to 100 attribute fields (columns) to fully describe an inpatient stay. The Kentucky Claims Data-Set includes hospital (inpatient, emergency department), ambulatory surgical care, long-term care, home health, and hospice services pursuant to administrative regulations. Each record in these reports provides information by provider or facility, and contains the number of licenced beds, beginning census, admissions, discharges, ending census, total patient days, occupancy percentage, age distribution, and payor source. These records are organised by provider type and Area Development District (ADD) which comprises several adjacent counties.
Furthermore, patient data from the reports are analysed in four groups; by gender (male and female) and by age (≥65 and < 65 years). The type of discharge or admit source are designated as home, hospital, LTC, hospice, and other. The data reporting period covered the five years from 2008 to 2012, inclusively, for all facilities complying with licencing and regulation reporting requirements. The statistical data collected from each individual facility are aggregated by county, ADD, and state total.
Figure 2 shows a trend in both the hospital patient visits and the long-term care patient admissions that occurred in Kentucky. While the number of hospital patient visits are decreasing, long-term care visits are increasing over the years. The hospital visits were approximately 650,000 in 2008 and 623,500 in 2012, a decrease of 4.1% over the 4 year period. During this same time, long-term care admissions increased from approximately 54,500 to 58,300, resulting in an increase of nearly 7%.
Figure 2.
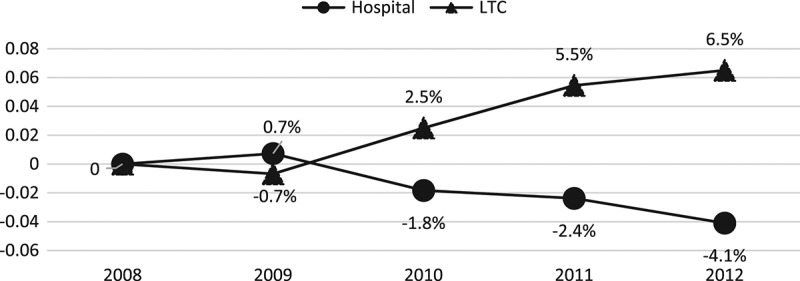
Cumulative percent change in patient admissions for hospital and LTC.
Figure 3 depicts an overview of the modelling process. We utilise two sets of database to import and process data for the simulation model. The first set of data including bed capacity, length of stay, admission, discharge, ADD, provider type, and year comes from the annual state report. The second data-set is obtained from US Census data to generate patient arrival rates reflecting population growth, and is subsequently used for forecasting LTC demand.
Figure 3.
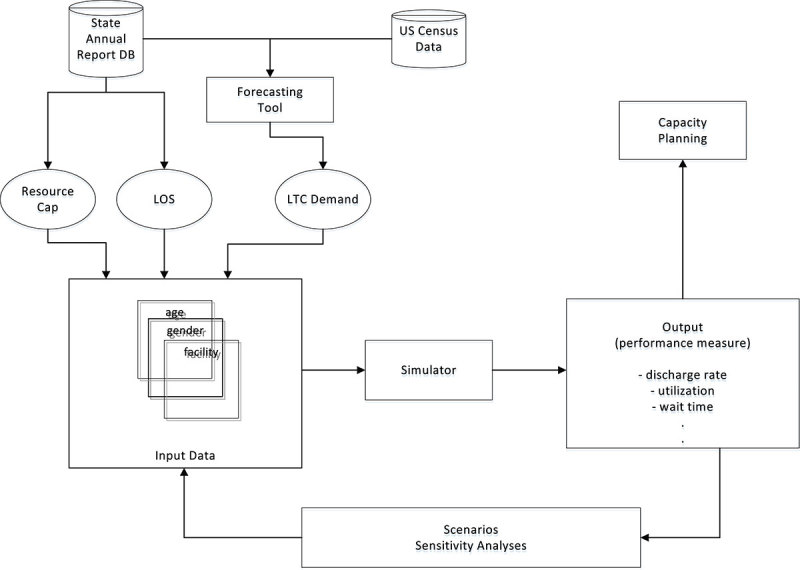
Model process overview.
3.2. Patient flow
All healthcare providers including LTC facilities are licensed by the state through the Office of the Inspector General (OIG) and provide one or more of the different types of care. Acute Care hospitals are defined as facilities providing medical or surgical services including physician services and continuous nursing services for the diagnosis and treatment of patients who have a variety of medical conditions. They are also capable of providing care on an immediate and emergent basis through an established Emergency Department as well as continuous treatment on its premises. Long-Term Care facilities include nursing homes, i.e., Skilled Nursing Facilities (SNF), and Intermediate Care Facilities (ICF), which typically have inpatient beds with doctors, nurses, and health care aides available 24 h a day. They provide medical services, assistance with ADLs, as well as continuous nursing services. A majority of skilled care patients need treatment similar to inpatient care but not continuous hospital services, e.g., recovering from a surgery or post-acute care rehab. Intermediate care patients are those who have completed skilled care and cannot rehab to the point that they are discharged to a higher level of independent living such as home, or to an assisted living facility. Similarly, Assisted Living Facilities (ALF) provide varying degrees of health-related services, and assistance with IADLs, for patients who require care and services beyond the level of room and board due to their mental or physical conditions, but not to the degree of care and treatment which a hospital or skilled nursing facility is designed to provide. For example, they coordinate personal care services with trained staff, supervise resident ADLs, and assist with the administration of medication. Home Health services refers to a combination of health care and social services, e.g., skilled nursing care, physical therapy, and continued occupational services, provided to individuals in their homes or communities. Patients residing in ALFs range from independent living to those whom are under the care of a doctor and their care plans are established and reviewed regularly by a doctor and coordinated by a home health care agency. Hospice services are typically given at home, SNFs, ALFs, or hospice care facilities, and include symptom relieving care and supportive services addressing the physical, spiritual, emotional, and economic needs of terminally ill patients and their families. The type of services range from medical care and nursing care to counselling and social services.
We focus on patient flow among the healthcare provider types, especially those in need of LTC service along their pathways. Figure 4 illustrates the flow of LTC patients considered along with the queueing discipline and interrelations of different facilities in the model. An entity (or a patient) is generated based on its demand arrival distribution, and its assigned attributes of age and gender. A patient seeks care as an acute care patient or directly enters under the long-term care needs, and the path of their care allows for transition among the different types of care which is modelled by assessing transition probabilities (λ’s within LTC facilities; μ’s discharge rates; and τ’s between acute care and LTC facilities) in accordance with the patient data-set including Discharged from and Discharged to. For example, in addition to new demand for hospital care, patients in need of acute care are populated arriving with a rate of τ2 (defined by facility type origin and destination) from other types of care including LTC, i.e., SNF and ALF. A patient will occupy any bed if it is available, or wait in a queue otherwise until the next bed is freed up. Individual facility location (or building), whether hospital, SNF, or ALF, is represented in the model as a single-queue resource with the capacity equivalent of its number of beds. On the other hand, home health care is assumed to have enough capacity, and thereby there is no wait time involving with its patient demand. When each patient entity is generated for a particular type of care, it is randomly assigned to one of the corresponding facilities. The queueing discipline used in the model is First-In First-Out (FIFO) for all facility types. The LOS service time for each patient differs according to the patient group by ADD, age, and gender. When the care for a patient is completed, the patient is either transferred to another healthcare-type facility or discharged home.
Figure 4.
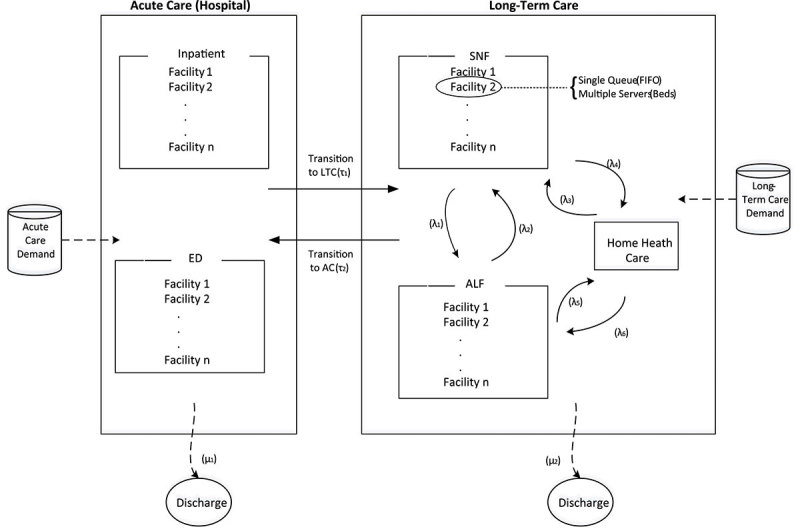
Patient flow in a healthcare network.
4. Methodology
Patient data were analysed in four groups by gender and age in order to estimate demand and LOS for each patient class. In this section, we describe the methods used for forecasting patient demand as well as for fitting sampling distributions to LOS data.
4.1. Patient demand
Based on the population data provided and projected from 2010 to 2050 by age, gender, state ADDs, and counties, we estimate the volume of patient demand for future years. The data shows that the volume of demand varies by age, gender, district as well as healthcare-type facility.
A Non-Stationary Poisson Process (NSPP) is a Poisson process with rate parameter which changes over time t. If a system experiences arrival loads that change within the simulation time horizon, a NSPP facilitates modelling stochastic time-varying arrival patterns and capturing the change of system behaviour accordingly (Lewis & Shedler, 1979; Ross, 2006). For each patient arrival stream, a more accurate representation of the buildup of arrivals over time is achieved using an NSPP with a piecewise-linear rate function such that the arrival rate varies continuously as a function of time.
The patient demand arrival generation procedure is described in Equations (1)–(4) as follows.
Step 1. Let , , and denote patient demand, population size, and the ratio of patient size to population for group d in year t, respectively, then we have
| (1) |
Using the historical patient demand and population census data for five years between 2008 and 2012, we initially generated for each patient data group d = 1, 2, 3, and 4 based on age and gender, and t = 2008 to 2012.
Step 2. An exponential smoothing method is used to analyse time series data to make forecasts by assigning exponentially decreasing weights over time.
| (2) |
where α is a weight and is the resulting smoothed statistic of . By substituting iteratively for , we have a five-year exponential moving average
| (3) |
where
Step 3. To find the estimated patient demand in year t, we multiply the ratio smoothing factor by the projected forecast population
| (4) |
where is the patient demand estimate for group d in year t and accounts for the increase in the number of patients, reflecting the population growth.
Step 4. Patient demand arrival follows NSPP with the mean arrival rate varying at year t for patient group d, and is adjusted accordingly based on resulting from Step 3.
4.2. Length of stay
All licensed healthcare providers are required to report to the state agency data on cost, quality, and outcomes of healthcare services provided in Kentucky. Among the available historical data, the length of stay data during the reporting period is collected by facility type (e.g., hospital inpatient). LOS is one of the common statistics measured and predicted by healthcare providers and is often used for the purpose of operational improvement, resource planning, and quality control. In this study, LOS is used to model a service time from admission to discharge that a patient spends at each healthcare-type facility.
Determinant factors of LTC demand, in particular, are known to vary by both demographical and geographical levels (Waldo & Lazeby, 1984). Consequently, the pattern of LOS can widely differ among the patients flowing between multiple types of LTC services at the small area level (Xie et al., 2005). A typical LOS distribution is skewed to the right (i.e., a long-sided tail on the right side) due to some patients staying for an extended period of time, resulting in higher LOS values than average. Harrison and Escobar (2010) reported that multistage models are effective to explain this type of skewed LOS distribution for a broad mixed group of patients as well as a restricted group of patients conditioned on treatment, diagnosis, or severity of illness. Given that there are various patterns of LOS distribution, Marazzi et al. (1998) tested three widely used statistical models (Lognormal, Weibull, and Gamma distributions) to fit to a large amount of LOS data over the several years. The study was designed to estimate homogeneous parametric models for LOS data grouped by diagnosis and also to suggest trimming rules to overcome the cases of having outliers.
Similar to the patient arrival demand, a further analysis of LOS data shows that there is a significant difference by gender and by age, let alone patient disease conditions themselves, among the residents admitted to an LTC facility (Forder & Fernandez, 2011). Using a goodness-of-fit test, we determine statistical distributions to obtain best fit to the average LOS data, and the input parameters corresponding to facility type, gender, and age are estimated accordingly. The data used for these distributions represent all hospital stays in Kentucky recorded in 2008 through 2012, resulting in 60 different fits specific to ADD, gender, and age. Table 1 shows a sample of the hospital LOS distributions.
Table 1.
Hospital LOS distributions in selected ADD’s by Each Patient Group (days).
| Patient group 1 | Patient group 2 | Patient group 3 | Patient group 4 | |
|---|---|---|---|---|
| (female, < 65 years) | (male, < 65 years) | (female, ≥ 65 years) | (male, ≥ 65 years) | |
| ADD3 | 0.5+Lognormal(3, 3.2) | 1+116 * Beta(0.6, 21.7) | 0.5+Gamma(5.2, 2.4) | 0.5+Gamma(5.4, 2.3) |
| ADD8 | 0.5+Lognormal(2.1, 1.9) | 0.5+Lognormal(2.1, 2.1) | 0.5+Erlang(3.7, 3) | 0.5+Gamma(4.2, 1.5) |
| ADD9 | 1+Exponential(2) | 0.5+Lognormal(2.6, 2.8) | 0.5+Gamma(4.8, 2.4) | 0.5+Gamma(3.9, 2.3) |
| ADD10 | 1+Exponential(2.7) | 0.5+Lognormal(3.5, 4.1) | 0.5+Gamma(5.3, 2.3) | 0.5+Gamma(5.8, 2.2) |
| ADD14 | 1+103 * Beta(0.7, 31.4) | 0.5+Lognormal(3.3, 3.8) | 1+Exponential(5.1) | 0.5+Gamma(4.4, 2.3) |
4.3. Demand estimation
The NSPP demand process is validated first in order to use LTC patient demand in future years as input to our simulation model. We estimate ratio parameters using the patient demand data from 2005 to 2009 with α = 0.5 and validate them by comparing the estimated and actual demand values from 2010 to 2012 as in Table 2. The selected geographic region for data statistics is ADD 6 which includes Jefferson, Oldham, Trimble, Henry, Shelby, Spencer, and Bullitt counties in Kentucky.
Table 2.
Comparison of actual and estimated LTC demand (number of patients) by gender and age in ADD 6.
| (2010) | (2011) | (2012) | ||||
|---|---|---|---|---|---|---|
| Actual | Estimated | Actual | Estimated | Actual | Estimated | |
| Female | 8,882 | 9,014 | 9,256 | 8,969 | 9,550 | 9,163 |
| Male | 6,578 | 6,634 | 6,857 | 6,851 | 7,074 | 6,920 |
| <65 | 2,031 | 1,976 | 2,122 | 2,028 | 2,438 | 2,477 |
| ≥65 | 13,429 | 13,016 | 13,991 | 13,882 | 14,186 | 13,917 |
First, the actual demand in each category (female, male, <65, and ≥65) increases on average by 3.7, 3.7, 9.7, and 2.8%, respectively, from 2010 to 2012, showing the increasing trend of demand for LTC. Note that the demand in age of 65 or older is about six times larger than that in ages younger than 65. Also, the ratio of female to male patient demand is an average of 1.35 during the same period. The gap between estimated and actual demand for each group per each year is between −4.4% (underestimated demand) and 1.6% (overestimated demand).
With the demand rates generated by NHPP above, future LTC patient demand over the planning horizon can be further estimated. We considered multiple scenarios where the current LTC capacity (i.e., total number of LTC licenced beds available in ADD 6) was assumed to be annually increased by 0% and 3%, and then compared to projected LTC patient demands reflecting population increase for 10 years from 2013 to 2022.
Figure 5 compares the projected LTC demand with the bed capacity of two scenarios in ADD 6. The estimated demand in 2013 is 5,117, resulting in bed occupancy rates of 85.6% comparable to the actual 85.1% from the state report. As the demand increases over the next five years if the capacity remains unchanged (0% increase), the demand exceeds the current capacity after 2018, and it is necessary to consider more resources to accommodate potentially overflowing patients in need of LTC in the region or their waiting times are expected to grow rapidly over the following years. On the other hand, 3% annual increase of capacity would help keep up with the demand projection through 2022 over the planning horizon.
Figure 5.
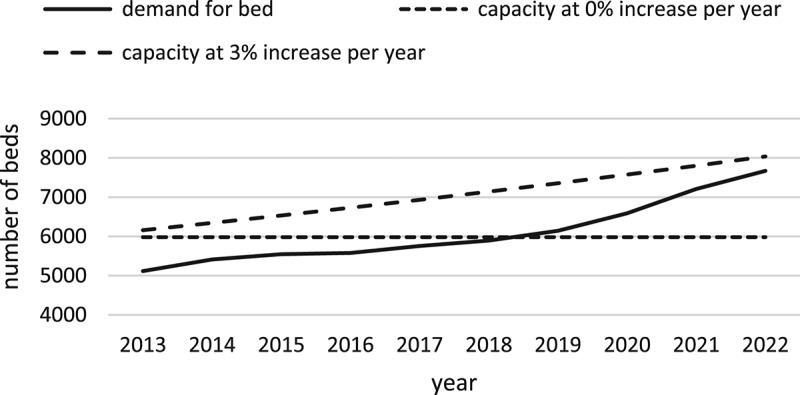
LTC demand with capacity scenarios for ADD 6.
5. Simulation experiments
The simulation model begins with empty state in the system, and three preliminary replications were run for multiple years in order to determine the warm-up period, the steady-state utilisation levels of SNF and ALF were observed after 348 and 295 days each. By taking the longer period and taking a conservative approach, one year is set as the warm-up period. In order to determine an appropriate number of replications needed, we use the following approximation from Law (2013).
where γ′ = γ/(1 + γ) is the adjusted relative error, n is the initial number of replications, and i is the number of replications to determine by the threshold γ. For a given replication n, and S 2(n) represents the sample mean and sample variance, respectively. Having γ = 0.05or γ′ = 0.048 and a confidence interval of 95%, nine replications i = 9 was selected to have the values of δ (0.042, 0.033), which are less than the predefined γ′ value of 0.048 when estimating the sample average utilisations of SNF and ALF (0.893, 0.687).
5.1. Model validation
The simulation model developed in this study is validated to ensure that the model behaves in agreement with the real system, thus, can be used effectively for prediction. With bed occupancy rates being the available statistics reported to our obtained data-sets, they are used as bed utilisation for validation, and Figures 6 and 7 compare the observed and simulated bed utilisations from 2009 to 2012 by LTC facility type (SNF, ALF).
Figure 6.
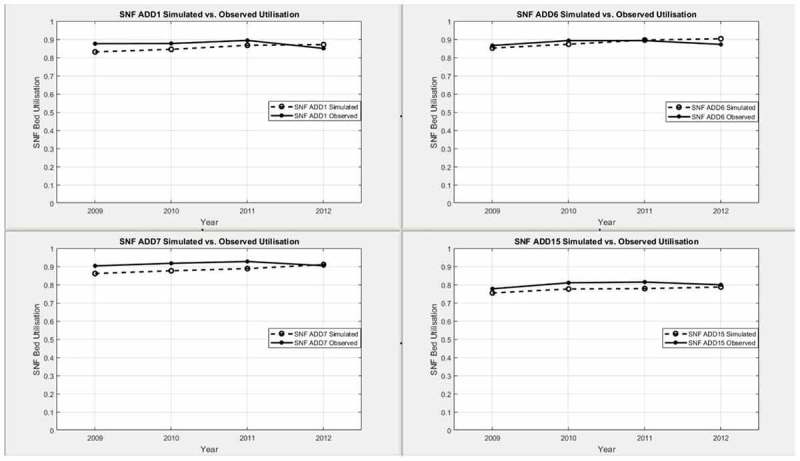
Simulated and observed SNF bed utilisations by ADD.
Figure 7.
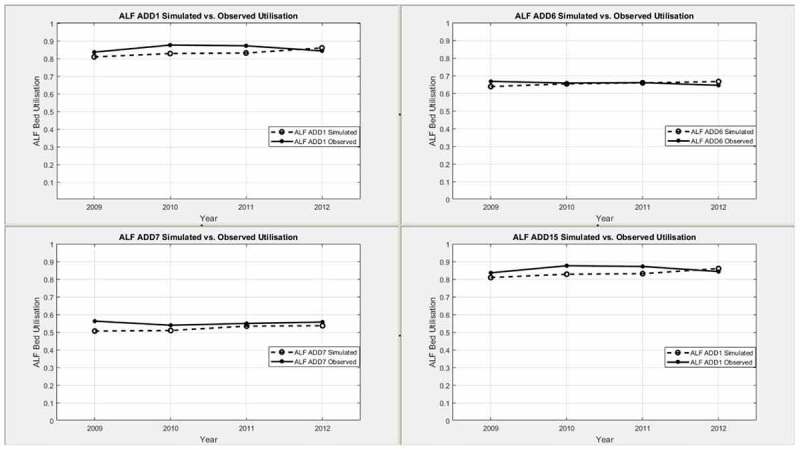
Simulated and observed ALF bed utilisations by ADD.
Across the ADDs, the simulated utilisation for SNF or ALF beds are steadily rising during the period 2009–2012 due to the patient demand increases. For the same span of time, the observed utilisations for SNF or ALF show mostly similar trends of increase. In either facility type case, the simulation model slightly underestimates the actual values. To better understand the gap between them, we assess the percent deviation, which is a measure of relative deviations of model estimates from actual values, by calculating where and O u are simulated and observed utilisations, respectively. With the exception of ALF bed utilisation in 2009 for ADD 7, all other deviations between simulated and actual utilisations are less than 5%.
Additionally, Figure 8 provides the variations of percent deviation in reference to 0%. The percent deviation averaged by ADD1, ADD6, ADD7, and ADD15 over four years is −2.31% for SNF bed utilisation, and that for ALF bed utilisation is −3.38%. The deviations between model estimates and actual observations are determined to be reasonable for validating the model.
Figure 8.
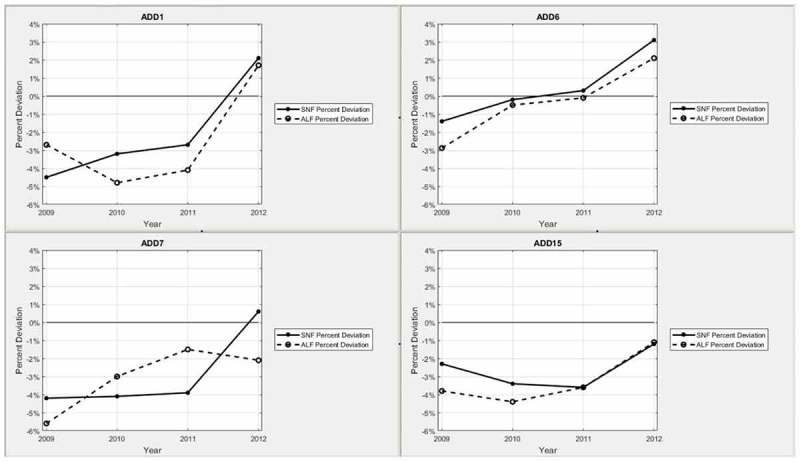
Percent deviation between SNF and ALF Bed utilisations by ADD.
Computational experiments of the simulation model hereafter in the next subsections are conducted such that the length of each simulation run is multiple (5, 10, and 15) years in addition to one year of the warm-up period. Statistical outputs of performance metrics are obtained after nine independent replications.
5.2. ADD analysis
Output measures are the average number of days a patient waits for an LTC bed, and the total average days a patient spends in the system if it involves care in an LTC facility. Using the average days of waiting for an LTC bed, a service quality is determined. In addition, the utilisation of available beds in ADD for each facility type is reported. The number of days waiting for a bed and the number of days spent in the system are reported on the four patient types of age and gender. The model is run based on 5, 10, and 15-year forecasting of patient growth. The preliminary results indicate that the maximum difference of waiting times by gender is only a few days. While, given this negligible difference, the results based upon gender are averaged, age remains as a significant factor.
5.2.1. Wait times
With the primary focus of this study being on patient flow that involves LTC, we consider the effect of patient growth on wait time for a bed with the forecast period of 10 years. Patient entities are divided into four age groups: G1, G2, G3, and G4 denote each class of patients whose ages range from less than 50, 50–64, 65–80, and greater than 80, respectively. Table 3 presents the results of average wait times by these patient age groups as well as by facility types (SNF, ALF) and ADDs. In addition, the half width of 95% confidence interval for each output statistic is also provided.
Table 3.
Wait times (days) by patient age group and facility type.
| ADD 1 | ADD 6 | ADD 7 | ADD 15 | ||
|---|---|---|---|---|---|
| SNF | G1 | 35.6 | 28.5 | 27.0 | 94.2 |
| ±1.9 | ±0.8 | ±1.2 | ±3.2 | ||
| G2 | 33.2 | 30.9 | 29.3 | 93.2 | |
| ±0.7 | ±0.6 | ±0.7 | ±2.5 | ||
| G3 | 36.3 | 28.8 | 27.4 | 94.8 | |
| ±0.4 | ±0.5 | ±0.8 | ±1.8 | ||
| G4 | 39.1 | 31.1 | 28.1 | 96.7 | |
| ±0.4 | ±0.6 | ±0.5 | ±1.6 | ||
| ALF | G1 | 74.9 | 18.5 | 16.5 | 104.7 |
| ±2.1 | ±0.8 | ±0.9 | ±4.4 | ||
| G2 | 76.0 | 21.7 | 15.1 | 113.7 | |
| ±1.5 | ±0.5 | ±1.2 | ±3.8 | ||
| G3 | 75.1 | 21.9 | 19.5 | 119.8 | |
| ±2.2 | ±1.0 | ±1.4 | ±4.2 | ||
| G4 | 71.2 | 22.8 | 19.0 | 107.1 | |
| ±1.7 | ±0.7 | ±1.8 | ±3.3 | ||
Based on current bed availability in a given ADD, as the ageing population is projected to increase over the forecasting period, the demand, thus wait time, for a bed rises. The lower wait time in ADD 6 or ADD 7 in comparison with the others are attributable to adequate supply of bed capacity in metropolitan areas despite their large populations. This is consistent with the recent trend of migration of more acute as well as LTC facilities leaving from rural to urban areas because of financial deficits in Kentucky. In contrast, for example, ADD 15 incurs the longest waiting times 95.7 days for SNF and 116.3 days for ALF on average. For ADD 1, the average wait time for ALF is almost twice as that for SNF. This is because there exists very limited capacity of ALF beds available in the region which is predominantly rural areas. It is noted that patients in the age group G4 experience longer average wait times with 3–6% than the others for SNF whereas the average wait times by the patients in G3 for ALF are 4–10% higher than the remaining groups. Additionally, while no priority is assigned to a specific age group, the patients of younger age groups (e.g., G1) show larger variations, which is due in part to a small sample size of population in this group for LTC demand compared to other age groups.
5.2.2. Service quality
Service quality is a measure of the likelihood that a patient, who needs care in an LTC facility, is to be placed in a bed within a desired number of days. Two thresholds for maximum days are used to compare the impact on service quality: a three-day wait and a six-day wait. In Equation (5), service quality is measured by the probability of patient wait time less than a threshold.
| (5) |
where denotes the estimate of average wait time for a given bed capacity over t years, β denotes the weight time threshold in days, and δ denotes a desirable service quality limit. This requires the probability of patients receiving LTC service within β days to be greater than or equal to δ.
As evident from Figure 9, the service quality in each ADD is reduced for longer time periods. As such, the decrements averaged over four ADDs are 27.6 and 13.9%, respectively, from 5 to 10 year forecast and from 10 to 15 year forecast. Moreover, on average across ADDs, the difference of service quality between three-day and six-day thresholds is 11.8% for the 5 year forecast, 8.4% for the 10 year forecast and 6.2% for the 15 year forecast.
Figure 9.
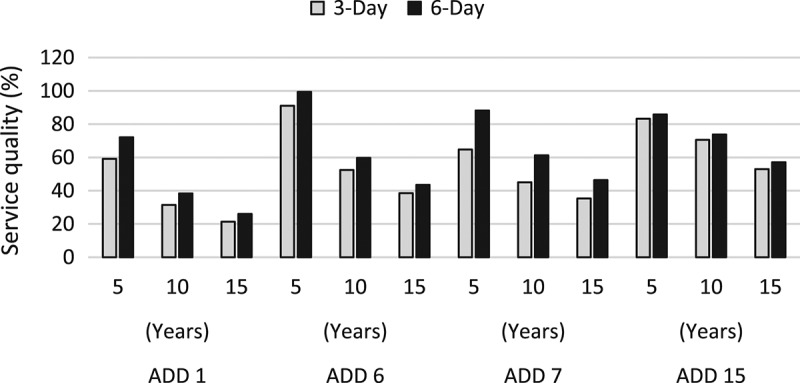
Average service quality forecast using two wait time thresholds.
Taking ADD 6 for example, service quality at the 5 year forecast based on a six-day threshold is nearly 100%. However, as the forecast period extends to 15 years, the service quality drops substantially to just above 40% as the wait time for a bed increases well beyond the threshold limit. The service quality for ADD 6 diminishes by 52.5% from the 5 year forecast to the 15 year forecast, which is the largest reduction amongst the ADDs. Due to unbalanced LTC capacity and demand in the rural area, ADD 1 marks the lowest service quality throughout the forecast periods in either case of three or six-day wait time limit. This is ascribed to the high utilisation rate of the SNF bed capacity and further exacerbated by the 100% utilisation of the ALF bed capacity.
5.3. Capacity planning
We investigate the relationship of bed capacity to service quality, and focus on planning a sufficient number of beds to ensure that δ × 100 percent patients are placed in service care within β days each year. First, service quality levels are examined when the bed capacity increase is held at a constant rate over the time periods. Second, sensitivity analyses are conducted to determine how much service quality can improve in accordance with capacity increase, and further, how LOS change affects service quality. Across all experiments in this section, ADD 6 is used for further analyses of capacity planning.
5.3.1. Capacity rate increase
As demand for an LTC bed increases over the 15 year forecasting period, service quality is expected to decrease unless more bed capacity is added and commensurate with the demand increases. To measure the model sensitivity in response to this change, we test scenarios with different levels of annual bed capacity increase in SNF and ALF facilities over the forecasting period. Figure 10 demonstrates the effects on service quality (β = 6) as the bed capacity adjusts to meet the increasing demand. Each line represents a scenario of increasing LTC bed capacity at a specific rate, while the capacity of acute care resources remains unchanged as the baseline.
Figure 10.
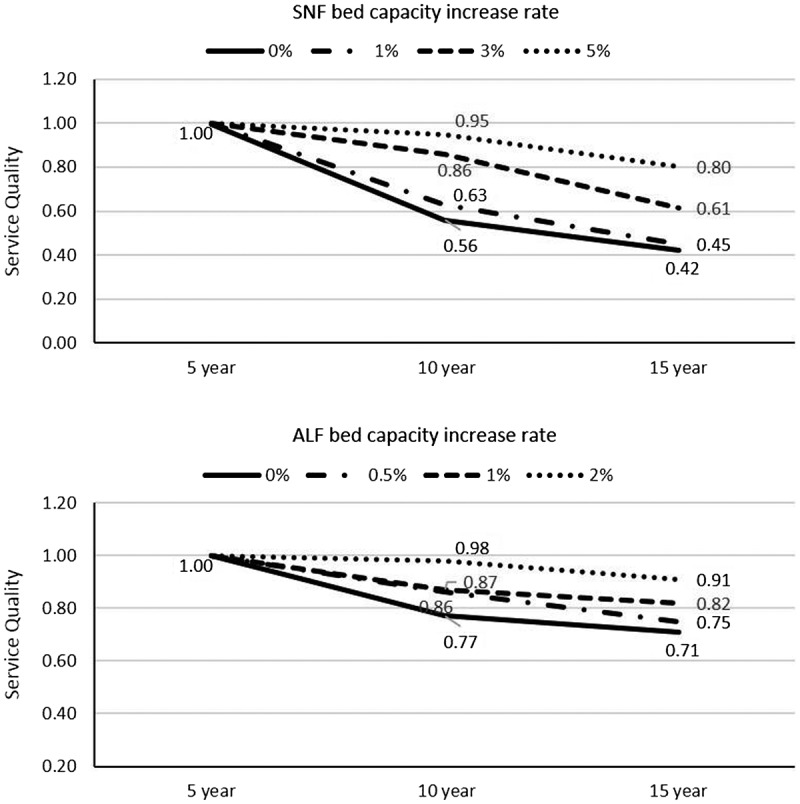
Forecast of service quality with capacity rate change for SNF and ALF in ADD 6.
The service qualities for both cases are high at the 5 year forecast in 2020. However, over the next forecast periods in 2025 and 2030, 1% annual increase of capacity makes little difference to improve service quality on either side when compared to the baseline. Despite the capacity increases considered in the scenarios, they clearly show downward trends in service quality as time passes. As indicated from the results of wait times, there exist different needs for additional capacity between SNF and ALF. Hence, the experiments are designed to accommodate varying capacity rate increase for each facility type. In particular, because of projected longer wait times, higher capacity increases are considered in the scenarios for SNF in comparison with ALF (e.g., 0, 1, 3, and 5% for SNF; 0, 0.5, 1, and 2% for ALF). Five per cent annual increase of SNF bed capacity is expected to maintain the service quality level greater than or equal to 80% through forecast years, whereas 3% annual increase would not be able to keep up the same level in 2030. On the other hand, 1–2% annual increase of ALF bed capacity is estimated to support future demand at a sustainable level, while retaining the service quality of at least 80% at the 15 year forecast.
5.3.2. Sensitivity analysis
Next, multiple scenarios are designed to allow bed capacity in ADD 6 to vary each year and investigate the sensitivity of the model to service quality. Specifically, we consider annual LOS changes by 0% (baseline), 1%, 2%, and −1% for LTC patients, and find the minimum bed capacity of SNF required each year to meet a predetermined service level (β = 3, δ = 0.8). OptQuest, an optimisation solver embedded on Simio, is used to search for an optimal solution. OptQuest employs artificial neural networks, tabu search, and scatter search, and combines them into a single search heuristic (Kleijnen & Wan, 2007). Initial suggested values of input combination, serving as starting solutions, affect the efficiency of its search process. Our model selects the simulation output of service quality as an objective value to minimise, while satisfying the constraints of bed capacity. Further, we limit the minimum and maximum number of replications as 10 and 50, respectively. With the initial capacity level of 5,886 in Figure 11, the baseline requires a capacity increase from 2021 to maintain 80% of the service quality, while the case of LOS + 1% needs a larger increase starting earlier from 2020 and up to 6,589 in 2025. When compared to the scenarios of LOS + 2%, the similar trend entails increases in early years and larger bed capacities. On the other hand, managing to reduce patient stays with better treatment and efficient care as in the case of LOS −1% can delay the need to increase minimum capacity levels down the planning horizon.
Figure 11.
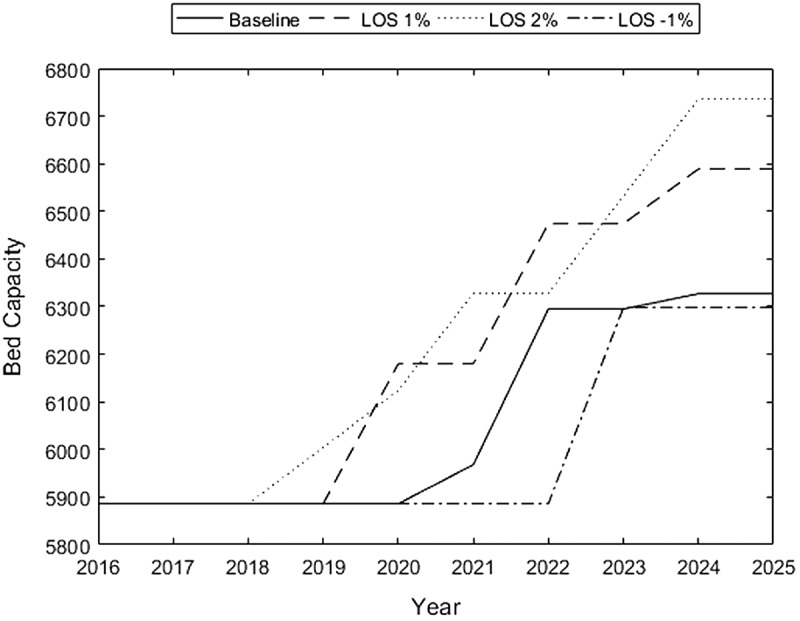
SNF capacity levels for LOS changes in ADD 6.
Furthermore, as a point of particular interest to policy-makers, two policies are examined; proactive and reactive adjustments of bed capacity. A reactive adjustment policy, as previously represented by the baseline scenario, changes capacity levels only in response to demand increase each year, whereas a proactive adjustment policy incrementally adds bed resource in advance, anticipating likely demand increase in a long-term over the future. The proactive policy case indicates that it requires increasing the bed capacity annually by 0.2% in order to stay above the minimum service quality of 80% in Figure 12. In contrast to gradual capacity increase in the proactive policy scenario, a large uptick is observed from 2021 to 2022 for the reactive policy. More importantly, when adopting the proactive policy, the resulting minimum capacity at the end of 2025 is lower by 5.3%.
Figure 12.
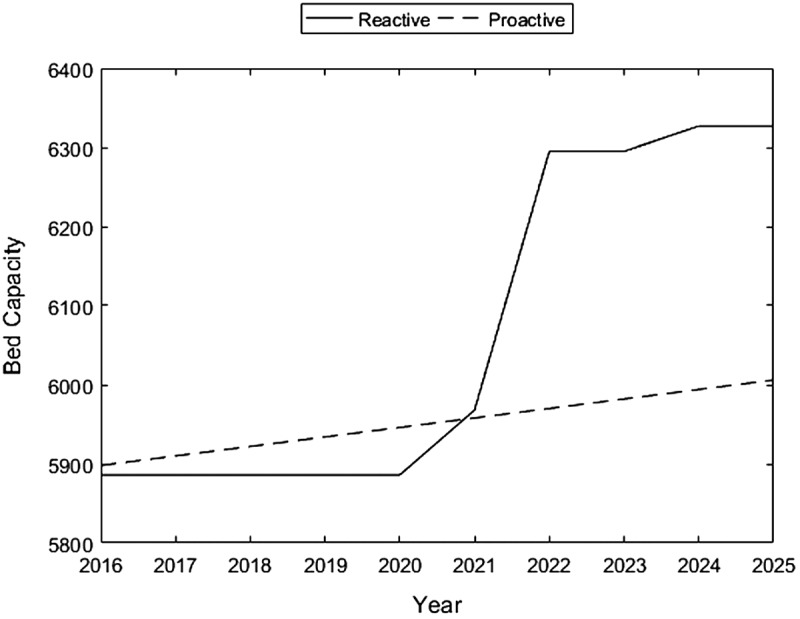
SNF capacity levels comparing policies in ADD 6.
6. Discussion and conclusion
To facilitate capacity planning for the Kentucky LTC system, we analyse patient flow at the individual patient level by exploiting the flexibility of a large-scale discrete event simulation model of a healthcare system. In particular, the aggregate approach allows us to obtain current and future estimates of key system performance measures such as wait times, utilisations, and service qualities.
Patient demographics and available healthcare facilities in each ADD are two factors that have a dominant effect on the performance of healthcare system. The results across ADDs suggest a substantial increase in wait time for an LTC bed over a 15 year population forecast. The largest percentage increase is observed in ADD 6 with an average wait time of 21 days at 15-year forecast. Using current bed capacity, an increase in population demand for LTC care results in driving up utilisation rates. The relative increase in ADD 1, ADD 6, ADD 7, and ADD 15 vary from 8.1 to 26.3% for SNF beds and from 10.1 to 27.5% for ALF beds. In all ADDs, this increasing utilisation rate couples with a reduction in service quality, and an increase in days to wait for availability of an LTC bed.
In addition, service quality is measured by determining how many days a patient is expected to wait for admission to an LTC facility. At current demand and capacity, ADD 6 experiences the best service quality at 91 and 99% for the three-day and the six-day thresholds, respectively. The increase in demand has an impact on reduction in the quality of service across all regions as bed utilisation and patient wait times are on the rise. The forecast of increasing patient demand for LTC has varying impacts on these quality measures due to initial capacity to accommodate demand as well as changing demographics by ADD.
In order to maintain service quality, we test various scenarios by increasing the bed capacity of LTC facilities over the 15 year forecasting period. An annual increase of 1% in bed capacity does little to improve service quality at the 10 and 15 year forecast periods, achieving only about 60% and 45% of service quality, respectively. However, increasing bed capacity by 5% retains the service quality level above 90% at the 10 year forecast period and above 80% at the 15 year forecast period. Moreover, two sets of sensitivity analyses are conducted to determine the optimal bed capacity in response to LOS increase or decrease, and to assess the proactive adjustment of capacity that involves preemptive action to achieve long-term sustainability.
We expect that the implementation of our proposed model will benefit not just the LTC providers and stake holders but LTC patients as well. The resulting decisions would allow healthcare providers such as hospitals and nursing homes to coordinate and ensure that patients receive the care they need by providing the right resources (e.g., number of beds) at the right time, thus, improving the quality of service for patients, while being able to reduce potential excess amount of resources. Moreover, policy-makers can use this data-driven decision tool to identify where healthcare resources are or will be most needed by (i) incorporating profiles of the patient demand for healthcare services, (ii) comparing to the local capacity of healthcare resources, and (iii) mapping the distribution of service gaps in a long-term healthcare network (LHN) on the region of interest.
Recently, the state of Kentucky has rolled out a new system by implementing the Medicaid waiver, aimed at efficiently distributing funds for the support of care of elders. This Medicaid waiver programme allows the state to shift the funding towards home services in an effort to incentivise keeping the ageing population in their home and communities, which has been demonstrated to be more cost efficient. Our simulation model is expected to aid the state in reaching expedient delivery of home healthcare services and rebalancing of distribution of resources, and in turn saving on LTC expenditure that is currently deemed unsustainable. Recognising the interplay of patient demand and provider service capacity, the LTC planning process can be augmented by incorporating such policy change, e.g., Medicaid waivers, for an ageing population while estimating possible resulting patient flow redirection. This is the subject of our ongoing research.
Disclosure statement
No potential conflict of interest was reported by the authors.
Funding
This research work was supported in part by a grant from the Kentucky Science and Engineering Foundation as per Grant Agreement #KSEF-148-502-15-345 with Kentucky Science and Technology Corporation.
Appendix A1.
Appendix
A1: Kentucky is divided into 15 ADDs (Area Development Districts), each of which is comprised of multiple counties. The primary purpose of these administrative districts is to provide planning and services to their constituents and counties.
Acknowledgements
The authors thank the Office of Health Policy from the Kentucky Cabinet for Health and Family Services for providing the data used for this research.
References
- AARP Public Policy Institute (2015). Long-term services & supports state scorecard. Retrieved June 2015 from, http://www.longtermscorecard.org [Google Scholar]
- Administration on Aging, Department of Health and Human Services (2014). Retrieved November 2014, from http://www.aoa.gov/AoARoot/Aging_Statistics/index.aspx. [Google Scholar]
- Ansah J. P., Matchar D. B., & Love S. R. (2013). Simulating the impact of long-term care policy on family eldercare hours. Health Services Research, 48, 773–791. 10.1111/1475-6773.12030 [DOI] [PMC free article] [PubMed] [Google Scholar]
- Bodenheimer T., Wagner E. H., & Grumbach K. (2002). Improving primary care for patients with chronic illness: The chronic care model, part 2. The Journal of the American Medical Association, 288(15), 1909–1914. 10.1001/jama.288.15.1909 [DOI] [PubMed] [Google Scholar]
- Brailsford S. C., & Hilton N. A. (2001) A comparison of discrete event simulation and system dynamics for modelling health care systems. Proceedings of Operational Research Applied to Health Services (ORAHS), Glasgow Caledonian University, pp. 18–39. [Google Scholar]
- Bureau of the Census (2014). Retrieved February 2014, from, http://www.census.gov [Google Scholar]
- Cardoso T., Oliveira M. D., Barbosa-Póvoa A., & Nickel S. (2012). Modeling the demand for long-term care services under uncertain information. Health Care Management Science, 15(4), 385–412. 10.1007/s10729-012-9204-0 [DOI] [PubMed] [Google Scholar]
- Center for Medicare and Medicaid Services (2014). Retrieved September 2014, from http://www.medicaid.gov/AffordableCareAct/Provisions [Google Scholar]
- Connelly L. G., & Bair A. E. (2004). Discrete event simulation of emergency department activity: a platform for system-level operations research. Academic Emergency Medicine, 11, 1177–1185. 10.1111/acem.2004.11.issue-11 [DOI] [PubMed] [Google Scholar]
- Cote M., & Stein W. E. (2000). An Erlang-based stochastic model for patient flow. Omega, 28, 347–359. 10.1016/S0305-0483(99)00045-6 [DOI] [Google Scholar]
- Davies R., & Davies H. T. O. (1994). Modeling patient flows and resource provision in health systems. Omega, 22(2), 123–131. 10.1016/0305-0483(94)90073-6 [DOI] [Google Scholar]
- Fetter R. B., & Thompson J. D. (1968). A decision model for the design and operation of a progressive patient care hospital. Medical Care, 7, 450–462. [Google Scholar]
- Forder J., & Fernandez J.-L. (2011) Length of stay in care homes (PSSRU Discussion Paper 2769). Canterbury: PSSRU. [Google Scholar]
- Hare W. L., Alimadad A., Dodd H., Ferguson R., & Rutherford A. (2009). A deterministic model of home and community care client counts in British Columbia. Health Care Management Science, 12(1), 80–98. 10.1007/s10729-008-9082-7 [DOI] [PubMed] [Google Scholar]
- Harper P. R., & Shahani A. K. (2002). Modelling for the planning and management of bed capacities in hospitals. Journal of the Operational Research Society, 53(1), 11–18. 10.1057/palgrave/jors/2601278 [DOI] [Google Scholar]
- Harrison G. W., & Escobar G. J. (2010). Length of stay and imminent discharge probability distributions from multistage models: Variation by diagnosis, severity of illness, and hospital. Health Care Management Science, 13(3), 268–279. 10.1007/s10729-010-9128-5 [DOI] [PubMed] [Google Scholar]
- Houser A., Fox-Grage W., & Ujvari K. (2012). Across the states: Profiles of long-term services and supports. Washington, DC: AARP. [Google Scholar]
- Jun J. B., Jacobson S. H., & Swisher J. R. (1999). Application of discrete-event simulation in health care clinics: A survey. Journal of the Operational Research Society, 50(2), 109–123. 10.1057/palgrave.jors.2600669 [DOI] [Google Scholar]
- Kao E. P. C., & Tung G. G. (1981). Bed allocation in a public health care delivery system. Management Science, 27(5), 507–520. 10.1287/mnsc.27.5.507 [DOI] [Google Scholar]
- Kleijnen J. P. C., & Wan J. (2007). Optimization of simulated systems: OptQuest and alternatives. Simulation Modelling Practice and Theory, 15, 354–362. 10.1016/j.simpat.2006.11.001 [DOI] [Google Scholar]
- Kucukyazici B., Verter V., & Mayo N. (2011). An analytical framework for designing community-based care for chronic diseases. Production and Operations Management, 20(3), 474–488. 10.1111/poms.2011.20.issue-3 [DOI] [Google Scholar]
- Law A. M. (2013). Simulation modeling and analysis. New York, NY: McGraw-Hill. [Google Scholar]
- Lewis P. A. W., & Shedler G. S. (1979). Simulation of nonhomogeneous poisson processes by thinning. Naval Research Logistics Quarterly, 26(3), 403–413. 10.1002/(ISSN)1931-9193 [DOI] [Google Scholar]
- Lin F., Kong N., & Lawley M. (2012). Capacity planning for publicly funded community based long-term care services In Johnson M. P. (Ed.), Community-based operations research (pp. 297–315). New York, NY: Springer; 10.1007/978-1-4614-0806-2 [DOI] [Google Scholar]
- Marazzi A., Paccaud F., Ruffieux C., & Beguin C. (1998). Fitting the distributions of length of stay by parametric models. Medical Care, 36(6), 915–927. 10.1097/00005650-199806000-00014 [DOI] [PubMed] [Google Scholar]
- Patrick J. (2011). Long term care: The real cause of hospital congestion. Production and Operations Management, 20(3), 347–358. 10.1111/poms.2011.20.issue-3 [DOI] [Google Scholar]
- Patrick J., Nelson K., & Lane D. (2015). A simulation model for capacity planning in community care. Journal of Simulation, 9(2), 111–120. 10.1057/jos.2014.23 [DOI] [Google Scholar]
- Ridge J. C., Jones S. K., Nielsen M. S., & Shahani A. K. (1998). Capacity planning for intensive care units. European Journal of Operational Research, 105, 346–355. 10.1016/S0377-2217(97)00240-3 [DOI] [Google Scholar]
- Ross S. M. (2006). Simulation. London: Academic Press. [Google Scholar]
- Tsai A. C., Morton S. C., Mangione C. M., & Keeler E. B. (2005). A meta-analysis of interventions to improve care for chronic illnesses. The American Journal of Managed Care, 11(8), 478–488. [PMC free article] [PubMed] [Google Scholar]
- Vassilacopoulos G. (1985). A simulation model for bed allocation to hospital inpatient departments. Simulation, 45, 233–241. 10.1177/003754978504500502 [DOI] [Google Scholar]
- Waldo D., & Lazeby H. (1984). Demographic characteristics and healthcare use and expenditures by the aged in the United States: 1977–1984. Health Care Financing Review, 6, 1–29. [PMC free article] [PubMed] [Google Scholar]
- Xie H., Chaussalet T. J., & Millard P. H. (2005). A continuous time Markov model for the length of stay of elderly people in institutional long-term care. Journals of the Royal Statistical Society A, 168(1), 51–61. 10.1111/rssa.2005.168.issue-1 [DOI] [Google Scholar]
- Zhang Y., Puterman M. L., Nelson M., & Atkins D. (2012). A Simulation optimization approach to long-term care capacity planning. Operations Research, 60, 249–261. 10.1287/opre.1110.1026 [DOI] [Google Scholar]


