

Abstract
Eutrema salsugineum is a model species for the study of plant adaptation to abiotic stresses. Two accessions of E. salsugineum, Shandong (SH) and Yukon (YK), exhibit contrasting morphology and biotic and abiotic stress tolerance. Transcriptome profiling and metabolic profiling from tissue samples collected during the dark period were used to investigate the molecular and metabolic bases of these contrasting phenotypes. RNA sequencing identified 17,888 expressed genes, of which 157 were not in the published reference genome, and 65 of which were detected for the first time. Differential expression was detected for only 31 genes. The RNA sequencing data contained 14,808 single nucleotide polymorphisms (SNPs) in transcripts, 3,925 of which are newly identified. Among the differentially expressed genes, there were no obvious candidates for the physiological or morphological differences between SH and YK. Metabolic profiling indicated that YK accumulates free fatty acids and long‐chain fatty acid derivatives as compared to SH, whereas sugars are more abundant in SH. Metabolite levels suggest that carbohydrate and respiratory metabolism, including starch degradation, is more active during the first half of the dark period in SH. These metabolic differences may explain the greater biomass accumulation in YK over SH. The accumulation of 56% of the identified metabolites was lower in F1 hybrids than the mid‐parent averages and the accumulation of 17% of the metabolites in F1 plants transgressed the level in both parents. Concentrations of several metabolites in F1 hybrids agree with previous studies and suggest a role for primary metabolism in heterosis. The improved annotation of the E. salsugineum genome and newly identified high‐quality SNPs will permit accelerated studies using the standing variation in this species to elucidate the mechanisms of its diverse adaptations to the environment.
Keywords: differentially expressed genes, extremophile, fatty acid metabolism, metabolomics, single nucleotide polymorphisms, transcriptome, transgressive variation
Abbreviations
- ABA
Abscisic acid
- DEGs
differentially expressed genes
- ESTs
expressed sequence tags
- ET
ethylene
- FDR
false discovery rate
- GC/MS
gas chromatography‐mass spectrometry
- JA
jasmonic acid
- MeJA
methyl jasmonate
- PAV
presence–absence variation
plant defensin gene
- PMSR
peptide methionine sulfoxide reductase
- QTL
quantitative trait loci
- SH
E. salsugineum Shandong accession
- SNP
single nucleotide polymorphism
- VLCFA
very‐long‐chain fatty acids
- YK
E. salsugineum Yukon accession
1. INTRODUCTION
Eutrema salsugineum (formerly Thellungiella halophila) is a model species for the study of plant stress tolerance (Amtmann, 2009; Griffith et al., 2007; Pilarska et al., 2016; Wong et al., 2005). The two most commonly studied accessions, Shandong (SH) and Yukon (YK), are native to the Yellow River region of China (Bressan et al., 2001; Inan et al., 2004) and the Yukon territories of Canada (Wong et al., 2005), respectively. These accessions contrast in cold tolerance (Lee, Babakov, de Boer, Zuther, & Hincha, 2012), water stress tolerance (MacLeod et al., 2014; Xu et al., 2014), and disease resistance (Yeo et al., 2014). In response to water stress, for example, YK accumulates more cuticular wax (Xu et al., 2014), exhibits delayed wilting due to higher leaf water content, and maintains a higher leaf area, as compared to SH (MacLeod et al., 2014). Some differences in adaptive mechanisms are linked to metabolism, such as a more pronounced increase in fructose and proline content after cold acclimation in YK compared to SH (Lee et al., 2012).
RNA‐seq has been used to identify differentially expressed genes (DEGs) that contribute to genotypic variation in response to physiological conditions (Bazakos et al., 2012; Huang et al., 2012; Stein & Waters, 2012; Wang, Gerstein, & Snyder, 2009). When comparing expression between polymorphic accessions of a species, RNA‐seq allows for the simultaneous identification and quantification of single nucleotide polymorphisms (SNPs; Nielsen, Paul, Albrechtsen, & Song, 2011; Wang et al., 2009). These data can later be utilized as genetic markers for linkage mapping (Lisec et al., 2008; Trick et al., 2012) and to assess allele‐specific expression (Oshlack, Robinson, & Young, 2010; Pickrell et al., 2010).
Plant metabolic profiling permits the simultaneous measurement of multiple intermediates and the products of biochemical pathways. Similar to RNA‐seq, metabolic profiling can be used to investigate the metabolic and physiological status of biological systems (Fiehn et al., 2000) and may provide biochemical bases for differences in growth and physiology (Meyer et al., 2007). Metabolite profiling has revealed correlations between particular metabolites and growth in Arabidopsis thaliana (Meyer et al., 2007), but it is not clear whether these metabolites are more universally linked to heterosis.
Novel genes and enzymes in plant metabolite biosynthetic pathways have been identified through combined transcriptome and metabolome analyses (Boke et al., 2015; Sumner, Lei, Nikolau, & Saito, 2015). In addition, this approach has provided insights into pathways that are affected by gene mutation (Masclaux‐Daubresse et al., 2014; Page et al., 2016; Satou et al., 2014), related to biotic (Gurkok, Turktas, Parmaksiz, & Unver, 2015; Liu et al., 2016), and abiotic stress responses (Bielecka et al., 2014; Hamanishi, Barchet, Dauwe, Mansfield, & Campbell, 2015).
Together, transcriptome profiling and metabolite profiling provide complementary experimental evidence to guide the construction of rational hypotheses for the biochemical basis of variation in growth. The goal of this study is to identify the metabolic and transcription bases for the growth differences between the two E. salsugineum accessions. We utilized contrasting genotypes to identify genetic differences, expression divergence, and metabolic compounds associated with observed phenotypic variation. The YK accession has a higher water‐use efficiency than SH (J Yin et al., manuscript in preparation). Among several traits that differ in these accessions is a distinct change in transpiration during the dark period. We therefore employed transcriptome and metabolic profiling to provide insight on the observed differences in these accessions and chose the dark period for tissue collection because of this observation. We obtained gene expression and metabolite concentration data from SH and YK accessions during the dark period by RNA‐seq and gas chromatography‐mass spectrometry (GC/MS), respectively. We utilized RT‐PCR to confirm DEGs implicated by our RNA‐seq experiment, validating 23 of 25 candidates. By mining the RNA‐seq experiment, we validated previously identified SNPs and discovered additional SNPs that differentiate these E. salsugineum accessions. We propose that observed differences in metabolite accumulation could contribute to differences in biomass.
2. MATERIALS AND METHODS
2.1. Plant material and growth conditions
Seeds of E. salsugineum SH and YK accessions were obtained from individual selfed plants. To generate SH × YK F1 seed, closed flower buds of YK plants were manually opened, anthers removed, and pollen from SH plants applied to the stigma. Multiple crosses (ca. 20) were made on a single plant, which was kept in isolation until seed set. Seeds from this plant were used for F1 experiments.
Seeds were stratified in the dark for 10 days at 4°C and then sown in a 4:1 mix of Fafard 52 Mix (transcriptome and first metabolome experiments) or Fafard 2 Mix (second metabolome experiment) soilless media (Conrad Fafard Inc., Agawam, MA, USA) and Turface calcined clay (Profile Products LLC, Buffalo Grove, IL, USA). Plants were grown in 50‐ml conical tubes (USA Scientific Inc., Ocala, FL, USA). A 0.5‐cm hole was drilled at the bottom of each tube where seeds were sown. Tubes were then closed with a mesh cap and placed cap‐side‐down to allow for subirrigation. Tubes were placed in a mist room for 12 days, at which point seedlings had reached the four‐leaf stage. Plants were then grown in a growth chamber (E15; Conviron, Pembina, ND, USA) set at 60% relative humidity under a 12‐hr photoperiod (approximately 230 μmol m−2 s−1 provided by both fluorescent and incandescent bulbs) with light and dark temperatures of 22 and 20°C, respectively. Irrigation water was a 3:1 mix of two water‐soluble fertilizers (15N–2.2P–12.5K and 21N–2.2P–16.6K; The Scotts Co., Marysville, OH, USA) to supply (in mg/L): 200 N, 26 P, 163 K, 50 Ca, 20 Mg, 1.0 Fe, 0.5 Mn and Zn, 0.24 Cu and B, and 0.1 Mo; 76% of the nitrogen was provided as nitrate. 93% sulfuric acid (Brenntag North America Inc., Reading, PA, USA) at 0.08 mg/L was mixed in irrigation water to maintain pH between 5.8 and 6.2. All plants were grown in the Purdue University Horticulture Plant Growth Facility (https://ag.purdue.edu/hla/Hort/Greenhouse/Pages/Default.aspx).
2.2. Transcriptome sequencing and analysis
For RNA extraction, tissue was collected in the middle of the dark period. Four biological replicates, each consisting of five whole rosettes of 4‐week‐old plants, were collected and immediately frozen in liquid nitrogen and stored at −80°C. Tissue was finely ground in liquid nitrogen using a mortar and pestle. Approximately 800 mg ground tissue was combined with 1 ml of TRIzol reagent (Gibco/BRL Life Technologies; Invitrogen, Carlsbad, CA, USA) and RNA was extracted according to the manufacturer's instructions. Genomic DNA was removed using the TURBO DNA‐free™ Kit (Ambion, Austin, TX, USA). Quality of RNA was estimated by the ratio of absorbance at 260 to 280 nm and 260 to 230 nm by spectrophotometer (DU 730; Beckman Coulter Inc., Indianapolis, IN, USA) with both ratios between 1.8 and 2.2. RNA was reverse‐transcribed into cDNA using the Poly(A) Purist protocol (Ambion).
The cDNA samples were fragmented into 300‐ to 500‐bp molecules, and sequencing libraries were constructed for the 454 GS‐FLX instrument (454 Life Sciences; Roche Company, Branford, CT, USA) at the Purdue University Genomics Facility (West Lafayette, IN, USA). One sequencing run was performed (Margulies et al., 2005). Raw sequences were trimmed to remove adaptor sequences, and an initial quality trimming was performed using GS De Novo Newbler (v2.5.3; default parameters). Trimmed reads were further trimmed using the FASTX‐Toolkit (Gordon & Hannon, 2010), with a minimum quality value of 12 and minimum read length of 50 bp. Trimmed reads were aligned to the Joint Genome Institute (JGI) E. salsugineum genome (Phytozome v9.1: Thellungiella halophila: http://www.phytozome.net/thellungiella.php; Yang et al., 2013) using the splice‐aware aligner GMAP v2012‐11‐27 with default parameters (Wu & Watanabe, 2005). Only uniquely mapped reads were used for transcript abundance estimates and single nucleotide polymorphism (SNP) calling.
SNPs were detected using mpileup from SAMtools v0.1.18 with mapping quality ≥15, and depth ≥3 (Li et al., 2009); 454 sequencing has a high error rate for detecting indels (Margulies et al., 2005), so only SNPs resulting from substitutions were retained. The two accessions are substantially inbred lines and should be homozygous at each base position. Hence, only monomorphic base positions within each accession were considered for detection of differences between the two accessions. Custom Perl scripts were used to remove SNPs (i) that were heterozygous within either accession, (ii) that were not biallelic between accessions, (iii) that were supported by fewer than three sequence reads, (iv) for which the alternative allele accounts for fewer than 10% of aligned reads, and (v) that were heterozygous between the SH accession and the JGI SH reference. If more than four SNPs were detected within a 100‐bp region using the VariantFiltration module from GATK v2.4.9 (McKenna et al., 2010), they were not included in the final SNP data set. SNPs that had a mpileup quality score 999 based on SAMtools were deemed “high‐quality” SNPs. Sanger sequencing data of the YK accession, available from the National Center for Biotechnology Information (NCBI) (Wong et al., 2005), were also aligned to the reference genome using SSAHA2 (Ning, Cox, & Mullikin, 2001). SNPs were called using SAMtools and filtered for clustered SNPs (four SNPs within 100‐bp region) using GATK as indicated. SNPs that were not biallelic or were heterozygous within YK were removed.
Genes were identified via a reference annotation‐based transcript assembly method using the Cufflinks package (Roberts, Pimentel, Trapnell, & Pachter, 2011; Trapnell et al., 2010). Reads from SH and YK were assembled separately and then merged using the cuffmerge command (Roberts et al., 2011; Trapnell et al., 2010). The intersect function within BEDTools v2.17.0 was used to identify genes not annotated in the JGI E. salsugineum genome (newly annotated genes). Same strandedness was not enforced when identifying newly annotated genes because of the nonstrand‐specific protocol for 454 library preparation. Newly annotated genes that are unique from or overlap genes annotated by Champigny et al. (2013) but are present in the JGI reference genome were also identified using the same method (Table S1).
The number of reads uniquely aligned to each gene was determined with htseq‐count within HTSeq v0.5.4p5 (http://www-huber.embl.de/users/anders/HTSeq/doc/count.html) using union mode. The bioconductor package “DESeq” v.1.14.0 was used to identify genes likely to be differentially expressed between SH and YK without biological replicates (Anders & Huber, 2010). Gene expression was normalized, and the significance threshold for differential expression was based on a 0.2 false discovery rate (FDR; Benjamini & Hochberg, 1995).
Genes were annotated by the best BLAST (Altschul, Gish, Miller, Myers, & Lipman, 1990) hit of A. thaliana. For E. salsugineum genes predicted by the JGI genome, annotation was taken from Phytozome v9.1 (Phytozome v9.1: Thellungiella halophila: http://www.phytozome.net/thellungiella.php, Yang et al., 2013). For newly identified genes, nucleotide databases of A. thaliana version TAIR 10 (Lamesch et al., 2012; TAIR10: ftp://ftp.arabidopsis.org/home/tair/Sequences/blast_datasets/TAIR10_blastsets/), A. lyrata (Hu et al., 2011; Phytozome v9.1: Arabidopsis lyrata: http://www.phytozome.net/alyrata.php), and S. parvula (Dassanayake et al., 2011; Thellungiella parvula genome: http://www.thellungiella.org/data) were built and used for similarity searching by BLASTN v2.2.28 + (Altschul et al., 1990). Genes were annotated by the best BLAST hit with the following threshold parameters: E ≤ 1−30; sequence identity ≥30%; sequence aligned ≥30% of query sequence.
2.3. Quantitative real‐time PCR
For quantitative real‐time reverse transcription–polymerase chain reaction (qRT‐PCR), tissue was collected as described for 454 sequencing, RNA was extracted using the RNeasy Plant Mini Kit (QIAGEN, Valencia, CA, USA), and genomic DNA was removed using the TURBO DNA‐free™ Kit (Ambion). The quality and quantity of mRNA were assessed using a NanoDrop 2000 (Thermo Fisher Scientific Inc., Wilmington, DE, USA). All samples were diluted to 200 ng/μl, and 260/280 and 260/230 ratios were between 1.8 and 2.2. cDNA was synthesized using a High‐Capacity cDNA Reverse Transcription Kit (Invitrogen). Primers were designed using Primer Express software (v3.0.1). Primer specificity was then estimated by BLASTN using the E. salsugineum genome with all primer pairs. Primer efficiency was tested for all pairs of primers. cDNA was diluted five times by a fivefold gradient and then used as template for qRT‐PCR, and the threshold cycles (C T) were regressed against cDNA concentration (log). Slope of the regression line was estimated, and the efficiency was calculated as 10−(1/slope)−1. For genes expressed in both accessions, primer efficiency was between 80 and 110% in both accessions. For genes that were only expressed in one accession based on RNA‐seq data, primer efficiency was tested on both accessions, but only the accession with detected expression exhibited efficiency between 80 and 110%. Table S2 contains all primer sequences except gene XLOC_004723, for which acceptable qRT‐PCR primers could not be designed.
All qRT‐PCR reactions were conducted in StepOnePlus™ Real‐Time PCR Systems (Applied Biosystems, Invitrogen). Relative gene expression of target genes was quantified by the ΔC T method (Livak & Schmittgen, 2001). Relative gene expression was calculated as:
where E is the primer efficiency for each pair of qRT‐PCR primers. C T,X and C T,R is the threshold cycle of the target gene and the reference gene Actin2 (Thhalv10020906 m.g), respectively.
2.4. Metabolite profiling and data analysis
Two metabolite profiling experiments were conducted. One experiment was performed using the same rosette tissue used for RNA‐seq analysis (see above). A second metabolite profiling experiment was performed using tissue from SH, YK, and YK × SH F1 plants with three replicates of five pooled plants per replicate. In both cases, identical extraction, derivatization, and analysis methods were used. Approximately 800 mg of frozen ground tissue was incubated in methanol at 65° in 1.75‐ml tubes and centrifuged at 13,300 r/min. The supernatant, containing polar molecules, was decanted into a new tube. Chloroform was added to the pellet and incubated at 37°C for 15 min to solubilize nonpolar metabolites. Samples were then dried at room temperature for about 6 hr (polar) and 2 hr (nonpolar) in a centrifuge at 1,725 r/min and 30 μM Hg vacuum. Samples were stored at −80°C until being sent to the Metabolomics Center at the University of Illinois (http://www.biotech.uiuc.edu/metabolomics/). Samples were measured by gas chromatography‐mass spectrometry (GC‐MS; Agilent 6890 N/5973 MSD, Palo Alto, CA, USA) after purification and trimethylsilylation with MSTFA (N‐methyl‐N‐trimethylsilyl‐trifluoroacetamide; Gullberg, Jonsson, Nordström, Sjöström, & Moritz, 2004; Singh, Ulanov, Li, Jayaswal, & Wilkinson, 2011). Data were analyzed by peak identification via comparison with spectra from standards, and relative concentrations of metabolites were obtained by comparison with internal standard peak area (Singh et al., 2011).
Pairwise comparisons within each experiment were performed by two‐tailed t tests between SH and YK (experiments 1 and 2), and SH or YK and YK × SH F1 (experiment 2). In the second experiment, multiple comparisons among all three genotypes were conducted by Tukey's studentized range test (Tukey, 1949). A t test of F1 against the mid‐parental average of SH and YK was done using the variance estimated from F1 hybrids. Within each experiment, genotype was treated as the only main factor. A nested analysis of variance (ANOVA) was also conducted using data from the two experiments. In the nested analysis, experiment and genotype were the two main factors. The experiment by genotype interaction was not included in the model. All identified metabolites are presented in Table S3.
2.5. Pathway analysis
Pathway analysis was conducted on the annotated DEGs identified in transcriptome profiling and metabolites that differed in the same direction between accessions in both metabolite experiments. The fold difference between SH and YK was used to indicate up‐ or downregulation in YK compared to SH. The list of DEGs or metabolites with the fold changes were imported to MapMan software (Thimm et al., 2004). Significant pathways in which genes or metabolites were divergent from a 50/50 up/downregulation were identified using an uncorrected Wilcoxon signed‐rank test (Wilcoxon, 1945).
3. RESULTS
3.1. Novel genes and single nucleotide polymorphisms (SNPs) were identified by transcriptome sequencing
Whole rosettes of 4‐week‐old YK and SH plants grown in a 12‐hr:12‐hr light–dark cycle were harvested in the middle of the dark period. Libraries of cDNA isolated from these rosettes were sequenced, and reads were aligned to the E. salsugineum SH reference genome (Yang et al., 2013). More than 1 million cDNA sequence reads, 95% of which aligned to the reference genome, were used for a reference‐directed assembly of the transcriptome (Table S4), identifying 17,888 expressed genes (Tables S1 and S5). Of these, 65 genes were novel and not predicted in the reference genome (Yang et al., 2013) nor detected in a previous transcriptome analysis (Champigny et al., 2013). Only 20 of these 65 genes have annotated orthologs in the related species A. thaliana, A. lyrata, and/or Schrenkiella parvula (Table S1). Presence–absence variation (PAV), defined as zero reads aligned to one of the two parents, was observed for 18.5% of the detected expressed genes with roughly equal numbers of genes detected only in SH or YK (Table S5).
The transcript assemblies were processed to detect SNPs between SH and YK; 42% of shared genes contained a total of 14,808 SNPs, of which 4,873 were deemed “high quality” (Table 1; Table S6). Of the low and high stringency SNPs detected in our experiment, 73% (10,883 positions) and 79% (3,861 positions), respectively, were also identified by Champigny et al. (2013). We also compared our SNPs to available Sanger sequencing of cDNA clones from the YK accession (Wong et al., 2005) and identified 468 putative SNPs with reference to the SH reference genome. Of these, 441 have corresponding sequence data in the YK transcriptome we assembled and 88% (388 SNPs) had the same sequence variation in our assembly and the YK Sanger sequencing data (Table S6).
Table 1.
Summary of single nucleotide polymorphisms (SNPs) that differentiate Eutrema salsugineum Shandong and Yukon accessions
| Number of genes with SNPs | 6,182 |
| Number of SNPs in genes | 14,808 |
| Number of high‐quality SNPs | 4,873 |
| Number of SNPs identified by Champigny et al. (2013) | 47,317 |
| Number of SNPs present in Champigny et al. (2013) | 10,883 |
| Number of SNPs unique from Champigny et al. (2013) | 3,925 |
Quality SNP satisfies technical and biologically relevant filtering criteria as discussed in the Materials and Methods.
3.2. Transcriptome profiling and qRT‐PCR identify differentially expressed genes (DEGs) between SH and YK
To assess gene expression differences between SH and YK, we determined the number of reads aligned to each gene. Less than 0.2% (thirty‐one genes) of the expressed genes were identified as candidate DEGs between SH and YK (Table 2). Sixteen of these thirty‐one candidates do not have homologous genes in A. thaliana, A. lyrata, or S. parvula, and twenty have been annotated in the reference genome (Table 2). Of those with homologs in one of these species, none have been associated with previously reported trait differences in SH and YK. Gene ontology (GO) enrichment analysis was not appropriate, given the small number of DEGs.
Table 2.
Differently expressed genes (DEGs) of Eutrema salsugineum Shandong (SH) and Yukon (YK) accessions
| Eutrema gene locus | SH | YK | Fold difference (log2YK/SH) | Fold difference in qRT | A. thaliana best blast hit | Gene description |
|---|---|---|---|---|---|---|
| Thhalv10021382 m.g | 4 | 87 | 4.4 | 12.5 | AT1G76810 | Eukaryotic translation initiation factor 2 (eif‐2) family protein |
| Thhalv10000662 m.g | 46 | 429 | 3.2 | 4.4 | AT5G44420 | Plant defensin 1.2A |
| Thhalv10015083 m.g | 34265 | 2494 | −3.8 | −5661.5 | ||
| Thhalv10011087 m.g | 1445 | 327 | −2.1 | n.s. | ATCG00480 | ATP synthase subunit beta |
| XLOC_024729 | 237 | 25 | −3.2 | −2.0 | ||
| Thhalv10015718 m.g | 0 | 48 | Absent in SH | Not detected in SH | AT5G56920 | Cystatin/monellin superfamily protein |
| Thhalv10029390 m.g | 0 | 83 | Absent in SH | Not detected in SH | AT4G11000 | Ankyrin repeat family protein |
| Thhalv10021522 m.g | 1 | 244 | 7.9 | 144.9 | AT3G16660 | Pollen Ole e 1 allergen and extensin family protein |
| Thhalv10014718 m.g | 1 | 86 | 6.4 | 11.8 | AT5G07470 | Peptide methionine sulfoxide reductase 3 |
| Thhalv10002969 m.g | 61 | 0 | Absent in YK | −58.3 | AT3G62210 | Putative endonuclease or glycosyl hydrolase |
| Thhalv10009345 m.g | 58 | 0 | Absent in YK | Not detected in YK | ||
| Thhalv10014264 m.g | 53 | 0 | Absent in YK | Not detected in YK | AT4G01560 | Ribosomal RNA processing Brix domain protein |
| Thhalv10000285 m.g | 179 | 0 | Absent in YK | Not detected in YK | AT4G20095 | Protein of unknown function (DUF626) |
| Thhalv10022943 m.g | 148 | 0 | Absent in YK | Not detected in YK | ||
| Thhalv10023491 m.g | 47 | 0 | Absent in YK | Not detected in YK | AT3G61100 | Putative endonuclease or glycosyl hydrolase |
| Thhalv10018393 m.g | 70 | 1 | −6.1 | 1.7 | AT1G70160 | Unknown protein |
| XLOC_005768 | 0 | 99 | Absent in SH | Not detected in SH | ||
| XLOC_017575 | 50 | 0 | Absent in YK | Not detected in YK | ||
| XLOC_003055 | 55 | 0 | Absent in YK | Not detected in YK | ||
| XLOC_024727 | 53 | 0 | Absent in YK | Not detected in YK | ||
| XLOC_003052 | 318 | 1 | −8.3 | −257.7 | ||
| XLOC_008740 | 135 | 3 | −5.5 | Not detected in YK | ||
| XLOC_020731 | 76 | 0 | Absent in YK | Not detected in YK | ||
| XLOC_017573 | 246 | 0 | Absent in YK | Not detected in YK | ||
| XLOC_015175 | 75 | 0 | Absent in YK | Not detected in YK | ||
| Genes with no specific primers available | ||||||
| Thhalv10022994 m.g | 0 | 46 | Absent in SH | Not tested | AT2G15220 | Plant basic secretory protein (BSP) family protein |
| Thhalv10022932 m.g | 74 | 1 | −6.2 | Not tested | ||
| Thhalv10014933 m.g | 295 | 32 | −3.2 | Not tested | AT5G59870 | Histone H2A 6 |
| Thhalv10019398 m.g | 6 | 217 | 5.2 | Not tested | AT5G44430 | Plant defensin 1.2C |
| Thhalv10029246 m.g | 0 | 47 | Absent in SH | Not tested | AT4G11000 | Ankyrin repeat family protein |
| XLOC_004723 | 187 | 16 | −3.5 | Not tested | ATCG01020 | Ribosomal protein L32 |
To confirm DEGs based on RNA‐seq, we designed qRT‐PCR primers that matched unique positions in the reference genome based on BLAST analysis (Altschul et al., 1990). Unique primers could not be designed for five genes (Thhalv10022994 m.g, Thhalv10022932 m.g, Thhalv10014933 m.g, Thhalv10019398 m.g, and Thhalv10029246 m.g) due to paralogs with high sequence similarity, and no acceptable primer pair was identified for XLOC_004723. In total, qRT‐PCR data confirmed our RNA‐seq data for 23 of 25 genes. For the five DEGs that had no close paralogs and at least four reads in both SH and YK, expression differences based on RNA‐seq were confirmed by qRT‐PCR in four of five genes (Table 2). Among the 20 genes that had fewer than four reads in either SH or YK, expression differences by qRT‐PCR was consistent with RNA‐seq data in 19 (Table 2). In addition, when the low accession had fewer than four reads, there was no amplification in 16 of 20 cases (Table 2).
3.3. Metabolite profiling reveals higher accumulation of fatty acids and amino acids in YK and enhanced soluble carbohydrate accumulation in SH
To identify potential metabolites and metabolic pathways that contribute to phenotypic and physiological differences between SH and YK, metabolite profiling was conducted in two independent experiments. In one experiment, metabolite concentrations in F1 plants of a YK × SH cross were also determined.
Concentrations of free fatty acids and long‐chain fatty acid derivatives were higher in YK than SH (Table 3; Table S3). The concentration of ferulic acid was also greater in YK, indicating a potential for greater suberin and/or cutin accumulation in the YK accession.
Table 3.
Metabolite profiling differences between Eutrema salsugineum Shandong (SH) and Yukon (YK) accessions. Metabolites for which tissue concentrations were different between E. salsugineum Shandong (SH) and Yukon (YK) accessions in one or two experiments and/or different based on a nested analysis of the two experiments
| Metabolite | Experiment 1 | Experiment 2 | p‐Value | ||||
|---|---|---|---|---|---|---|---|
| SH | YK | SH | YK | E1 | E2 | N | |
| Carbohydrates | |||||||
| 2‐keto‐gluconic acid | 1012.0 | 526.4 | 352.9 | 470.8 | n.s. | * | n.s. |
| 2PGA | 2.1 | 0.0 | ** | ||||
| α‐ketoglutaric acid | 83.2 | 41.3 | 66.5 | 61.2 | * | n.s. | * |
| Arabitol | 45.4 | 60.9 | 12.9 | 19.5 | n.s. | * | n.s. |
| Ascorbic acid | 19.6 | 11.8 | 25.0 | 10.4 | n.s. | ** | ** |
| Citric acid | 6722.6 | 17762.7 | 14347.0 | 30526.0 | n.s. | ** | ** |
| Digalactosylglycerol | 2007.8 | 618.8 | 344.5 | 82.9 | n.s. | *** | n.s. |
| Disaccharide | 9941.3 | 8651.1 | 10713.7 | 3862.7 | n.s. | *** | ** |
| Erythritol | 27.6 | 39.1 | 22.1 | 34.3 | n.s. | * | * |
| Erythrose | 976.8 | 591.3 | * | ||||
| Fructose | 65604.0 | 9500.3 | 14987.4 | 1284.4 | *** | *** | *** |
| Fumaric acid | 232.3 | 429.0 | 111.5 | 263.1 | n.s. | *** | ** |
| Galactaric acid | 3.4 | 8.5 | * | ||||
| Galactose | 7730.3 | 4432.0 | 32.0 | 88.7 | * | *** | ** |
| Gentiobiose | 27.3 | 20.4 | * | ||||
| Glucaric acid | 3.7 | 3.0 | 16.1 | 10.4 | n.s. | * | n.s. |
| Glucose | 41843.5 | 28552.0 | 16547.4 | 6251.4 | * | *** | *** |
| Glycerol‐3‐p | 82.4 | 30.8 | 674.0 | 362.7 | * | *** | *** |
| Isomaltose | 75.1 | 0.0 | ** | ||||
| Itaconic acid | 142.0 | 32.2 | * | ||||
| Maltose | 1119.8 | 678.6 | 1081.4 | 846.2 | * | * | *** |
| Melibiose | 0.0 | 5.4 | *** | ||||
| Methylmaleic acid | 16.7 | 7.1 | * | ||||
| Pyruvic acid | 42.4 | 38.6 | 59.8 | 44.0 | n.s. | ** | n.s. |
| Raffinose | 477.5 | 322.5 | 218.9 | 152.7 | * | n.s. | ** |
| Sedoheptulose | 853.9 | 782.4 | 452.2 | 312.6 | n.s. | ** | n.s. |
| Sorbitol | 17.0 | 39.5 | * | ||||
| Turanose | 13688.2 | 7035.2 | ** | ||||
| Xylitol | 18.6 | 11.5 | 13.7 | 20.4 | n.s. | * | n.s. |
| Xylose | 165.8 | 81.1 | 64.6 | 49.3 | * | n.s. | * |
| Fatty acids | |||||||
| 13‐eicosenoic acid | 5.7 | 7.6 | * | ||||
| 7‐hexadecenoic acid | 132.2 | 27.0 | * | ||||
| 9,12‐octadecadienoic acid | 6032.7 | 7434.6 | * | ||||
| Docosanoic acid | 50.5 | 241.3 | 176.5 | 1224.1 | ** | *** | *** |
| Hexacosanoic acid | 13.2 | 28.9 | 0.0 | 20.9 | * | *** | *** |
| Hexadecanol | 0.0 | 12.2 | *** | ||||
| Octacosanol | 9.5 | 1.9 | ** | ||||
| Tetracosanoic acid | 1206.3 | 5001.7 | 8103.8 | 16232.9 | * | * | ** |
| Tetracosanol | 2.2 | 0.0 | 2.5 | 4.5 | *** | ** | n.s. |
| Tricosanoic acid | 0.0 | 12.6 | 133.6 | 150.7 | ** | n.s. | n.s. |
| Tritriacontanol | 47.1 | 37.6 | * | ||||
| Amino acids | |||||||
| Alanine | 2.7 | 6.8 | ** | ||||
| Aspartic acid | 928.9 | 2095.8 | * | ||||
| Glycine | 13.2 | 57.0 | * | ||||
| N‐acetylglutamic acid | 158.0 | 1221.7 | * | ||||
| Serine | 216.4 | 818.2 | * | ||||
| Threonine | 0.0 | 3.8 | 311.1 | 383.3 | *** | * | * |
| Valine | 0.0 | 10.3 | 104.9 | 92.8 | ** | n.s. | n.s. |
| Others | |||||||
| 1,2,3‐hydroxybutane | 4.1 | 0.0 | * | ||||
| 2,3‐dihydroxybutanedioic acid | 11.8 | 27.0 | 5.8 | 9.6 | * | * | ** |
| 2,4,6‐tri‐tert.‐butylbenzenethiol | 42.5 | 44.3 | 157.3 | 185.3 | n.s. | * | n.s. |
| 2‐aminoethylphosphate | 0.0 | 44.5 | * | ||||
| 2‐desoxy‐pentos‐3‐ulose | 33.1 | 15.3 | *** | ||||
| 2‐hydroxybutanoic acid | 11.3 | 0.0 | * | ||||
| 2‐o‐glycerol‐galactopyranoside | 2362.0 | 398.0 | 181.6 | 178.0 | *** | n.s. | * |
| 2‐oxo‐3‐hydroxypropanoic acid | 17.3 | 75.7 | ** | ||||
| 3‐methylthiopropylamine | 0.0 | 5.4 | * | ||||
| 5‐o‐coumaroyl‐d‐quinic acid | 38.5 | 15.6 | * | ||||
| Aconitic acid | 202.7 | 103.5 | 12.7 | 37.5 | * | * | n.s. |
| Tocopherol | 7.8 | 4.0 | * | ||||
| Chlorogenic acid | 710.6 | 332.2 | * | ||||
| Erythronic acid‐1,4‐lactone | 24.2 | 38.0 | * | ||||
| Ferulic acid | 11.3 | 30.4 | 41.8 | 61.6 | n.s. | ** | ** |
| Hydroxylamine | 39.2 | 27.1 | ** | ||||
| Ketomalonic acid | 0.0 | 3.1 | * | ||||
| Malonic acid | 59.7 | 89.5 | 0.0 | 2.6 | n.s. | ** | n.s. |
| P‐hydroxyacetophenone | 0.0 | 2.8 | *** | ||||
| Protocatechuic acid | 5.9 | 2.1 | * | ||||
| Putrescine | 0.0 | 22.4 | ** | ||||
| Stigmasterol | 40.6 | 52.0 | 29.5 | 9.1 | n.s. | ** | n.s. |
| Vanillin | 0.0 | 1.8 | *** | ||||
Data are means (n = 4). Empty indicates absence or undetected metabolites. Genotypes are significant different at p‐Value < .05 (*), 0.01 (**), and 0.001 (***) based on two‐tailed t test in Experiment 1 (E1), Experiment 2 (E2), or nested (N) analysis of two experiments combined together. Carbohydrates indicate sugar‐related compounds and derivatives in citric acid cycle. Fatty acids indicate fatty acids and their derivatives. Others indicate all other compounds not belong to carbohydrates or fatty acids, or amino acids.
Based on maltose and glucose relative concentrations, the estimated starch concentration in SH was 1.7 times that of YK over the two experiments. Furthermore, the products of starch degradation were more abundant in SH than YK in both profiling experiments (Table 3). Maltose and glucose, primary products of starch degradation, were elevated in SH along with fructose, glycerol‐3‐phosphate, raffinose, and an unresolved disaccharide. This suggested more active 6‐carbon metabolite catabolism via glycolysis in SH compared to YK during the night (Table 3; Table S3). SH accumulated higher concentrations of the disaccharides isomaltose and gentiobiose, whereas YK accumulated a very small amount of melibiose in one of the two screens. Tricarboxylic acid (TCA) cycle intermediates, on the other hand, were not consistently different between the accessions. Citric acid and fumaric acid were accumulated at higher levels in YK, and alpha‐ketoglutaric acid was greater in SH (Table 3; Table S3). Ascorbic acid was higher in SH, but the ascorbic acid degradation product tartaric acid (2,3 dihydroxybutanedioic acid) was higher in YK (Table 3 and Table S3).
All amino acids that differed between SH and YK were higher in YK (Table 3; Table S3). These included alanine, glycine, serine, threonine, and valine. Of these, only threonine was differentially accumulated in both profiling experiments. The amino acids alanine, glycine, and serine were only detected in one of the two experiments. Valine was detected in both experiments, but the difference between SH and YK was only statistically significant in the first experiment. Concentrations of the other detected amino acids (isoleucine, leucine, and proline) were not different in the two accessions.
Pathway analyses were conducted on both transcriptome (Table 2) and metabolome data (Table 3) to identify differences between SH and YK during the dark period and any correlation between transcriptome and metabolome analyses of the two accessions. The metabolite pathway analysis identified two functional categories: major carbon degradation (downregulated in YK) and amino acid synthesis (upregulated in YK). Glucose, maltose, and isomaltose are within the major carbon degradation pathway, while aspartic acid, alanine, N‐acetylglutamic acid, threonine, serine, and glycine are within the amino acid synthesis pathway. However, of the 19 DEGs annotated in the reference genome, one unknown functional category including nine DEGs (Thhalv10015083 m.g, Thhalv10002969 m.g, Thhalv10023491 m.g, Thhalv10021522 m.g, Thhalv10018393 m.g, Thhalv10009345 m.g, Thhalv10015718 m.g, Thhalv10022932 m.g, and Thhalv10022943 m.g) and one category related to cell organization of two DEGs (Thhalv10029390 m.g and Thhalv10029346 m.g) were identified. Hence, our analyses did not show any correlation between the E. salsugineum transcriptome and metabolome.
3.4. Metabolomic phenotypes in the F1 hybrid exhibit transgressive heterosis
To better understand the genetic basis for observed differences in metabolite concentrations between SH and YK, we measured metabolites in F1 hybrids. Concentrations of all measured metabolites in both experiments are presented in Table S3. Of the 144 metabolites measured in the experiment comparing the two parents and hybrids, 56% of all metabolites were lower in hybrids than the predicted mid‐parent value. This included 65% of the fatty acids and 49% of carbohydrates detected (Table S3). We performed a two‐way contingency test to determine if an observed difference in the accumulation of a metabolite was predictive of heterosis for that metabolite (Table S7). We found that metabolites with accumulation differences between the parents were neither more nor less likely to exhibit accumulation differences between the F1 and the mid‐parental values (Table S7).
Hybridization can result in transgressive heterosis in which phenotypic values for the hybrids fall outside of the range of parental values. Of the 144 metabolites measured, transgressive heterosis was observed for 28. Of these, four metabolites were not observed in one of the two parents and 24 were detected in both parents and the hybrids (Figure 1). Of the 24 detected in all three genotypes, the transgressive heterosis was more likely to be negative (Figure 1; p‐value ≤ .0001 based on a Binomial exact test) and more frequently affected metabolites that did not differ in concentration between the parents (Table S7; p‐value ≤ 0.05 based on χ2 test). Thus, heterosis for the metabolome was manifested by a decrease in metabolite pool sizes in hybrids and was not preferentially associated with metabolites that contributed to the variation between the two parents. This is consistent with our observation of decreased availability of primary metabolites in the faster growing YK (Table 3; Table S3). We propose that a metabolic consequence of enhanced growth is a reduction in pool sizes of primary metabolites and greater resource utilization for anabolic metabolism.
Figure 1.
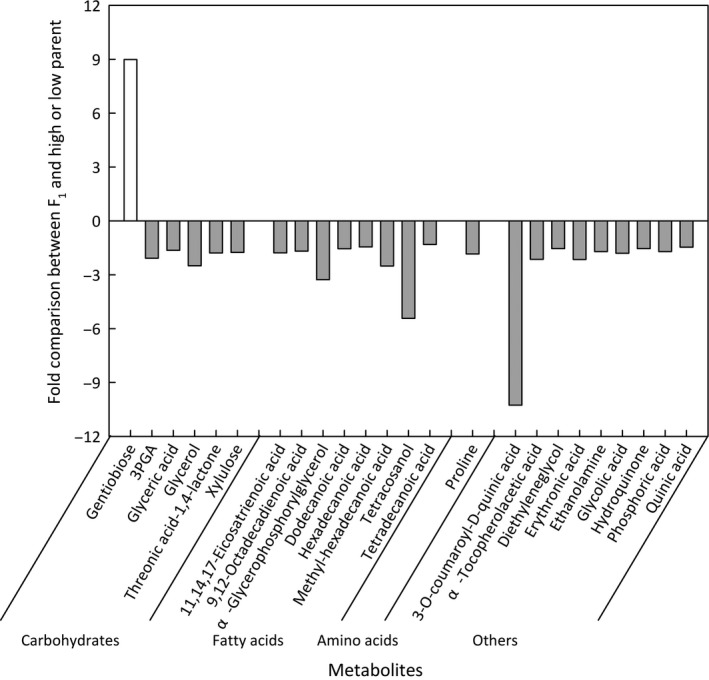
Heterosis for metabolite concentrations in F1 hybrids. Metabolites in F1 hybrids that were higher than the high parent or lower than the low parent at p‐value ≤ .05 based on two‐tailed t test are shown. The ratio is calculated as F1/high parent when F1 had a higher concentration than the high parent and low parent/F1 when F1 had a lower concentration than the low parent
4. DISCUSSION
In this study, we profiled both transcript and metabolite accumulation to identify genetic and biochemical variation during the dark period in two E. salsugineum accessions: SH and YK. We annotated novel genes present in the reference genome and identified DEGs between SH and YK in the middle of the dark period. We found that YK accumulates more fatty acids than SH, while SH accumulates sugars at higher concentrations. Although the transcriptomic and metabolic profiling results do not offer links to each other, they do offer insight into genetic and physiological differences between these accessions. Furthermore, we identified additional SNPs and provide validation of previously described SNPs, varying between these accessions that can be utilized for future research.
4.1. Validity of identified SNPs
Based on the predicted transcriptome size (Yang et al., 2013), the SNP density from our analysis is 1 SNP per 10 kb of transcribed sequence; 14,887 SNPs identified from our transcriptome sequencing data were also present in Champigny et al. (2013). However, our SNP cluster filter, which removes neighboring SNPs to account for misaligned reads at insertion–deletion polymorphisms, removed 3,604 overlapping SNPs. The removal of this set of SNPs, likely enriched for false positives, contributed to the lower SNP number detected in our study. We also acknowledge that this contributed to our false negative rate. Of the 388 SNPs that matched between our analyses of pyrosequencing data and the Sanger data, 99 were removed by our procedure. We provide a compact file containing the subset of “high‐quality” (see Materials and Methods) SNPs in Table S6. These have a SNP density of one SNP per 25 kb of transcript. This set of validated SNPs can be used for QTL mapping and fine‐mapping studies (Matsuda et al., 2015; Trick et al., 2012; Wu et al., 2016).
4.2. Identification of genes expressed in the dark period in Eutrema salsugineum
We provided expression data supporting 63% and 67% of the predicted genes in the two published reference genomes (Wu et al., 2012; Yang et al., 2013). This is likely an underestimate of the expressed genes in this species because we sampled only rosette tissue and only at night (Schaffer et al., 2001). We identified 66% of the genes identified in another transcriptome analysis of E. salsugineum (Champigny et al., 2013). Despite our study relying on lower coverage (4× vs. 8×), and quantifying expression of genes only expressed in leaves at night, we annotated 65 genes not predicted in the reference genome or identified in the previous transcriptome characterization (Tables S1 and S5). Novel genes identified in this transcriptome study but not that of Champigny et al. (2013) are likely either only expressed at night or otherwise not expressed under the conditions of the previous study, which included a 21‐hr photoperiod and low dark period temperatures.
More than 97% of the genes identified in our study are homologous to genes in A. thaliana (Table S1), consistent with the relatively close phylogenetic association of the two species (Al‐shehbaz, O'Kane, & Price, 1999). Of the 65 newly annotated genes in this study, 47 of them do not have homologs in A. thaliana. One of these novel genes has been annotated in A. lyrata and two have been annotated in S. parvula (Table S1). Therefore, we may have identified genes that are unique to this extremophile species (Wu et al., 2012).
More than 80% of the expressed genes identified in this study were detected in both SH and YK (Table S5). This indicates a conserved transcriptome between these two accessions and is consistent with previous E. salsugineum transcriptome comparisons (Champigny et al., 2013; Lee et al., 2013). PAVs, as scored by read count in the transcript profiling experiment, accounted for 19 and 12% of all genes in this experiment and Champigny et al. (2013), respectively. Only 13% of these were consistently detected as PAV over the two datasets. These genes are likely “true” PAV genes (Table S1). Other genes detected in only one of the replicates were likely due to low mRNA abundance. PAV structural variation has been observed in A. thaliana (Bush et al., 2014), maize (Springer et al., 2009; Swanson‐Wagner et al., 2010), and soybean (Haun et al., 2011). PAV genes are not typically essential (Bush et al., 2014) and may have minor effects on plant fitness (Swanson‐Wagner et al., 2010). However, genes present in only one accession could contribute to the adaptation to specific selective constraints (Bush et al., 2014) and variation in quantitative traits (Swanson‐Wagner et al., 2010). The observed phenotypic variation in growth rate and metabolism could be due to PAV, although no identified PAVs have been linked to trait differences in Eutrema. Further study utilizing molecular genetics to address the causes and consequences of natural variation in this species is needed to link these data types.
4.3. DEGs and constitutive response to abiotic and biotic stresses
The low number of candidate DEGs between the two accessions of E. salsugineum used in this study was similar to other studies; 55% of these had no reads in one of the two accessions, which could be due to a lack of sufficient depth to detect very low expression. Champigny et al. (2013) identified 381 DEGs that were present in our transcriptome but not identified as DEGs in our data. RNA‐seq experiments are often underpowered, and the lack of overlap with the previous study may be primarily an issue of low read depth and replicate numbers. Consistent with this expectation, 58% of the 381 DEGs identified previously have low expression (<4 reads; Table S1). In addition, 41% of the DEGs from Champigny et al. (2013) exhibit lower expression during the dark period in A. thaliana (Mockler et al., 2007), which may explain some of the lack of overlap in DEGs in the two studies. We identified 17 DEGs that were not identified by Champigny et al. (2013), possibly because they are only differentially expressed during the dark period or under our experimental conditions.
It appears that the relative abundance of most transcripts is similar in SH and YK, as only 0.2 and 1.9% of all genes were DEGs in our study and Champigny et al. (2013), respectively. Fourteen of the 31 DEGs identified in our study were also identified by Champigny et al. (2013), and the expression patterns were the same in both studies. This suggests that differential expression for these genes between SH and YK is consistent over light and dark periods and the two growth conditions.
Without exposure to abiotic or biotic stresses, YK expressed several stress‐responsive genes (Table 2), as also noted by Champigny et al. (2013). Two plant defensin genes within the same family were highly expressed in YK (Table 2). In A. thaliana, the plant defensin type 1 family (PDF1) is comprised of seven genes (Shahzad et al., 2013) with highly conserved sequences and identical mature peptides (Thomma, Cammue, & Thevissen, 2002). AtPDF1 genes are induced by pathogens, nonhost pathogens, methyl jasmonate (MeJA), and ethylene (ET; De Coninck et al., 2010; Manners et al., 1998; Penninckx et al., 1996; Zimmerli, Stein, Lipka, Schulze‐Lefert, & Somerville, 2004). Also, expression of AtPDF1 genes in yeast results in zinc tolerance (Shahzad et al., 2013). Eight gene models in E. salsugineum are homologous to the A. thaliana plant defensin family. Of these, one is a likely ortholog of AtPDF1.4, whereas five are annotated as most closely related to AtPDF1.2A, and two are annotated as AtPDF1.2C. Higher expression of PDF1.2 and PDF1.4 was observed in the YK accession; however, paralogous PDF1 genes are expressed in SH (Table S1).
The transcript abundance of a gene encoding E. salsugineum peptide methionine sulfoxide reductase 3 (PMSR3) was higher in YK than SH (Table 2). There are five orthologous PMSR genes in A. thaliana, PMSR1 to 5 (Rouhier, Vieira Dos Santos, Tarrago, & Rey, 2006), that are also found in E. salsugineum. The expression of PMSR3 is induced by arsenate (Paulose, Kandasamy, & Dhankher, 2010). No function in tolerance or resistance has been established for this paralog in A. thaliana. However, knockout of either PMSR2 (Bechtold, Murphy, & Mullineaux, 2004) or PMSR4 (Romero, Berlett, Jensen, Pell, & Tien, 2004) results in decreased oxidative stress tolerance and overexpression of either gene increases stress tolerance in A. thaliana. Expression of PMSR4 (but not PMSR1, PMSR2, or PMSR3) was induced in response to UV and AgNO3 in E. salsuginea SH (Mucha, Walther, Muller, Hincha, & Glaswischnig, 2015). It is plausible that the overexpression of PMSR3 by YK could provide greater oxidative stress tolerance in this accession.
4.4. Eutrema salsugineum accessions SH and YK differ in carbon metabolism
In two experiments, 125 and 144 metabolites were detected. Although the total number and specific metabolites varied somewhat across the two experiments, differences were identified between SH and YK for the 85 metabolites detected in both experiments (Table 3; Table S3). Differences across the experiments may be due to slight differences in the growth chamber environments even with identical settings, as metabolite concentrations are strongly affected by environmental conditions and environment by genotype interactions (Soltis & Kliebenstein, 2015). Also, different soilless media mixes were used in the two experiments: A more bark‐based media was used in the transcriptome and first metabolite experiments, whereas the soilless media used in the second experiment did not contain bark. However, there were consistent growth differences between the two accessions, and we focused our interpretation of the data primarily on those metabolites that were consistent across the two experiments.
The derivatization method we utilized has been widely used to detect sugars (Gullberg et al., 2004), but is less accurate for identifying and quantifying amino acids (Kaspar, Dettmer, Gronwald, & Oefner, 2009). As a result, despite the fact that E. salsugineum accumulates higher concentrations of some amino acids than Arabidopsis (Eshel et al., 2017), many amino acids were not detected in our analyses.
Higher concentrations of fatty acids and fatty acid derivatives were measured in YK, including several previously identified as structural components of membrane lipids, cuticle components, and wall‐resident suberin (Table 3; Table S3). Fatty acids contain more energy than carbohydrates when used as storage compounds and can act as an efficient storage form of reduced carbon (Taiz & Zeiger, 2010). High production of fatty acids is typical of rapidly growing tissues (Ohlrogge & Jaworski, 1997; Qin et al., 2007). Very‐long‐chain fatty acids (VLCFAs; C20:0 to C30:0) play an important role in cell elongation and expansion (Qin et al., 2007). Several VLCFAs, including docosanoic, hexacosanoic, pentacosanoic, tetracosanoic, and tricosanoic acids, were more abundant in YK than SH (Table 3), consistent with our measurements of higher growth rates of YK as compared to SH in our growth conditions (manuscript in preparation). The VLCFA tetracosanoic acid, which plays an important role in root cell growth and expansion (Qin et al., 2007), was accumulated at a higher concentration in YK (Table 3; Table S3). In addition to carbon storage, lipids are important components of membranes and the leaf cuticle (Lynch & Dunn, 2004; Tresch, Heilmann, Christiansen, Looser, & Grossmann, 2012; Zäuner, Ternes, & Warnecke, 2010). Our results are in agreement with Xu et al. (2014), who measured a greater accumulation of C22 and C24 fatty acids in the epicuticular wax of YK over SH.
Overall, SH tissues had higher concentrations of sugars than YK. These measurements of nighttime sugar concentrations were similar to previous results obtained for fructose, glucose, and raffinose in leaves of E. salsugineum harvested during the day (Eshel et al., 2017; Lee et al., 2012). The products of starch breakdown, including maltose and glucose, were more abundant in SH (Table 3; Table S3), suggesting a higher rate of starch metabolism in the lower‐biomass SH accession. This was consistent with the strong negative correlation between starch content and biomass observed in A. thaliana accessions (Sulpice et al., 2009).
A study of the correlation between specific metabolites and biomass accumulation in A. thaliana revealed twenty‐three metabolites that were correlated with biomass (Meyer et al., 2007). We detected fourteen of these twenty‐three metabolites (Table 3; Table S3). Of these, five differed between SH and YK. The concentrations of ascorbic acid, glycerol‐3‐phosphate, and raffinose were negatively correlated, and putrescine was positively correlated with biomass in Arabidopsis (Meyer et al., 2007). The levels of these metabolites also corresponded to the differences in biomass between SH and YK, indicating that the relationships between metabolites and biomass found in A. thaliana were consistent in E. salsugineum (Table 3; Table S3). This suggests that, although stress tolerance is vastly different between these two species (Amtmann, 2009; Griffith et al., 2007; Lee et al., 2012), the metabolic markers for biomass accumulation may be similar.
4.5. Increased utilization rate as a hypothesis for metabolome heterosis
More than 58% of the metabolites in F1 plants were different from the predicted mid‐parent concentration (Table S3), indicating a nonadditive effect of hybridity on the majority of the metabolome. The lower concentration of fructose and glucose in F1 hybrids suggests high rates of starch and sugar depletion to support rapid growth (Lisec et al., 2011). Transgressive heterosis was more commonly observed for metabolites that were not different between the two parents (Table S7). This suggests that allelic variation affecting differential metabolite accumulation in the parents is not responsible for the observed heterosis in the F1 metabolome. Although it is surprising that differences between the parents were not predictive of a metabolite association with heterosis, it may be that the metabolomic consequences of heterosis derived from secondary effects of an increased growth rate in F1 hybrids, rather than a causative relationship between growth rate and specific metabolites or metabolite diversity. Differences in biomass polymers and metabolites involved in anabolic growth exhibited reduced pool sizes in the more rapidly growing YK as compared to SH (Table 3; Table S3), as well as in the very rapidly growing F1 plants as compared to the parents (Table S3). Consistent with the hypothesis that utilization rate drives the heterotic effects on metabolite pool sizes, the transgressive effect overwhelmingly resulted in lower concentrations of metabolites in the hybrids (Figure 1; Tables S3 and S7). This hypothesis regarding the cause of metabolic heterosis may be a general phenomenon in plants. Indeed, the same associations have been observed in maize, in which largely negative overdominance for metabolites was found in the heterotic B73 × Mo17 hybrids (Lisec et al., 2011).
5. CONCLUSIONS
Our study contributes to the annotation of the E. salsugineum genome and provides evidence of transcriptional and metabolic differences between the SH and YK accessions. Very few differences in gene expression were detected in the middle of the dark period between these two accessions, but YK has constitutively higher expression of several plant systematic defense genes. The high‐quality SNPs identified in this study can be used with previously identified SNPs to map traits that differ in these accessions, such as tolerance to various stresses. There is evidence for contrasting carbon metabolism in these two accessions, which correlates with observed growth differences. Furthermore, metabolite profiling of the accessions and F1 hybrids supports the notion that the concentrations of key metabolites are correlated with growth rate, including the increased growth rate caused by heterosis.
Our hypothesis was that combined transcriptome and metabolome profiling of two contrasting E. salsugineum accessions might elucidate the pathway(s) related to the phenotypic differences between these contrasting accessions. The difference in carbon metabolism identified via metabolome profiling provides insights for growth differences between SH and YK. However, none of the 19 DEGs that have been annotated in the reference genome are related to the observed metabolic differences. There are two plausible explanations: (i) the additional 11 DEGs that are currently unannotated in the reference genome could provide additional evidence for the link between metabolome and transcriptome, or (ii) by increasing the number of replicates in transcriptome study, more DEGs will be identified to support further pathway identification.
COMPETING INTERESTS
The authors declare that they have no competing interests.
AVAILABILITY OF SUPPORTING DATA
All the raw data supporting the results of this article have been deposited at Edgar, Domrachev, & Lash (2002) and are accessible through GEO Series accession GSE GSE67745 at (http://www.ncbi.nlm.nih.gov/geo/query/acc.cgi?acc=GSE67745).
AUTHORS' CONTRIBUTIONS
JY and MJG performed the experiments; JY, BPD, and MVM designed the experiments; JY and BPD analyzed the data; JY, BPD, and MVM wrote the manuscript.
Supporting information
ACKNOWLEDGMENTS
Partial support to JY was provided by the U.S. Department of Agriculture, National Institute of Food and Agriculture—Agriculture and Food Research Initiative Grant no. 2010‐85117‐20607, the China Scholarship Council, and the Purdue Department of Horticulture and Landscape Architecture. We thank Dr. Scott J. Emrich and Dr. Allison Regier (current address: Genome Institute, Washington University) in the Department of Computer Science and Engineering at University of Notre Dame and Dr. Michael Gribskov in the Department of Biological Sciences at Purdue University for assistance and discussion of RNA‐seq data analysis. We thank Dr. Chan Yul Yoo (current address: Department of Botany & Plant Sciences, University of California, Riverside) for the assistance of RNA‐seq sample collection and preparation. We thank Rob Eddy and Dan Hahn for assistance with plant growth, Dr. Phillip San Miguel and the Purdue University Genomics core for RNA‐seq data production and transcriptome analysis, Dr. Alexander Ulanov and Dr. Zhong (Lucas) Li at the Metabolomics Center at the University of Illinois for assistance with the metabolomic data, and Prof. David Rhodes for discussions regarding the metabolite data.
Yin J, Gosney MJ, Dilkes BP, Mickelbart MV. Dark period transcriptomic and metabolic profiling of two diverse Eutrema salsugineum accessions. Plant Direct. 2018;2:1–15. 10.1002/pld3.32
This manuscript was previously deposited as a preprint at http://www.biorxiv.org/content/early/2017/07/15/163980.
Contributor Information
Brian P. Dilkes, Email: bdilkes@purdue.edu
Michael V. Mickelbart, Email: mickelbart@purdue.edu
REFERENCES
- Al‐shehbaz, I. A. , O'Kane, S. L. Jr , & Price, R. A. (1999). Generic placement of species excluded from Arabidopsis (Brassicaceae). Novon, 9, 296–307. 10.2307/3391724 [DOI] [Google Scholar]
- Altschul, S. F. , Gish, W. , Miller, W. , Myers, E. W. , & Lipman, D. J. (1990). Basic local alignment search tool. Journal of Molecular Biology, 215, 403–410. 10.1016/S0022-2836(05)80360-2 [DOI] [PubMed] [Google Scholar]
- Amtmann, A. (2009). Learning from evolution: Thellungiella generates new knowledge on essential and critical components of abiotic stress tolerance in plants. Molecular Plant, 2, 3–12. 10.1093/mp/ssn094 [DOI] [PMC free article] [PubMed] [Google Scholar]
- Anders, S. , & Huber, W. (2010). Differential expression analysis for sequence count data. Genome Biology, 11, R106 10.1186/gb-2010-11-10-r106 [DOI] [PMC free article] [PubMed] [Google Scholar]
- Bazakos, C. , Manioudaki, M. E. , Therios, I. , Voyiatzis, D. , Kafetzopoulos, D. , Awada, T. , & Kalaitzis, P. (2012). Comparative transcriptome analysis of two olive cultivars in response to NaCl‐stress. PLoS One, 7, e42931 10.1371/journal.pone.0042931 [DOI] [PMC free article] [PubMed] [Google Scholar]
- Bechtold, U. , Murphy, D. J. , & Mullineaux, P. M. (2004). Arabidopsis peptide methionine sulfoxide reductase2 prevents cellular oxidative damage in long nights. Plant Cell, 16, 908–919. 10.1105/tpc.015818 [DOI] [PMC free article] [PubMed] [Google Scholar]
- Benjamini, Y. , & Hochberg, Y. (1995). Controlling the false discovery rate: A practical and powerful approach to multiple testing. Journal of the Royal Statistical Society. Series B, Statistical Methodology, 57, 289–300. [Google Scholar]
- Bielecka, M. , Watanabe, M. , Morcuende, R. , Scheible, W.‐R. , Hawkesford, M. J. , Hesse, H. , & Hoefgen, R. (2014). Transcriptome and metabolome analysis of plant sulfate starvation and resupply provides novel information on transcriptional regulation of metabolism associated with sulfur, nitrogen and phosphorus nutritional responses in Arabidopsis. Frontiers in Plant Science, 5, 805 10.1007/s11105-014-0772-7 [DOI] [PMC free article] [PubMed] [Google Scholar]
- Boke, H. , Ozhuner, E. , Turktas, M. , Parmaksiz, I. , Ozcan, S. , & Unver, T. (2015). Regulation of the alkaloid biosynthesis by miRNA in opium poppy. Plant Biotechnology Journal, 13, 409–420. 10.1111/pbi.12346 [DOI] [PubMed] [Google Scholar]
- Bressan, R. A. , Zhang, C. , Zhang, H. , Hasegawa, P. M. , Bohnert, H. J. , & Zhu, J.‐K. (2001). Learning from the Arabidopsis experience. The next gene search paradigm. Plant Physiology, 127, 1354–1360. 10.1104/pp.010752 [DOI] [PMC free article] [PubMed] [Google Scholar]
- Bush, S. J. , Castillo‐Morales, A. , Tovar‐Corona, J. M. , Chen, L. , Kover, P. X. , & Urrutia, A. O. (2014). Presence‐absence variation in A. thaliana is primarily associated with genomic signatures consistent with relaxed selective constraints. Molecular Biology and Evolution, 31, 59–69. 10.1093/molbev/mst166 [DOI] [PMC free article] [PubMed] [Google Scholar]
- Champigny, M. J. , Sung, W. W. , Catana, V. , Salwan, R. , Summers, P. S. , Dudley, S. A. , … Weretilnyk, E. A. (2013). RNA‐Seq effectively monitors gene expression in Eutrema salsugineum plants growing in an extreme natural habitat and in controlled growth cabinet conditions. BMC Genomics, 14, 578 10.1186/1471-2164-14-578 [DOI] [PMC free article] [PubMed] [Google Scholar]
- Dassanayake, M. , Oh, D.‐H. , Haas, J. S. , Hernandez, A. , Hong, H. , Ali, S. , … Cheeseman, J. M. (2011). The genome of the extremophile crucifer Thellungiella parvula . Nature Genetics, 43, 913–918. 10.1038/ng.889 [DOI] [PMC free article] [PubMed] [Google Scholar]
- De Coninck, B. M. A. , Sels, J. , Venmans, E. , Thys, W. , Goderis, I. J. W. M. , Carron, D. , … Mathys, J. (2010). Arabidopsis thaliana plant defensin AtPDF1.1 is involved in the plant response to biotic stress. New Phytologist, 187, 1075–1088. 10.1111/j.1469-8137.2010.03326.x [DOI] [PubMed] [Google Scholar]
- Edgar, R. , Domrachev, M. , & Lash, A. E. (2002). Gene Expression Omnibus: NCBI gene expression and hybridization array data repository. Nucleic Acids Research, 30, 207–210. 10.1093/nar/30.1.207 [DOI] [PMC free article] [PubMed] [Google Scholar]
- Eshel, G. , Shaked, R. , Kazachovka, Y. , Khan, A. , Eppel, A. , Cisneros, A. , … Barak, S. (2017). Anastatica hierochuntica, an Arabidopsis desert relative, is tolerant to multiple abiotic stresses and exhibits species‐specific and common stress tolerance strategies with its halophytic relative, Eutrema (Thellungiella) salsugineum . Frontiers in Plant Science, 7, 1992 10.3389/fpls.2016.01992 [DOI] [PMC free article] [PubMed] [Google Scholar]
- Fiehn, O. , Kopka, J. , Dörmann, P. , Altmann, T. , Trethewey, R. N. , & Willmitzer, L. (2000). Metabolite profiling for plant functional genomics. Nature Biotechnology, 18, 1157–1161. 10.1038/81137 [DOI] [PubMed] [Google Scholar]
- Gordon, A. , & Hannon, G. J. (2010). Fastx‐toolkit. FASTQ/A short‐reads pre‐processing tools (unpublished). http://hannonlab. cshl. edu/fastx_toolkit
- Griffith, M. , Timonin, M. , Wong, A. C. E. , Gray, G. R. , Akhter, S. R. , Saldanha, M. , … Moffatt, B. (2007). Thellungiella: An Arabidopsis‐related model plant adapted to cold temperatures. Plant, Cell & Environment, 30, 529–538. 10.1111/j.1365-3040.2007.01653.x [DOI] [PubMed] [Google Scholar]
- Gullberg, J. , Jonsson, P. , Nordström, A. , Sjöström, M. , & Moritz, T. (2004). Design of experiments: An efficient strategy to identify factors influencing extraction and derivatization of Arabidopsis thaliana samples in metabolomic studies with gas chromatography/mass spectrometry. Analytical Biochemistry, 331, 283–295. 10.1016/j.ab.2004.04.037 [DOI] [PubMed] [Google Scholar]
- Gurkok, T. , Turktas, M. , Parmaksiz, I. , & Unver, T. (2015). Transcriptome profiling of alkaloid biosynthesis in elicitor induced opium poppy. Plant Molecular Biology Reporter, 33, 673–688. 10.1007/s11105-014-0772-7 [DOI] [Google Scholar]
- Hamanishi, E. T. , Barchet, G. L. H. , Dauwe, R. , Mansfield, S. D. , & Campbell, M. M. (2015). Poplar trees reconfigure the transcriptome and metabolome in response to drought in a genotype‐ and time‐of‐day‐dependent manner. BMC Genomics, 16, 329 10.1186/s12864-015-1535-z [DOI] [PMC free article] [PubMed] [Google Scholar]
- Haun, W. J. , Hyten, D. L. , Xu, W. W. , Gerhardt, D. J. , Albert, T. J. , Richmond, T. , … Stupar, R. M. (2011). The composition and origins of genomic variation among individuals of the soybean reference cultivar Williams 82. Plant Physiology, 155, 645–655. 10.1104/pp.110.166736 [DOI] [PMC free article] [PubMed] [Google Scholar]
- Hu, T. T. , Pattyn, P. , Bakker, E. G. , Cao, J. , Cheng, J.‐F. , Clark, R. M. , … Guo, Y.‐L. (2011). The Arabidopsis lyrata genome sequence and the basis of rapid genome size change. Nature Genetics, 43, 476–481. 10.1038/ng.807 [DOI] [PMC free article] [PubMed] [Google Scholar]
- Huang, J. , Lu, X. , Yan, H. , Chen, S. , Zhang, W. , Huang, R. , & Zheng, Y. (2012). Transcriptome characterization and sequencing‐based identification of salt‐responsive genes in Millettia pinnata, a semi‐mangrove plant. DNA Research, 19, 195–207. 10.1093/dnares/dss004 [DOI] [PMC free article] [PubMed] [Google Scholar]
- Inan, G. , Zhang, Q. , Li, P. , Wang, Z. , Cao, Z. , Zhang, H. , … Zhu, J. K. (2004). Salt cress. A halophyte and cryophyte Arabidopsis relative model system and its applicability to molecular genetic analyses of growth and development of extremophiles. Plant Physiology, 135, 1718–1737. 10.1104/pp.104.041723 [DOI] [PMC free article] [PubMed] [Google Scholar]
- Kaspar, H. , Dettmer, K. , Gronwald, W. , & Oefner, P. J. (2009). Advances in amino acid analysis. Analytical and Bioanalytical Chemistry, 393, 445–452. 10.1007/s00216-008-2421-1 [DOI] [PubMed] [Google Scholar]
- Lamesch, P. , Berardini, T. Z. , Li, D. , Swarbreck, D. , Wilks, C. , Sasidharan, R. , … Huala, E. (2012). The Arabidopsis Information Resource (TAIR): Improved gene annotation and new tools. Nucleic Acids Research, 40, D1202–D1210. 10.1093/nar/gkr1090 [DOI] [PMC free article] [PubMed] [Google Scholar]
- Lee, Y. P. , Babakov, A. , de Boer, B. , Zuther, E. , & Hincha, D. K. (2012). Comparison of freezing tolerance, compatible solutes and polyamines in geographically diverse collections of Thellungiella sp. and Arabidopsis thaliana accessions. BMC Plant Biology, 12, 131 10.1186/1471-2229-12-131 [DOI] [PMC free article] [PubMed] [Google Scholar]
- Lee, Y. P. , Giorgi, F. M. , Lohse, M. , Kvederaviciute, K. , Klages, S. , Usadel, B. , … Hincha, D. K. (2013). Transcriptome sequencing and microarray design for functional genomics in the extremophile Arabidopsis relative Thellungiella salsuginea (Eutrema salsugineum). BMC Genomics, 14, 793 10.1186/1471-2164-14-793 [DOI] [PMC free article] [PubMed] [Google Scholar]
- Li, H. , Handsaker, B. , Wysoker, A. , Fennell, T. , Ruan, J. , Homer, N. , … 1000 Genome Project Data Processing Subgroup . (2009). The sequence alignment/map format and SAMtools. Bioinformatics, 25, 2078–2079. 10.1093/bioinformatics/btp352 [DOI] [PMC free article] [PubMed] [Google Scholar]
- Lisec, J. , Meyer, R. C. , Steinfath, M. , Redestig, H. , Becher, M. , Witucka‐Wall, H. , … Willmitzer, L. (2008). Identification of metabolic and biomass QTL in Arabidopsis thaliana in a parallel analysis of RIL and IL populations. Plant Journal, 53, 960–972. 10.1111/j.1365-313X.2007.03383.x [DOI] [PMC free article] [PubMed] [Google Scholar]
- Lisec, J. , Römisch‐Margl, L. , Nikoloski, Z. , Piepho, H.‐P. , Giavalisco, P. , Selbig, J. , … Willmitzer, L. (2011). Corn hybrids display lower metabolite variability and complex metabolite inheritance patterns. Plant Journal, 68, 326–336. 10.1111/j.1365-313X.2011.04689.x [DOI] [PubMed] [Google Scholar]
- Liu, Q. , Wang, X. , Tzin, V. , Romeis, J. , Peng, Y. , & Li, Y. (2016). Combined transcriptome and metabolome analyses to understand the dynamic responses of rice plants to attack by the rice stem borer Chilo suppressalis (Lepidoptera: Crambidae). BMC Plant Biology, 16, 259 10.1186/s12870-016-0946-6 [DOI] [PMC free article] [PubMed] [Google Scholar]
- Livak, K. J. , & Schmittgen, T. D. (2001). Analysis of relative gene expression data using real‐time quantitative PCR and the 2‐ΔΔCT method. Methods, 25, 402–408. 10.1006/meth.2001.1262 [DOI] [PubMed] [Google Scholar]
- Lynch, D. V. , & Dunn, T. M. (2004). An introduction to plant sphingolipids and a review of recent advances in understanding their metabolism and function. New Phytologist, 161, 677–702. 10.1111/j.1469-8137.2003.00992.x [DOI] [PubMed] [Google Scholar]
- MacLeod, M. J. R. , Dedrick, J. , Ashton, C. , Sung, W. W. L. , Champigny, M. J. , & Weretilnyk, E. A. (2014). Exposure of two Eutrema salsugineum (Thellungiella salsuginea) accessions to water deficits reveals different coping strategies in response to drought. Physiologia Plantarum, 155, 267–280. 10.1111/ppl.12316 [DOI] [PubMed] [Google Scholar]
- Manners, J. M. , Penninckx, I. A. , Vermaere, K. , Kazan, K. , Brown, R. L. , Morgan, A. , … Broekaert, W. F. (1998). The promoter of the plant defensin gene PDF1.2 from Arabidopsis is systemically activated by fungal pathogens and responds to methyl jasmonate but not to salicylic acid. Plant Molecular Biology, 38, 1071–1080. 10.1023/A:1006070413843 [DOI] [PubMed] [Google Scholar]
- Margulies, M. , Egholm, M. , Altman, W. E. , Attiya, S. , Bader, J. S. , Bemben, L. A. , … Rothberg, J. M. (2005). Genome sequencing in microfabricated high‐density picolitre reactors. Nature, 437, 376–380. 10.1038/nature03959 [DOI] [PMC free article] [PubMed] [Google Scholar]
- Masclaux‐Daubresse, C. , Clément, G. , Anne, P. , Routaboul, J.‐M. , Guiboileau, A. , Soulay, F. , … Yoshimoto, K. (2014). Stitching together the multiple dimensions of autophagy using metabolomics and transcriptomics reveals impacts on metabolism, development, and plant responses to the environment in Arabidopsis . Plant Cell, 26, 1857–1877. 10.1105/tpc.114.124677 [DOI] [PMC free article] [PubMed] [Google Scholar]
- Matsuda, F. , Nakabayashi, R. , Yang, Z. , Okazaki, Y. , Yonemaru, J.‐I. , Ebana, K. , … Saito, K. (2015). Metabolome‐genome‐wide association study dissects genetic architecture for generating natural variation in rice secondary metabolism. Plant Journal, 81, 13–23. 10.1111/tpj.12681 [DOI] [PMC free article] [PubMed] [Google Scholar]
- McKenna, A. , Hanna, M. , Banks, E. , Sivachenko, A. , Cibulskis, K. , Kernytsky, A. , … DePristo, M. A. (2010). The genome analysis toolkit: A MapReduce framework for analyzing next‐generation DNA sequencing data. Genome Research, 20, 1297–1303. 10.1101/gr.107524.110 [DOI] [PMC free article] [PubMed] [Google Scholar]
- Meyer, R. C. , Steinfath, M. , Lisec, J. , Becher, M. , Witucka‐Wall, H. , Törjék, O. , … Altmann, T. (2007). The metabolic signature related to high plant growth rate in Arabidopsis thaliana . Proceedings of the National Academy of Sciences of the United States of America, 104, 4759–4764. 10.1073/pnas.0609709104 [DOI] [PMC free article] [PubMed] [Google Scholar]
- Mockler, T. C. , Michael, T. P. , Priest, H. D. , Shen, R. , Sullivan, C. M. , Givan, S. A. , … Chory, J. (2007). The DIURNAL project: DIURNAL and circadian expression profiling, model‐based pattern matching, and promoter analysis. Cold Spring Harbor Symposia on Quantitative Biology, 72, 353–363. 10.1101/sqb.2007.72.006 [DOI] [PubMed] [Google Scholar]
- Mucha, S. , Walther, D. , Muller, T. M. , Hincha, D. K. , & Glaswischnig, E. (2015). Substantial reprogramming of the Eutrema salsugineum (Thellungiella salsuginea) transcriptome in response to UV and silver nitrate challenge. BMC Plant Biology, 15, 137 10.1186/s12870-015-0506-5 [DOI] [PMC free article] [PubMed] [Google Scholar]
- Nielsen, R. , Paul, J. S. , Albrechtsen, A. , & Song, Y. S. (2011). Genotype and SNP calling from next‐generation sequencing data. Nature Reviews Genetics, 12, 443–451. 10.1038/nrg2986 [DOI] [PMC free article] [PubMed] [Google Scholar]
- Ning, Z. , Cox, A. J. , & Mullikin, J. C. (2001). SSAHA: A fast search method for large DNA databases. Genome Research, 11, 1725–1729. 10.1101/gr.194201 [DOI] [PMC free article] [PubMed] [Google Scholar]
- Ohlrogge, J. B. , & Jaworski, J. G. (1997). Regulation of fatty acid synthesis. Annual Review of Plant Physiology and Plant Molecular Biology, 48, 109–136. 10.1146/annurev.arplant.48.1.109 [DOI] [PubMed] [Google Scholar]
- Oshlack, A. , Robinson, M. D. , & Young, M. D. (2010). From RNA‐seq reads to differential expression results. Genome Biology, 11, 220 10.1186/gb-2010-11-12-220 [DOI] [PMC free article] [PubMed] [Google Scholar]
- Page, A. F. , Cseke, L. J. , Minocha, R. , Turlapati, S. A. , Podila, G. K. , Ulanov, A. , … Minocha, S. C. (2016). Genetic manipulation of putrescine biosynthesis reprograms the cellular transcriptome and the metabolome. BMC Plant Biology, 16, 113 10.1186/s12870-016-0796-2 [DOI] [PMC free article] [PubMed] [Google Scholar]
- Paulose, B. , Kandasamy, S. , & Dhankher, O. P. (2010). Expression profiling of Crambe abyssinica under arsenate stress identifies genes and gene networks involved in arsenic metabolism and detoxification. BMC Plant Biology, 10, 108 10.1186/1471-2229-10-108 [DOI] [PMC free article] [PubMed] [Google Scholar]
- Penninckx, I. A. , Eggermont, K. , Terras, F. R. , Thomma, B. P. , De Samblanx, G. W. , Buchala, A. , … Broekaert, W. F. (1996). Pathogen‐induced systemic activation of a plant defensin gene in Arabidopsis follows a salicylic acid‐independent pathway. Plant Cell, 8, 2309–2323. 10.1105/tpc.8.12.2309 [DOI] [PMC free article] [PubMed] [Google Scholar]
- Pickrell, J. K. , Marioni, J. C. , Pai, A. A. , Degner, J. F. , Engelhardt, B. E. , Nkadori, E. , … Pritchard, J. K. (2010). Understanding mechanisms underlying human gene expression variation with RNA sequencing. Nature, 464, 768–772. 10.1038/nature08872 [DOI] [PMC free article] [PubMed] [Google Scholar]
- Pilarska, M. , Wiciarz, M. , Jajic, I. , Kozieradzka‐Kiszkurno, M. , Dobrev, P. , Vankova, R. , & Niewiadomska, E. (2016). A different pattern of production and scavenging of reactive oxygen species in halophytic Eutrema salsugineum (Thellungiella salsuginea) plants in comparison to Arabidopsis thaliana and its relation to salt stress signaling. Frontiers in Plant Science, 7, 1179 10.3389/fpls.2016.01179 [DOI] [PMC free article] [PubMed] [Google Scholar]
- Qin, Y.‐M. , Hu, C.‐Y. , Pang, Y. , Kastaniotis, A. J. , Hiltunen, J. K. , & Zhu, Y.‐X. (2007). Saturated very‐long‐chain fatty acids promote cotton fiber and Arabidopsis cell elongation by activating ethylene biosynthesis. Plant Cell, 19, 3692–3704. 10.1105/tpc.107.054437 [DOI] [PMC free article] [PubMed] [Google Scholar]
- Roberts, A. , Pimentel, H. , Trapnell, C. , & Pachter, L. (2011). Identification of novel transcripts in annotated genomes using RNA‐Seq. Bioinformatics, 27, 2325–2329. 10.1093/bioinformatics/btr355 [DOI] [PubMed] [Google Scholar]
- Romero, M. , Berlett, B. S. , Jensen, P. J. , Pell, E. J. , & Tien, M. (2004). Investigations into the role of the plastidial peptide methionine sulfoxide reductase in response to oxidative stress in Arabidopsis. Plant Physiology, 136, 3784–3794. 10.1104/pp.104.046656 [DOI] [PMC free article] [PubMed] [Google Scholar]
- Rouhier, N. , Vieira Dos Santos, C. , Tarrago, L. , & Rey, P. (2006). Plant methionine sulfoxide reductase A and B multigenic families. Photosynthesis Research, 89, 247–262. 10.1007/s11120-006-9097-1 [DOI] [PubMed] [Google Scholar]
- Satou, M. , Enoki, H. , Oikawa, A. , Ohta, D. , Saito, K. , Hachiya, T. , … Motohashi, R. (2014). Integrated analysis of transcriptome and metabolome of Arabidopsis albino or pale green mutants with disrupted nuclear‐encoded chloroplast proteins. Plant Molecular Biology, 85, 411–428. 10.1007/s11103-014-0194-9 [DOI] [PMC free article] [PubMed] [Google Scholar]
- Schaffer, R. , Landgraf, J. , Accerbi, M. , Simon, V. , Larson, M. , & Wiseman, E. (2001). Microarray analysis of diurnal and circadian‐regulated genes in Arabidopsis. Plant Cell, 13, 113–123. 10.1105/tpc.13.1.113 [DOI] [PMC free article] [PubMed] [Google Scholar]
- Shahzad, Z. , Ranwez, V. , Fizames, C. , Marquès, L. , Le Martret, B. , Alassimone, J. , … Gosti, F. (2013). Plant Defensin type 1 (PDF1): Protein promiscuity and expression variation within the Arabidopsis genus shed light on zinc tolerance acquisition in Arabidopsis halleri . New Phytologist, 200, 820–833. 10.1111/nph.12396 [DOI] [PubMed] [Google Scholar]
- Singh, A. K. , Ulanov, A. V. , Li, Z. , Jayaswal, R. K. , & Wilkinson, B. J. (2011). Metabolomes of the psychrotolerant bacterium Listeria monocytogenes 10403S grown at 37 °C and 8 °C. International Journal of Food Microbiology, 148, 107–114. 10.1016/j.ijfoodmicro.2011.05.008 [DOI] [PubMed] [Google Scholar]
- Soltis, N. E. , & Kliebenstein, D. J. (2015). Natural variation of plant metabolism: Genetic mechanisms, interpretive caveats, and evolutionary and mechanistic insights. Plant Physiology, 169, 1456–1468. 10.1104/pp.15.01108 [DOI] [PMC free article] [PubMed] [Google Scholar]
- Springer, N. M. , Ying, K. , Fu, Y. , Ji, T. , Yeh, C.‐T. , Jia, Y. , … Schnable, P. S. (2009). Maize inbreds exhibit high levels of copy number variation (CNV) and presence/absence variation (PAV) in genome content. PLoS Genetics, 5, e1000734 10.1371/journal.pgen.1000734 [DOI] [PMC free article] [PubMed] [Google Scholar]
- Stein, R. J. , & Waters, B. M. (2012). Use of natural variation reveals core genes in the transcriptome of iron‐deficient Arabidopsis thaliana roots. Journal of Experimental Botany, 63, 1039–1055. 10.1093/jxb/err343 [DOI] [PMC free article] [PubMed] [Google Scholar]
- Sulpice, R. , Pyl, E.‐T. , Ishihara, H. , Trenkamp, S. , Steinfath, M. , Witucka‐Wall, H. , … Stitt, M. (2009). Starch as a major integrator in the regulation of plant growth. Proceedings of the National Academy of Sciences of the United States of America, 106, 10348–10353. 10.1073/pnas.0903478106 [DOI] [PMC free article] [PubMed] [Google Scholar]
- Sumner, L. W. , Lei, Z. , Nikolau, B. J. , & Saito, K. (2015). Modern plant metabolomics: Advanced natural product gene discoveries, improved technologies, and future prospects. Natural Product Reports, 32, 212–229. 10.1039/c4np00072b [DOI] [PubMed] [Google Scholar]
- Swanson‐Wagner, R. A. , Eichten, S. R. , Kumari, S. , Tiffin, P. , Stein, J. C. , Ware, D. , & Springer, N. M. (2010). Pervasive gene content variation and copy number variation in maize and its undomesticated progenitor. Genome Research, 20, 1689–1699. 10.1101/gr.109165.110 [DOI] [PMC free article] [PubMed] [Google Scholar]
- Taiz, L. , & Zeiger, E. (2010). Plant Physiology (5th ed). Sunderland, MA: Sinauer Associates Inc. [Google Scholar]
- Thimm, O. , Bläsing, O. , Gibon, Y. , Nagel, A. , Meyer, S. , Krüger, P. , … Stitt, M. (2004). Mapman: A user‐driven tool to display genomics data sets onto diagrams of metabolic pathways and other biological processes. Plant Journal, 37, 914–939. 10.1111/j.1365-313X.2004.02016.x [DOI] [PubMed] [Google Scholar]
- Thomma, B. P. H. J. , Cammue, B. P. A. , & Thevissen, K. (2002). Plant defensins. Planta, 216, 193–202. 10.1007/s00425-002-0902-6 [DOI] [PubMed] [Google Scholar]
- Trapnell, C. , Williams, B. A. , Pertea, G. , Mortazavi, A. , Kwan, G. , van Baren, M. J. , … Pachter, L. (2010). Transcript assembly and quantification by RNA‐Seq reveals unannotated transcripts and isoform switching during cell differentiation. Nature Biotechnology, 28, 511–515. 10.1038/nbt.1621 [DOI] [PMC free article] [PubMed] [Google Scholar]
- Tresch, S. , Heilmann, M. , Christiansen, N. , Looser, R. , & Grossmann, K. (2012). Inhibition of saturated very‐long‐chain fatty acid biosynthesis by mefluidide and perfluidone, selective inhibitors of 3‐ketoacyl‐CoA synthases. Phytochemistry, 76, 162–171. 10.1016/j.phytochem.2011.12.023 [DOI] [PubMed] [Google Scholar]
- Trick, M. , Adamski, N. M. , Mugford, S. G. , Jiang, C.‐C. , Febrer, M. , & Uauy, C. (2012). Combining SNP discovery from next‐generation sequencing data with bulked segregant analysis (BSA) to fine‐map genes in polyploid wheat. BMC Plant Biology, 12, 14 10.1186/1471-2229-12-14 [DOI] [PMC free article] [PubMed] [Google Scholar]
- Tukey, J. W. (1949). Comparing individual means in the analysis of variance. Biometrics, 5, 99–114. 10.2307/3001913 [DOI] [PubMed] [Google Scholar]
- Wang, Z. , Gerstein, M. , & Snyder, M. (2009). RNA‐Seq: A revolutionary tool for transcriptomics. Nature Reviews Genetics, 10, 57–63. 10.1038/nrg2484 [DOI] [PMC free article] [PubMed] [Google Scholar]
- Wilcoxon, F. (1945). Individual comparisons by ranking methods. Biometrics Bulletin, 1, 80–83. 10.2307/3001968 [DOI] [Google Scholar]
- Wong, C. E. , Li, Y. , Whitty, B. R. , Díaz‐Camino, C. , Akhter, S. R. , Brandle, J. E. , … Griffith, M. (2005). Expressed sequence tags from the Yukon ecotype of Thellungiella reveal that gene expression in response to cold, drought and salinity shows little overlap. Plant Molecular Biology, 58, 561–574. 10.1007/s11103-005-6163-6 [DOI] [PubMed] [Google Scholar]
- Wu, S. , Alseekh, S. , Cuadros‐Inostroza, Á. , Fusari, C. M. , Mutwil, M. , Kooke, R. , … Brotman, Y. (2016). Combined use of genome‐wide association data and correlation networks unravels key regulators of primary metabolism in Arabidopsis thaliana . PLoS Genetics, 12, e1006363 10.1371/journal.pgen.1006363 [DOI] [PMC free article] [PubMed] [Google Scholar]
- Wu, T. D. , & Watanabe, C. K. (2005). GMAP: A genomic mapping and alignment program for mRNA and EST sequences. Bioinformatics, 21, 1859–1875. 10.1093/bioinformatics/bti310 [DOI] [PubMed] [Google Scholar]
- Wu, H.‐J. , Zhang, Z. , Wang, J.‐Y. , Oh, D.‐H. , Dassanayake, M. , Liu, B. , … Xie, Q. (2012). Insights into salt tolerance from the genome of Thellungiella salsuginea . Proceedings of the National Academy of Sciences of the United States of America, 109, 12219–12224. 10.1073/pnas.1209954109 [DOI] [PMC free article] [PubMed] [Google Scholar]
- Xu, X. , Feng, J. , Lü, S. , Lohrey, G. T. , An, H. , Zhou, Y. , & Jenks, M. A. (2014). Leaf cuticular lipids on the Shandong and Yukon ecotypes of saltwater cress, Eutrema salsugineum, and their response to water deficiency and impact on cuticle permeability. Physiologia Plantarum, 151, 446–458. 10.1111/ppl.12127 [DOI] [PubMed] [Google Scholar]
- Yang, R. , Jarvis, D. E. , Chen, H. , Beilstein, M. A. , Grimwood, J. , Jenkins, J. , … Wang, X. (2013). The reference genome of the halophytic plant Eutrema salsugineum . Frontiers in Plant Science, 4, 46 10.3389/fpls.2013.00046 [DOI] [PMC free article] [PubMed] [Google Scholar]
- Yeo, M. T. S. , Carella, P. , Fletcher, J. , Champigny, M. J. , Weretilnyk, E. A. , & Cameron, R. K. (2014). Development of a Pseudomonas syringae‐Eutrema salsugineum pathosystem to investigate disease resistance in a stress tolerant extremophile model plant. Plant Pathology, 64, 297–306. 10.1111/ppa.12271 [DOI] [Google Scholar]
- Zäuner, S. , Ternes, P. , & Warnecke, D. (2010). Biosynthesis of sphingolipids in plants (and some of their functions). Advances in Experimental Medicine and Biology, 688, 249–263. [DOI] [PubMed] [Google Scholar]
- Zimmerli, L. , Stein, M. , Lipka, V. , Schulze‐Lefert, P. , & Somerville, S. (2004). Host and non‐host pathogens elicit different jasmonate/ethylene responses in Arabidopsis . Plant Journal, 40, 633–646. 10.1111/j.1365-313X.2004.02236.x [DOI] [PubMed] [Google Scholar]
Associated Data
This section collects any data citations, data availability statements, or supplementary materials included in this article.
Supplementary Materials
Data Availability Statement
All the raw data supporting the results of this article have been deposited at Edgar, Domrachev, & Lash (2002) and are accessible through GEO Series accession GSE GSE67745 at (http://www.ncbi.nlm.nih.gov/geo/query/acc.cgi?acc=GSE67745).