

SUMMARY
Loss of the nuclear RNA binding protein TAR DNA binding protein-43 (TDP-43) into cytoplasmic aggregates is the strongest correlate to neurodegeneration in amyotrophic lateral sclerosis and frontotemporal degeneration. The molecular changes associated with the loss of nuclear TDP-43 in human tissues are not entirely known. Using subcellular fractionation andfluorescent-activated cell sorting to enrich for diseased neuronal nuclei without TDP-43 from post-mortem frontotemporal degeneration-amyotro-phic lateral sclerosis (FTD-ALS) human brain, we characterized the effects of TDP-43 loss on the transcriptome and chromatin accessibility. Nuclear TDP-43 loss is associated with gene expression changes that affect RNA processing, nucleocytoplas-mic transport, histone processing, and DNA damage. Loss of nuclear TDP-43 is also associated with chromatin decondensation around long interspersed nuclear elements (LINEs) and increased LINE1 DNA content. Moreover, loss of TDP-43 leads to increased retrotransposition that can be inhibited with antiretro-viral drugs, suggesting that TDP-43 neuropathology is associated with altered chromatin structure including decondensation of LINEs.
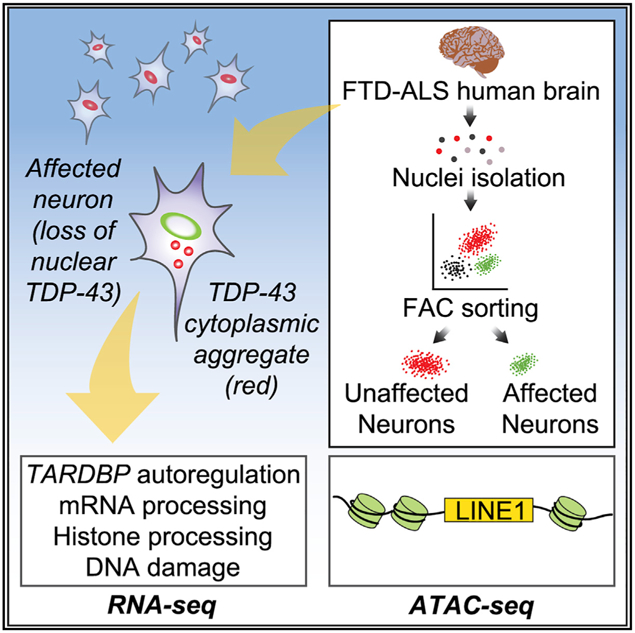
Graphical Abstract
In Brief
Liu et al. fractionated and sorted for diseased neuronal nuclei from post-mortem FTD-ALS human brains and showed that loss of an RNA-binding protein, TDP-43, altered the transcriptome and chromatin accessibility. Their results suggest that loss of nuclear TDP-43 is associated with decondensation of LINE retrotransposons.
INTRODUCTION
Amyotrophic lateral sclerosis (ALS) and frontotemporal degeneration (FTD) are neurodegenerative diseases with overlapping clinical, genetic, and pathologic features. ALS is a debilitating neuromuscular disease characterized by the loss of motor neurons, whereas FTD is a fatal neurocognitive disease characterized by frontal and temporal lobe degeneration. Many affected individuals exhibit signs or symptoms of both ALS and FTD (Strong et al., 2017), and genetic mutations have been linked to both diseases (Ling et al., 2013). However, even in genetically homogeneous populations, mechanisms of neurodegeneration are not entirely clear. A key pathologic hallmark of both diseases is the loss of nuclear TAR DNA binding protein-43 (TDP-43) into cytoplasmic aggregates (Neumann et al., 2006).
TDP-43 is a nuclear RNA binding protein involved in multiple facets of RNA processing, ranging from mRNA splicing, transcription, transport, and stability (Lee et al., 2011). TDP-43 binds to introns and 3′ UTRs (Lagier-Tourenne et al., 2012; Polymenidou et al., 2011; Tollervey et al., 2011), as well as repetitive elements such as long interspersed nuclear elements (LINEs) (Li et al., 2012). Although typically silenced, LINEs can be active in the human genome (Muotri et al., 2005) and may be reactivated in response to cellular stress, aging, or disease (Bundo et al., 2014; Coufal et al., 2011; De Cecco et al., 2019; Muotri et al., 2010). Increased endogenous retroviral activity has also been observed in ALS individuals (Bowen et al., 2016; McCormick et al., 2008; Steele et al., 2005), raising the possibility that aberrant TDP-43 activity can influence the expression of repeat elements.
Because TDP-43 pathology is tightly linked to neurodegeneration, efforts have been made using animal and cellular models to understand disease mechanisms (Huang et al., 2012; Igaz et al., 2011; Scekic-Zahirovic et al., 2016; Sharma et al., 2016; Tsai et al., 2010; Wils et al., 2010; Xu et al., 2010). Unfortunately, these models do not fully phenocopy TDP-43 pathology, leading to the use of human pathologic tissue to infer disease mechanisms (Krach et al., 2018; Cooper-Knock et al., 2012; Prudencio et al., 2015). However, molecular analysis of post-mortem human brain is associated with several challenges. Because the neocortex is a heterogeneous mix of cell types, whole neocortex molecular analyses of neurodegenerative disease tissues often reflect average changes from reactive glial or in-flammatory cells rather than primary pathogenic disease mechanisms within diseased neurons (Azevedo et al., 2009; Prudencio et al., 2015; Srinivasan et al., 2016).
We developed a fractionation method based on subcellular fractionation and fluorescent-activated cell sorting (FACS) isolation of diseased neuronal nuclei without TDP-43 versus uninvolved normal neuronal nuclei from post-mortem human FTD-ALS brains to identify the role of nuclear TDP-43 loss on the transcriptome and chromatin accessibility. We applied this method to show that predicted features of TDP-43 loss are actually occurring in diseased neurons including global gene expression changes, abundant splicing changes, altered TARDBP autoregulation, and selective vulnerability of superficial neocortical neurons. Furthermore, we identified increased chromatin accessibility around LINEs and increased LINE1 DNA in neuronal nuclei without TDP-43 from post-mortem brain, and demonstrate that the loss of TDP-43 protein is associated with increased LINE1 retrotransposition. These results suggest that loss of TDP-43 alters nuclear chromatin structure including decondensation of heterochromatic LINEs.
RESULTS
Isolation of Pathologic Neuronal Nuclei
To determine the molecular alterations associated with TDP-43 pathology, we used FACS to sort for neuronal nuclei from the frozen neocortex of post-mortem FTD-ALS brains (Figure 1A; subject demographics in Table S1). Nuclei were isolated and stained for NeuN to identify neurons and TDP-43 to identify cells with pathologic loss of nuclear TDP-43 protein. Flow cytometry plots of non-diseased control individuals show non-neuronal (NeuN-negative, TDP-43 positive) and neuronal (NeuN-positive, TDP-43 positive) populations. In contrast, FTD-ALS tissues demonstrated a third population of pathologic neuronal nuclei with loss of TDP-43 protein (NeuN-positive, TDP-43 negative, circled in Figure 1B) representing on average 7.05% of all neuronal nuclei (<2% of all cells). Confocal imaging of sorted nuclei showed pathologic neuronal nuclei expressing NeuN without TDP-43 versus normal nuclei expressing both NeuN and TDP-43 (Figure 1C).
Figure 1. Flow-Seq of Post-mortem Human Brain Is Able to Enrich for Neuronal Populations of Interest.

(A) Schematic of Flow-Seq to isolate neuronal nuclei from post-mortem brain. NGS, next-generation sequencing.
(B) Flow cytometry plots assessing TDP-43 fluorescence as a function of NeuN fluorescence of non-diseased post-mortem brain (left) versus an FTD-ALS brain (right). The non-diseased brain shows a non-neuronal population (NeuN-negative, TDP-43 positive) and neuronal TDP-43-positive (NeuN-positive, TDP-43 positive) population. The FTD-ALS brain has an extra population (circled) of a neuronal population without TDP-43 (NeuN-positive, TDP-43 negative).
(C) Confocal microscopy of sorted populations with and without TDP-43 assessing NeuN (green), TDP-43 (red), and DAPI (blue) fluorescence. Scale bar, 10 mm.
(D) Coverage plots of non-neuronal (GFAP, MBP) and neuronal (GAD2) genes in unsorted nuclei and neuronal nuclei with TDP-43.
(E) Fisher’s exact test demonstrated that there was an enrichment of non-neuronal genes (gray and black) in significantly downregulated genes (557 out of 1,049; odds ratio = 8.57; p < 2.2E − 16), depletion of neuronal genes (red) in significantly downregulated genes (10 out of 1,049; odds ratio 0.31; p = 1.8E − 4), and enrichment of neuronal genes (red) within significantly upregulated genes (6 out of 22; odds ratio = 12.19; p = 3.5E − 5) between sorted neuronal nuclei and unsorted nuclei.
To ensure that sorting enriched for neurons, we selected two cases for limited RNA sequencing (RNA-seq) from equal numbers of unsorted versus sorted neuronal nuclei (NeuNpositive, TDP-43 positive). Coverage plots for glial fibrillary acidic protein (GFAP) and myelin basic protein (MBP), genes ex-pressed in astrocytes and oligodendrocytes, respectively, showed a marked depletion of sequencing reads in sorted nuclei compared with unsorted nuclei. In contrast, sorted nuclei had more reads mapped to neuronal genes like glutamate decarbox-ylase 2 (GAD2; Figure 1D). To determine whether sorting resulted in a global enrichment of neuronal genes, differential gene expression analysis was done to compare sorted and unsorted nuclei. Among 1,071 differentially expressed genes (DEGs), 575 genes were annotated as being specifically expressed in neurons or non-neuronal (glial or endothelial) cells based on ex-isting annotations (Zhang et al., 2014). There was a significant enrichment of neuronal genes within upregulated genes in sorted nuclei (Fisher’s exact test odds ratio = 12.19; p = 3.5E−5), and a corresponding enrichment of glial and endothelial genes within downregulated genes in sorted nuclei (odds ratio = 8.57; p < 2.2E−16; Figure 1E). Thus, FACS from human brain was able to enrich for neuronal nuclei and deplete glial and endothelial nuclei.
RNA Dysregulation Associated with the Loss of TDP-43
Seven cases of FTD-ALS were fluores-cent-activated cell (FAC) sorted to obtain RNA from equal numbers of TDP-43-positive (TDPpos) neuronal nuclei and TDP-43-negative (TDPneg) neuronal nuclei. To ensure genetic homogeneity, only cases with C9orf72 hexanucleotide repeat expansions were used as the most common genetic cause of ALS and FTD. RNA-seq resulted in 1.126 billion unique reads across 14 samples with a mean of 80,400,486 reads per library.
We hypothesized that TDP-43 loss would lead to pronounced dysregulation of the transcriptome. Principal-component analysis (PCA) of the entire dataset showed that principal component 1 (PC1) explained 21% of the variation, whereas PC2 explained 19% of the variation (Figure 2A). Interestingly, when libraries corresponding to each individual were paired (shown as lines connecting pairs of TDPpos and TDPneg nuclei from the same individual), the slope for each case was similar, suggesting that the variation explained by PC1, and to some extent PC2, is in large part associated with the loss of TDP-43, and that the bulk of changes associated with TDP-43 pathology was consis-tent between subjects.
Figure 2. Loss of TDP-43 Is Associated with Abundant Gene Expression Changes Linked to Genes Involved in DNA Damage and Repair, Proteostasis, and RNA Processing.

(A) Principal component analysis of gene expression data with shape denoting gender and color denoting presence or absence of TDP-43. Lines are drawn to connect nuclei with and without TDP-43 from the same individual.
(B) MA plot of DEGs due to presence (TDPpos) or absence of TDP-43 (TDPneg), with red dots being significant DEGs (FDR < 0.05) and black dots being expressed genes.
(C) Boxplot of gene size (bp) in all expressed genes and significant DEGs (t test, p < 2.2E − 16) showing significant DEGs due to TDP-43 loss are longer.
(D) Boxplot of intron size (bp) in all expressed genes and significant DEGs (t test, p < 2.2E − 16) showing significant DEGs due to TDP-43 loss have longer introns.
(E) Chi-square (χ2) analysis reveals significant enrichment of DEGs in the subset of genes with TDP-43 binding sites compared with all genes (30.80% versus 17.48%; χ2 = 945.7; p < 0.0001).
(F) χ2 analysis reveals significant enrichment of genes with TDP-43 binding sites in DEGs compared with all genes (67.54% versus 38.34%; χ2 = 1652; p < 0.0001).
(G) Network analysis of a weighted gene co-expression network analysis (WGCNA) module derived from significantly DEGs linked to TDP-43 loss. Genes are categorized by gene ontology term based on color. Purple genes are enriched in both red and blue pathways. Orange genes are enriched in both yellow and red pathways.
Out of 31,898 expressed genes, 5,576 were significantly DEGs due to the loss of TDP-43, representing a large proportion of the transcriptome (2,849 upregulated and 2,727 downregulated genes; Figure 2B). We predicted that DEGs would be enriched for TDP-43 targets. Indeed, DEGs had significantly longer gene lengths (t test, p < 2.2E − 16) and intron lengths (t test, p < 2.2E − 16) (Figures 2C and 2D), consistent with the fact that TDP-43 binds to long pre-mRNAs (Lagier-Tourenne et al., 2012; Polymenidou et al., 2011). Moreover, genes with known TDP-43 binding sites demonstrated a significant enrichment of DEGs compared with all genes (30.80% versus 17.48%; χ2 = 945.7; p < 0.0001; Figure 2E). Similarly, whereas 38.84% of tran-scripts in the entire transcriptome have TDP-43 binding sites, 67.54% of the significantly DEGs have TDP-43 binding sites (χ2 = 1652; p < 0.0001; Figure 2F). These analyses indicate that abnormal regulation of transcripts directly bound to TDP-43 protein likely contributes to the molecular aberra-tions observed in pathologic human tissue. Notably, because neuronal genes are on average longer than non-neuronal genes, these results may also partially reflect the fact that this study was limited to neuronal cells.
Gene ontology analysis of significantly upregulated genes in TDPneg nuclei demonstrated that there was an enrichment of genes related to ALS and FTD pathogenesis including mRNA processing, synapses, the Golgi apparatus, nucleocytoplasmic transport, and histones (Table S2) (Amlie-Wolf et al., 2015; Frei-baum et al., 2015; Gonatas et al., 1992; Jovici c et al., 2015; Poly-menidou et al., 2011; Zhang et al., 2015). Conversely, gene ontology analysis of significantly downregulated genes showed an enrichment of genes related to synaptic transmission, some of which are involved in GABAergic synapses as observed in TDP-43 mouse models (Amlie-Wolf et al., 2015) (Table S3).
Weighted gene co-expression network analysis, based on significant DEGs, revealed a total of 22 modules that significantly correlated with TDP-43 loss. Enrichment analysis within each module revealed one module that contained a network of genes enriched for RNA splicing, ubiquitin processing, and DNA repair (Figure 2G). This was consistent with the role of TDP-43 in regulating RNA splicing and the role of the ubiquitin-proteosome system in clearing misfolded protein aggregates, and raises the possibility that the loss of nuclear TDP-43 may be associated with DNA damage.
TARDBP Autoregulation and Selective Vulnerability
TDP-43 protein is able to autoregulate its own transcript by binding to a cryptic intron within its 3′ UTR that promotesintron splicing and usage of downstream polyadenylation sites, resulting in a longer transcript isoform that is retained within the nucleus and subsequently degraded (Avendaño-Vázquez et al., 2012; Ayala et al., 2011). We predicted that TDP-43 autoregulation can be observed in human tissue. The loss of nuclear TDP-43 protein is predicted to reduce TARDBP autoregulation, which should manifest as decreased splicing of the 3′ UTR intron and a reduction of nuclear TARDBP transcripts with extended 3′ UTRs. Based on these known effects of TDP-43 protein on the TARDBP transcript, three predictions were made: (1) increased coverage of the 3′ UTR TDP-43 binding site in TDPneg nuclei, (2) decreased coverage of the extreme 3′ UTR in TDPneg nuclei, and (3) reduced overall TARDBP expression in TDPneg nuclei. Figure 3A shows the TARDBP locus where two regions in the TARDBP 3′ UTR are highlighted: the TDP-43 protein binding site (highlighted peach) and the extreme 3′ UTR region (highlighted purple). Indeed, quantification of the sequencing reads spanning the 3′ UTR TDP-43 binding site show that TDPneg nuclei compared with TDPpos nuclei have significantly reduced splice junction reads (t test, p = 0.0014; Figure 3B) and a corresponding increase of reads at the TDP-43 binding site (t test, p = 0.010; Figure 3C), indicating decreased splicing of the cryptic 3′ UTR intron in TDPneg nuclei as predicted. More-over, there was a significant reduction in TARDBP reads (t test, p = 0.0015; Figure 3D), including reads within the extreme 3′ UTR in TDPneg nuclei (t test, p = 0.0018; Figure 3E). Thus, loss of nuclear TDP-43 protein in pathologic human neurons leads to a loss of TARDBP autoregulation.
Figure 3. Transcriptome Linked to Loss of TDP-43 Highlights TARDBP Autoregulation and Selective Vulnerability in Human Post-mortem Brain.

(A) Coverage plot of TARDBP of TDPpos versus TDPneg nuclei showing reads mapped to the TDP-43 binding site (shaded red) and the longer extreme 3′ UTR (shaded blue).
o(B) Junction reads across the TDP-43 binding site were normalized to total TARDBP reads, showing fewer junction reads in TDPneg versus TDPpos nuclei (n = 7 pairs; t test, p = 0.0014).
(C) Reads mapping to the TDP-43 binding site were normalized to total TARDBP reads, showing more binding site reads in TDPneg versus TDPpos nuclei (n = 7 pairs; t test, p = 0.010).
(D) Reads mapping to TARDBP were quantified normalized to total reads, showing fewer reads in TDPneg versus TDPpos nuclei (n = 7 pairs; t test, p = 0.0015).
(E) Reads within the extreme 3′ UTR of the TARDBP gene were normalized to the reads across TARDBP, showing fewer extreme 3′ UTR reads in TDPneg versus TDPpos nuclei (n = 7 pairs; t test, p = 0.0018).
(F) Representative immunohistochemistry of TDP-43 aggregates from one of the sequenced cases showing preferential TDP-43 pathology in superficial layers (layer II) and little TDP-43 pathology in deeper cortical layers (layer V/VI). Scale bars, 100 mm; 50 mm (inset).
(G) Significantly upregulated and downregulated genes were annotated according to cortical layers where red colors correspond to layers IV–VI and black/gray colors correspond to layers I–III genes. Enrichment of upper cortical neurons within significantly upregulated genes in TDPneg nuclei (χ2 = 26.36, p < 0.0001) and enrichment of lower cortical neurons within significantly downregulated genes (χ2= 25.69, p < 0.0001) in TDPneg nuclei were observed.
Immunohistochemistry for TDP-43 pathology has demonstrated selective vulnerability of superficial neocortical neurons (Lee et al., 2017), as exemplified in Figure 3F. To determine whether this selective vulnerability was also reflected in the RNA-seq data, neuronal genes expressed in specific cortical layers were annotated (Bernard et al., 2012; Darmanis et al., 2015; Hawrylycz et al., 2012; Molyneaux et al., 2007; Zeisel et al., 2015) (Table S4). Out of all annotated neuronal genes, there was a significant enrichment of upper cortical layer (I–III) genes (χ2= 26.36, p < 0.0001) and significant depletion of lower cortical layer (IV–VI) genes in TDPneg nuclei (χ2= 25.69, p < 0.0001) (Figure 3G). Therefore, RNA-seq of pathologic human neurons is capable of identifying the molecular fingerprints of selective vulnerability specific to TDP-43 pathology.
Loss of TDP-43 Is Associated with Global RNA Splicing Alterations
Because TDP-43 is known to regulate pre-mRNA splicing, we tested whether TDPneg nuclei exhibit splicing alterations. Loss of TDP-43 was associated with 1,044 significant alternatively spliced events of which 49.62% were skipped exons, 22.03% were mutually exclusive exons, 15.13% were retained introns, 8.52% were alternative 3′ splice sites, and 4.69% were alternative 5′ splice sites (Figure 4A). The number of inclusion versus exclusion events for each alternative splicing category was similar between TDPpos and TDPneg nuclei (Figure 4B). Based on these and the above results, RNA-seq of pathologic human neurons was able to demonstrate that the human disease ex-hibits many of the predicted features of dysfunctional TDP-43 activity including abundant gene expression changes involving TDP-43-targeted RNAs, loss of TARDBP autoregulation, selective vulnerability of superficial neocortical neurons, and abundant splicing alterations.
Figure 4. Alternative Splicing Associated with Loss of TDP-43.

(A) Representative examples of alternative splicing changes with color of each event denoted in the pie chart. Solid lines correspond to canonical splicing event, and dotted lines correspond to alternative splicing event. Alternatively spliced events upon TDP-43 loss are quantified in the pie chart on the right.
(B) Mean inclusion levels of TDPneg nuclei were plotted against mean inclusion levels of TDPpos nuclei for each queried alterative splicing event with significant alternative splicing events in red (FDR < 0.05). The darker a dot is, the more junction read counts there were for a particular splicing event. Numbers indicate the percentage of inclusion events.
Loss of TDP-43 Is Associated with Decondensation of LINE Elements
We previously described that neuronal nuclei with TDP-43 aggregates in human brain tissues are associated with larger nuclei, and that TDP-43-transgenic mice similarly show nucleomegaly, a profound loss of heterochromatin, and altered histone RNA processing (Amlie-Wolf et al., 2015). Our RNA-seq data above identified changes in genes involved in histone regulation, DNA repair, and DNA damage (Table S2; Figure 2G). Thus, we hypothesized that TDP-43 loss may be associated with altered chromatin states. FACS was used to isolate neuronal nuclei for ATAC-seq to examine changes in chromatin accessibility in TDPpos and TDPneg nuclei from the same seven FTD-ALS samples used for RNA-seq. On average, 31.1 million uniquely mapped reads were obtained per library after filtering and deduplication.
To quantify chromatin accessibility, we created non-overlap-ping genomic bins of 1,000 bp among the 22 human autosomes, resulting in a total of 2,875,012 bins. These genomic bins were used to obtain normalized ATAC-seq read counts to ascertain whether the loss of TDP-43 was associated with regions with altered chromatin accessibility. PCA revealed that PC1 and PC3, which explain 25% and 9% of the variance within the ATAC-seq data, respectively, showed the highest correlation with TDP-43 status (Figure 5A). PC2, which explained 14% of the variance, did not correlate with any tested experimental variable including TDP-43 status, gender, or date of extraction (data not shown).
Figure 5. Decondensation of LINEs in Post-mortem Human Neuronal Nuclei without TDP-43.

(A) Principal component analysis of ATAC-seq bin accessibility with shape denoting gender and color denoting condition with a line drawn for each individual.
(B) MA plot of bin accessibility changes linked to TDP-43 loss with red dots being significantly differentially open bins (FDR < 0.05) and black being non-significant bins.
(C) Percentage of bins mapped to genic elements (promoter, 5′ UTR, exon, intron, 3′ UTR), intergenic repeat regions, or intergenic regions in all autosomal bins (left), significantly closed genomic bins in TDPneg nuclei (center), or significantly open genomic bins in TDPneg nuclei (right). χ2 test was performed to determine enrichment of repeats in open regions versus closed regions (62.71% versus 29.45%;χ2= 368, p < 0.0001), or enrichment of repeats in open regions versus all autosomal bins (62.71% versus 56.11%;χ2= 19.06, p < 0.0001).
(D) Percentage of bins annotated as repeat elements that belong to repeat families such as long interspersed nuclear elements (LINEs), short interspersed nuclear elements (SINEs), long terminal repeats (LTRs), low complexity DNA (DNA), rolling circle (RC), satellite repeats, simple repeats or other (rRNA, small nuclear RNA [snRNA], signal recognition particle RNA [srpRNA]) in University of California, Santa Cruz (UCSC) RepeatMasker tracks in all autosomal bins (left), significantly closed bins in TDPneg nuclei (center), or significantly open bins in TDPneg nuclei (right).χ2 test was done to determine enrichment of LINEs in open versus closed bins (79.72% versus 37.14%; χ2= 56.41, p < 0.0001) and in open versus all bins (79.72% versus 55.90%; χ2= 48.73, p < 0.0001).
(E) Representative coverage plots of LINEs that are significantly more accessible (FDR < 0.05).
3,457 significantly differentially accessible genomic regions were identified, of which 858 genomic regions were significantly more accessible and 2,599 regions were more closed in TDPneg nuclei (false discovery rate [FDR] < 0.05; Figure 5B). Differentially accessible genomic bins were annotated based on the presence of gene-associated elements (promoter, 5′ UTR, intron, exon, 3′ UTR) or intergenic repeat elements (hereafter called “re-peats”). The remaining regions were designated as non-repeat intergenic regions (hereafter called “intergenic”; Figure 5C). Interestingly, open genomic regions were significantly enriched for repeats compared with closed genomic regions (62.71% versus 29.45%; χ2 = 368, p < 0.0001) and compared with all genomic regions (62.71% versus 56.11%; χ2 = 19.06, p < 0.0001). Conversely, open genomic regions were significantly depleted of genes (promoters, UTRs, exon, or intron) compared with closed genomic regions (27.33% versus 48.17%; χ2 = 140; p < 0.0001). These analyses suggested that the loss of TDP-43 protein is associated with decondensation of intergenic repeat chromatin. Because intergenic repeat elements are typically heterochromatic, in contrast with genic regions, which are often euchromatic, these results suggest that there may be an overall euchromatinization of pathologic neuronal nuclei, similar to that observed in transgenic mice (Amlie-Wolf et al., 2015).
To investigate the specific repeat family that may be associated with TDP-43 loss, we further subdivided bins annotated as repeats into repeat subtypes. This revealed that open genomic regions were highly enriched for LINEs compared with closed genomic regions (79.72% versus 37.14%;χ2 = 56.41, p < 0.0001) and compared with all genomic regions (79.72% versus 55.90%; χ2 = 48.73, p < 0.0001) (Figure 5D). In contrast, other repetitive elements are either not enriched in open genomic regions (short interspersed nuclear elements:5.2% versus 5.71%; χ2 = 0.03822, p = 0.85) or were significantly decreased (long terminal repeats [LTRs]: 8.5% versus 47.6%; χ2 = 63.81, p < 0.0001). Although it is unclear whether decondensation of LINE elements is a direct result of loss of TDP-43 protein as opposed to a more general reactive phenomenon, TDPneg nuclei appear to exhibit some specificity toward decondensation of LINEs in contrast with other hetero-chromatic repeat elements such as LTRs. Finally, visual inspection of ATAC-seq coverage plots verified decondensation of LINE chromatin in TDPneg nuclei compared with TDPpos nuclei (Figure 5E). Therefore, our cell-type-specific ATAC-seq analyses of post-mortem human brain suggest that the loss of TDP-43 protein is associated with enhanced chromatin accessibility of LINEs.
LINE1 DNA Content Is Increased in Nuclei without TDP-43
The open reading frame 2 (ORF2) element of active LINEs encodes for a bifunctional protein that has reverse transcriptase and endonuclease activities. Moreover, increased reverse transcriptase activity has been associated with ALS (McCormick et al., 2008; Steele et al., 2005). Thus, we hypothesized that the loss of TDP-43 protein is associated with increased LINE1 DNA content. LINE1 ORF2 DNA was quantified using qPCR from sorted neuronal nuclei, normalized to SATA satellite DNA content as a control repetitive DNA element that is not subject to retrotransposition or cell-to-cell variation. Paired analysis revealed that TDPneg nuclei exhibited significantly more LINE1 ORF2 DNA than TDPpos nuclei (Figure 6A; paired t test: p = 0.0262). These results suggest that there may be an accumulation of LINE1 nucleic acids in TDPneg nuclei, consistent with the previously reported increase in reverse transcriptase activity in ALS (McCormick et al., 2008; Steele et al., 2005), which can potentially increase LINE1 DNA content even in the absence of complete retrotransposition (Goodier, 2016).
Figure 6. Loss of TDP-43 Is Associated with Increased Retro-transposition.

(A) qPCR quantification of L1ORF2 DNA normalized to SATA repeat DNA in TDPpos and TDPneg neuronal nuclei (n = 7 pairs; t test, p = 0.0262).
(B) Immunofluorescence image of CRISPR/Cas9-engineered TARDBP knockout cells (red = TDP-43, blue = DAPI). Scale bar, 5 μm.
(C) Immunoblot of TDP-43 (top) and GAPDH (bottom) from cells transfected with Cas9 only (left) versus Cas9 with one of two guide RNAs used to knock out TARDBP (sgRNA1 and sgRNA2, middle and right).
(D) Chromatin immunoprecipitation with anti-H3K9me3 or non-specific IgG from HeLa cells transfected with Cas9 alone versus Cas9 with one of two different guide RNAs (sgRNA1 and sgRNA2) that target TARDBP followed by qPCR for LINE1 DNA. Data are shown as mean + SEM (n = 2 independent replicates; two-way ANOVA: TARDBP knockout p = 0.0020, H3K9me3 versus IgG p < 0.0001; interaction p = 0.0022; post hoc analysis with Bonferroni correction *p < 0.05, ***p < 0.001).
(E) Retrotransposition assay using a LINE1-GFP plasmid containing ORF1, ORF2, and a reverse orientation sequence of EGFP harboring an internal intron. After transcription, the intron within EGFP is spliced out followed by reverse transcription and integration of the DNA into genomic DNA, resulting in EGFP expression only from cells that have undergone retrotransposition.
((F and G) Representative flow cytometry dot plots of untransfected cells (F) and LINE1-GFP-transfected cells (G). GFP fluorescence reflects retro-transposition, and propidium iodide (PI) counterstain is used to assess viability.
((H) Retrotransposition efficiency as measured by %GFP expression in trans-fected with LINE1-GFP with either Cas9 only, or Cas9 with one of two different guide RNAs (sgRNA1 and sgRNA2) that target TARDBP (n = 8 independent experiments with three technical replicates in each experiment). TARDBP knockout increases retrotransposition (Cas9 3.57%; sgRNA1 4.27%, p < 0.0001; sgRNA 4.03%, p = 0.0001). Lamivudine (3-TC) reduced retro-transposition activity irrespective of TDP-43 knockout (n = 4 independent experiments with three technical replicates in each experiment; 44.7% decrease down to 1.97%; p < 0.0001). Analyzed using a mixed effects linear regression model and shown as β + SEM (see Table S5).
Loss of TDP-43 Increases Retrotransposition Activity
To test whether the loss of TDP-43 can enhance retrotransposition, we measured LINE1 activity in HeLa cells with and without nuclear TDP-43. TDP-43 was knocked out from HeLa cells using CRISPR/Cas9 with two different guide RNAs specific to TARDBP. Immunofluorescence demonstrated the loss of nuclear TDP-43 in transfected cells (Figure 6B) corresponding to knockout of 81.5% ± 0.05% and 73.4% ± 0.03% of cells expressing single-guide RNA 1 (sgRNA1) and sgRNA2, respectively (mean ± SE, n = 3). Immunoblotting showed marked reduction of TDP-43 protein expression in knockout cells (Figure 6C). Moreover, chromatin immunoprecipitation with an antibody against the heterochromatin mark H3K9me3 versus non-specific immunoglobulin G (IgG) indicated that TARDBP knockout was associated with reduced H3K9 methylation of LINE1 chromatin (Figure 6D).
This cellular model of TDP-43 nuclear loss was coupled with a retrotransposition assay where HeLa cells were transfected with a plasmid encoding LINE1-GFP sequences that included ORF1 (an RNA binding protein required for retrotransposition), ORF2 (an endonuclease and reverse transcriptase required for retrotrans-position), and a reverse orientation sequence of EGFP harboring an internal intron. GFP fluorescence reflects retrotransposition in that GFP protein can only be expressed if transcription, splicing, and retrotransposition occur followed by transcription of GFP from the genomic integration site (Figure 6E). Flow cytometry was used to quantify the proportion of cells expressing GFP using gates to identify GFP-negative cells versus GFP-positive cells, as shown for normal HeLa cells (Figure 6F) versus LINE1-GFP-transfected HeLa cells (Figure 6G). Moreover, using a LINE1-GFP construct harboring a disabling D205A mutation within ORF1 resulted in no fluorescence (data not shown).
HeLa cells were transfected with the LINE1-GFP plasmid with a plasmid encoding Cas9 alone versus the LINE1-GFP plasmid with a plasmid encoding Cas9 together with one of the two different guide RNAs to knock out TDP-43 expression. Flow cy-tometric quantification of GFP-positive cells demonstrated that TARDBP knockout resulted in a significant increase of GFP-ex-pressing cells, indicative of an increase in retrotransposition (Figure 6G; Cas9 only 3.57%; sgRNA1 4.269%, p < 0.0001; sgRNA24.025%, p = 0.0001). Importantly, control experiments where the LINE1-GFP plasmid was replaced with a plasmid that drives GFP expression irrespective of retrotransposition demonstrated that TARDBP knockout has no effect on GFP expression (Figure S1).
Lamivudine (3-TC) is a reverse transcriptase inhibitor currently used to treat HIV infection, which has been shown to inhibit LINE1 retrotransposition (Dai et al., 2011; Gulick et al., 1997; Thomas et al., 2017). To confirm that GFP fluorescence in this assay is linked to retrotransposition, we determined whether addition of 3-TC can inhibit retrotransposition activity using the same assay described above. Indeed, 3-TC treatment inhibited retrotransposition activity in all cells (44.7% reduction, p < 0.0001) irrespective of whether TDP-43 was cleared (Figure 6G). These results support a link between the loss of nuclear TDP-43 protein and LINEs in FTD-ALS.
DISCUSSION
Because experimental models of TDP-43 proteinopathy do not faithfully recapitulate all the pathologic features of ALS or FTD, experimental results need to be validated in the context of human disease. However, the cellular heterogeneity of the human brain hampers molecular analysis, requiring novel tech-niques to uncover the molecular changes associated with human neuropathologies. This is particularly true in the context of this study, where TDPneg nuclei comprise <2% of all cells. We present a study using post-mortem human brain that deepens our understanding of the functional consequences associated with TDP-43 pathology. By isolating pathologic neuronal nuclei versus nuclei from relatively unaffected neurons within the same tissue, we show that it is possible to bypass the complex-ities inherent to brain heterogeneity by isolating a specific subpopulation of pathologic neurons.
TDP-43 is an RNA binding protein that functions broadly in RNA processing ranging from splicing, mRNA stability, and mRNA transport (Lee et al., 2011). The loss of TDP-43 was expected to lead to wide changes in the nuclear transcriptome. Indeed, a sizable proportion of the transcriptome is altered, including transcripts involved in RNA processing, nucleocytoplasmic transport, and synaptic transmission. Alterations specifically affected long genes including transcripts with TDP-43 binding sites, concor-dant with prior experimental data showing the preferential binding of TDP-43 to long introns (Lagier-Tourenne et al., 2012; Polymenidou et al., 2011; Tollervey et al., 2011). Moreover, numerous splicing changes were identified in TDPneg nuclei including altered splicing of a cryptic intron in the 3′ UTR of TARDBP, which leads to a loss of TARDBP autoregulation (Avendaño-Vázquez et al., 2012; Ayala et al., 2011; Igaz et al., 2011). Finally, we observed the molecular fingerprints of selective vulnerability in that transcripts associated with superficial neocortical neurons were significantly enriched by our method. Notably, this indicates that not all of the transcriptomic alterations observed in this data-set are due to loss of TDP-43, because features that are likely up-stream of TDP-43 pathology, such as neuronal subtype identity, are present. Future studies including single-cell sequencing methods may help to disentangle the changes that are specific to the loss of nuclear TDP-43 as opposed to changes caused by cell-type identity that cannot be entirely addressed in our study. Importantly, demonstrating that several predicted molecular changes can be seen in TDPneg nuclei serves as an important validation that our method of neuronal nuclei sorting from post-mortem human brain is robust and able to capture salient features of TDP-43 pathology.
Having shown that post-mortem fractionation of human brain can validate the predicted molecular aberrations associated with TDP-43 pathology, we used our method to further investigate potential disease-associated pathways. Chromatin remodeling has been implicated in aging and neurodegeneration. Oxidative stress has been linked to DNA damage that contributes to the chromatin changes observed during aging (Kirkwood, 2005). In the context of neurodegeneration, tau protein, which forms neurofibrillary tangles in Alzheimer’s disease, alters heterochromatin organization, increases DNA breaks, and increases transcription of heterochromatic regions (Frost et al., 2014; Man-suroglu et al., 2016). We have shown that neuronal nuclei with TDP-43 pathology from FTD-ALS subjects exhibit nucleome-galy, and mice overexpressing cytoplasmic TDP-43 show nucle-omegaly, loss of heterochromatin, and aberrant histone mRNA processing (Amlie-Wolf et al., 2015). These findings suggest that chromatin relaxation, particularly around repetitive elements, may be a fundamental phenomenon in aging or stressed neurons. Our current transcriptome study of TDPneg neuronal nuclei from human brain tissue revealed dysregulation genes that regulate histone processing, DNA damage, and DNA repair. This prompted us to perform ATAC-seq, which revealed decompaction of genomic regions harboring LINEs in TDPneg nuclei.
LINEs are retrotransposable elements that can be active in both the germline and in somatic cells (Beck et al., 2010; Coufal et al., 2009; Erwin et al., 2014; Evrony et al., 2012). LINEs and other repetitive elements are strictly heterochromatinized in order to suppress their expression and downstream genotoxic effects. TDP-43 has been shown to bind to repetitive elements and transposable elements (Li et al., 2012; Saldi et al., 2014), and has been postulated to be involved in suppressing repetitive element activation (Li et al., 2012). Moreover, LINE and LTR families were depressed in a Drosophila TDP-43 model (Krug et al., 2017), again suggesting that TDP-43 is involved in suppressing repetitive elements. Increased LINE retrotransposition has been described in other diseases such as schizophrenia, Rett syndrome, and ataxia telangiectasia (Bundo et al., 2014; Coufal et al., 2011; Muotri et al., 2010). Furthermore, activation of transposable elements has been observed in an age-dependent fashion in Drosophila brain, contributing to memory decline and mortality (Li et al., 2013). Tau expression in Drosophila promotes neurodegeneration in part due to transposable elements, and pathologic tau has been associated with expression of transposable elements in Alzheimer’s disease tissues (Guo et al., 2018; Sun et al., 2018). Thus, LINE1 retrotransposition may contribute to several mal-adaptive processes, raising the possibility that decondensation of LINE1 elements may be a secondary generalized reaction to neurodegenerative processes as opposed to a specific sequela of the loss of nuclear TDP-43 protein.
Even though the damaging effects of retrotransposition are likely sufficient to induce neurotoxicity, LINE expression can be deleterious even in the absence of retrotransposition. We do not have evidence from our studies that TDP-43 pathology is associated with retrotransposition per se, although retrotransposition has been observed in neuronal cells (Baillie et al., 2011; Erwin et al., 2016; Evrony et al., 2012, 2015, 2016; Faulkner and Garcia-Perez, 2017; Macia et al., 2017; Up-ton et al., 2015). There is growing evidence supporting the reactivation of endogenous retroviruses and an increase in reverse transcriptase activity in ALS individuals (Li et al., 2015; McCormick et al., 2008; Prudencio et al., 2017; Steele et al., 2005). Indeed, toxicity may stem from multiple additional mechanisms such as the formation of DNA breaks or the accumulation of abnormal nucleic acid complexes like DNA-RNA hybrids, both of which may occur secondary to the expression of repetitive genomic elements (De Cecco et al., 2019; Lin et al., 2009; Sciamanna et al., 2013).
In conclusion, we demonstrate here a sorting method that circumvents the complexities associated with the molecular and cellular heterogeneity of the diseased human brain. Many of the disease processes predicted to be associated with FTD-ALS and TDP-43 proteinopathies were indeed observed in the human brain. Furthermore, TDP-43 pathology appears to decompact LINE chromatin, raising the possibility of increased transposon activity. The evidence for an interaction between TDP-43 and LINEs stems from multiple sources including: (1) the presence of altered DNA damage and repair transcriptional networks, (2) ATAC-seq data suggesting that TDP-43 pathology is associated with enhanced LINE1 chromatin accessibility,(3) increased LINE1 DNA content in TDPneg nuclei, and (4) enhanced LINE1 retrotransposition in TDP-43 knockout cells. Collectively, these results raise the possibility that pharmaco-logic inhibition of retrotransposon activities, even in the absence of overt retrotransposition, may mitigate the neurotoxic effects of TDP-43 pathology. Future studies including single-cell genomics studies that assess the extent of retrotransposition in FTD-ALS and the relative contribution of retrotransposon activity toward neurotoxicity may provide additional evidence as to whether pharmacologic inhibition of reverse transcriptase activity in FTD-ALS can have potential therapeutic benefit.
STAR★METHODS
CONTACT FOR REAGENT AND RESOURCE SHARING
Further information and requests for resources and reagents should be directed to and will be fulfilled by the Lead Contact, Edward B. Lee (edward.lee@pennmedicine.upenn.edu).
EXPERIMENTAL MODEL AND SUBJECT DETAILS
Human autopsy brain tissues
Human autopsy tissue was obtained from the University of Pennsylvania Center for Neurodegenerative Disease Research Neurode-generative Disease Brain Bank as described (Toledo et al., 2014) where all cases were diagnosed pathologically as FTLD-TDP with or without motor neuron disease. Informed consent from next of kin for autopsy was obtained for all cases. Clinical, pathological and demographic information is available as Table S1 including the presence of any co-morbid pathologies.
Cell culture
HeLa cells were obtained from ATCC (Manassas, Virginia) and tested negative for mycoplasma. HeLa cells were maintained at 37 degrees in DMEM with 10% fetal bovine serum, 5 mM L-glutamine, and penicillin/streptomycin.
METHOD DETAILS
Human brain nuclei isolation and FACS
Middle frontal neocortex was dounce homogenized using pestil B (Kimble Chase, Rockwood, TN, USA) in 0.25M sucrose in TKM (50mM Tris, 25mM KCl, 5 mM MgCl2) buffer. The homogenate was adjusted to 1.6M using 2.3M sucrose in TKM. The homogenate was spun on a 1.8M sucrose cushion in TKM using a SW41 rotor on the Beckman Coulter XPN-80 ultracentrifuge at 40,000 g for 40 minutes at 4 C (Beckman Coulter Inc, Indianapolis, IN, USA). Isolated nuclei were stained with Alexa Fluor 647 conjugated to 2089 (rabbit polyclonal C-terminal anti-TDP-43 antibody, Center for Neurodegenerative Disease Research, University of Pennsylva-nia), Alexa Fluor 488 conjugated to NeuN (EMD Millipore, Billerica, MA, USA), and DAPI (Invitrogen, Carlsbad, CA, USA). Alexa Fluor 647 was conjugated to 2089 according to the APEX Alexa Fluor 647 Antibody labeling kit protocol (Thermo Fisher Scientific, Waltham, MA, USA). Stained nuclei were sorted for single cells based on DAPI, NeuN and TDP-43 fluorescence on the BD FACSAria II (BD Biosciences, San Jose, CA, USA) at 20 psi on 100mm nozzle.
RNA Isolation and RNA-seq Library Generation
35,000 to 100,000 nuclei were sorted into Buffer RLT and RNA was extracted using the standard AllPrep DNA/RNA Micro kit protocol (QIAGEN, Germantown, MD, USA). RNA was amplified using the Ovation RNA-Seq System V2 (NuGEN, San Carlos, CA, USA) according to the manufacturer’s protocol and resulting cDNA was quantified by Nanodrop 2000 (Thermo Fisher). cDNA was sheared using the Covaris S2 (Covaris, model S2, Woburn, MA, USA) to 200 base pairs and the resulting cDNA library was created using the Ovation Ultralow Library System kit (NuGEN) according to the manufacturer’s protocol. The size distribution of the library was assessed using BioAnalyzer Lab Chip 1000 (Agilent, Santa Clara, CA, USA), and quantified using the Qubit dsDNA kit (Invitrogen) and Kapa Biosystems Library Quantification kit (KapaBiosystems, Boston, MA). cDNA libraries were pooled, clustered on the cBot and sequenced using 100 or 125 base pairs paired end reads on the HiSeq 2000 or 2500 (Illumina, San Diego, CA, USA).
Generation of ATAC-seq libraries
ATAC-seq libraries were generated using an established protocol (Buenrostro et al., 2013) with slight modifications. Briefly, 30,000 sorted nuclei were centrifuged at 1,000 g for 10 min at 4°C. Pellets were resuspended in Tn5 transposase reaction mix (Illumina) and incubated at 37°C for 30 min followed by purification using MinElute PCR purification kit (QIAGEN). Following purification, library fragments were amplified using the Nextera index kit (Illumina), using the following cycling conditions: 72°C for 5 min, 98°C for 30 s, followed by 5 cycles of 98°C for 10 s, 63°C for 30 s and 72°C for 1 min. Amplification optimization was performed using a small aliquot of the reaction mixture. In total, libraries were amplified between 11–16 cycles. Next libraries were size selected for fragments in size of 150 to 1200 bp using SPRIselect beads (Beckman-Coulter). The size distribution of the libraries was assessed using the BioAnalyzer Lab Chip 1000 and quantified by Qubit HS DNA kit as well as by qPCR (KAPA Biosystems). Libraries were pooled and sequenced on the HiSeq 2500 (Illumina) generating 100 bp single-end reads.
LINE1 qPCR assay
LINE1 DNA content was determined with an established LINE1 qPCR assay protocol (Coufal et al., 2009) with slight modifications. Briefly, nuclei were extracted from frozen post-mortem brain of seven FTD/ALS cases (the same cases that were used for RNA-seq and ATAC-seq) and FACS-sorted according to TDP-43 status. For each case, an equal number of TDPpos and TDPneg neuronal nuclei were used for genomic DNA extraction. 70,000–105,000 nuclei were sorted into lysis buffer RLY from the NucleoSpin DNA RapidLyse kit (Macherey-Nagel, Bethlehem, PA, USA). According to the manufacturer’s instructions, proteinase K was added and nuclei were incubated at 56°C for 1 hour in a thermomixer set to 800 rpm. Based on the total volume of the proteinase K digest reaction the volume of binding buffer RLB was increased. Each sample was spun through the provided spin columns. Washing steps were done according to the manufacturer’s instructions. Genomic DNA was eluted with buffer RLE and genomic DNA concentrations were determined with the Qubit high sensitivity dsDNA kit. Oligonucleotide PCR primers were purchased from Sigma Genosys (Sigma-Aldrich, St Louis, MA, USA) and TaqMan-MGB probes from Applied Biosystems (Thermo Fisher Scientific). Primers against L1ORF2 (Forward: 5′ TGCGGAGAAATAGGAACACTTTT 3′ and Reverse: 5′ TGAGGAATCGCCACACTGACT 3′) and SATA (Forward: 5′ GGTCAATGGCAGAAAAGGAAAT 3′ and Reverse: 5′ CGCAGTTTGTGGGAATGATTC 3′) described in Wils et al. (2010) were used. Taqman probes for L1ORF2 (VIC-CTGTAAACTAGTTCAACCATT-MGBNFQ) and SATA (6-FAM-TCTTCGTTTCAAAACTAG-MGBNFQ) were also used in the same master mix reaction. qPCR experiments were performed on the ABI StepOne Plus (Thermo Fisher Scientific) and using TaqMan Fast Advanced Master Mix (Thermo Fisher Scientific). The multiplexing reaction was optimized by limiting reaction components: 150 nM of the L1ORF2 primers, 900 nM of the SATA primers and 250 nM of the TaqMan probes were used in each qPCR reaction. Each qPCR reaction was run using five different gDNA concentrations (72 pg, 76 pg, 80 pg, 84 pg and 88 pg) and in triplicate. We required qPCR reactions to exhibit minimal to no variance in cycles to threshold (Ct) values for L1ORF2 and SATA between technical replicates, and minimal to no differences in Ct values for SATA between matched TDPpos and TDPneg nuclei. These criteria were chosen as TDPpos versus TDPneg nuclei were extracted from the same case material and therefore should have minimal variation in the number SATA repeats. LINE1 DNA content was determined by obtaining the ratio of DCt values for L1ORF2 over SATA and compared between TDPpos and TDPneg nuclei by using a paired t test.
LINE1 Retrotransposition Assay
The retrotransposition assay protocol was performed as described with minor modifications (Kopera et al., 2016). HeLa cells were cultured in Dulbecco’s Modified Eagle’s Medium (DMEM) with 10% fetal bovine serum (FBS), 100U/ml penicillin-streptomycin (Pen/Strep), 2mM L-glutamine at 37°C and 5% CO2. Briefly, HeLa cells were seeded at density of 150,000 cells per 6 well overnight. To test the effects of TDP-43 loss, Fugene 6 (Promega, Madison, WI) was used to cotransfect cells with pEF06R (Addgene plasmid #42940, (Farkash et al., 2006)) and a plasmid expressing the Cas9 enzyme alone (Addgene plasmid # 62988, (Ran et al., 2013)) or the Cas9 enzyme with 2 different guide RNAs targeting the TARDBP genes (sgRNA 1 top: 5′ CACCGCCCATGGAAAACAACCGAAC 3′;sgRNA 1 bottom: 5′ AAACGTTCGGTTGTTTTCCATGGGC 3′; sgRNA 2 top: 5′ CACCGACATCCGATTTAATAGTGTT 3′; sgRNA 2 bottom: 5′ AAACAACACTATTAAATCGGATGTC 3′). Concurrently, control cells were co-transfected using the same plasmids except that pMSCV-PIG (Addgene plasmid #21654, (Mayr and Bartel, 2009)) was used instead of pEF06R as a GFP control. 24 hours after co-transfection, the transfection reaction was stopped by exchanging the medium. Puromycin selection at 1.5mg/mL was started 3 days after transfection and replaced on day 5, followed by puromycin selection at 0.75mg/mL on day 7. Cells were collected 9 days after transfection for flow cytometry. Cells were trypsinized, washed, and resuspended in DMEM without phenol red and 2% FBS with propidium iodide (PI) solution for live/dead analysis. Stained cells were analyzed using the BD FACSCanto machine (BD Biosciences). Cells were gated for single cells using side scatter versus forward scatter, then for PI and GFP fluorescence on FlowJo (FlowJo, Ashland, OR, USA). GFP positive cells were normalized to all viable (PI negative) cells to calculate the percentage of GFP positive cells. For cells that were treated with lamivudine (3-TC; Sigma-Aldrich, St Louis, MA, USA), the assay was done in the same way but cells were pre-treated with 100 mM 3-TC 2 hours before transfection and 100 mM 3-TC was added every day for the time course of the experiment. Triplicate cultures were assessed over eight independent experiments. A mixed-effects linear regression model using the R package “nlme” was used to determine whether there was a significant relationship between TDP-43 expression, retrotransposon activity and drug treatment interaction where the experiment was the random variable. Relationships with a p value < 0.05 were considered significant.
Western blotting
HeLa cells that were transfected with (1) Cas9 plasmid with or without the two guide RNAs to knockout TARDBP and (2) pEF06R plasmid were collected 9 days after transfection. Cells were lysed in radioimmunoprecipitation assay buffer (50 mM Tris pH 8.0, 150 mM NaCl, 5 mM EDTA, 1% NP −40, 0.5% sodium deoxycholate, 0.1% sodium dodecyl sulfate), sonicated in 5 pulses and cellular debris was pelleted at 55,000RPM at 4°C for 30min in TLA55 (Beckman Coulter Inc). Protein concentration was determined using Pierce BCA Protein Assay kit (Thermo Fisher Scientific) according to the kit. Equal amounts of protein lysate was added into an 8% SDS-PAGE Tris-glycine gel and run using the Bio-rad Mini-Protean system (Bio-Rad, Hercules, CA). The gel was transferred onto a 0.2 mm nitrocellulose membrane using Bio-rad Trans-Blot Turbo Transfer system (Bio-Rad, Hercules, CA). An antibody against the C-terminal end of TDP-43 (10782–2-AP, ProteinTech, Rosemont, IL) was used for immunoblotting. The immunoblots were imaged using the LI-COR Odyssey Infrared Imaging system (Li-COR, Lincoln, NE).
Immunofluorescence
HeLa cells transfected with (1) Cas9 plasmid with or without the two guide RNAs to knockout TARDBP for 6 days were seeded onto poly-D lysine-coated coverslips overnight. Cells were fixed with 4% paraformaldehyde (Electron Microscropy Sciences, Hatfield, PA), permeabilized with 0.2% Triton-X (Thermo Fisher Scientific), blocked with 5% FBS, and stained with 10782–2-AP and Alexa Fluor 568 (Invitrogen). Coverslips were mounted onto glass slides using ProLong Gold Antifade Mountant with DAPI (Thermo Fisher Scientific).
Chromatin Immunoprecipitation
HeLa cells were transfected with 500ng each of Cas9 alone vector versus Cas9 vectors encoding sgRNAs targeting TARDBP as described above. Cells were puromycin selected for two days and allowed to recover until nine days post-transfection. Cells were cross-linked with 1% formaldehyde at 37 degrees for 10 minutes followed by quenching with 125uM Glycine. Cells were lysed (0.5% SDS, 10mM EDTA, 50mM Tris/HCl, pH 8) and sonicated on high power for 30 cycles using a Bioruptor 300 (Diagenode, Denville, NJ). Five mg of chromatin was incubated overnight at four degrees with Protein A Dynabeads (Life Technologies) and 10 mL of antibody against H3K9me3 (Cell Signaling #13969) or non-specific IgG. Beads were washed with buffers of increasing stringency (low salt, high salt, lithium chloride and TE buffer) and DNA was eluted in buffer containing 1% SDS. RNA and protein were digested using RNase A (Thermo Scientific) and proteinase K (Promega). DNA was purified using a PCR purification kit (QIAGEN) and two ml of a 1:1000 dilution was input into a Taqman qPCR reaction as described above. Percentage of input was calculated and normalized to control (Cas9 alone) samples.
QUANTIFICATION AND STATISTICAL ANALYSIS
Pre-processing, mapping and filtering of RNA-seq data
Raw sequencing reads were demultiplexed through the University of Pennsylvania Functional Genomics Core. FastQC (Version 0.11.3; (Andrews, 2010)) was used to assess sequencing read quality. Reads were mapped to the human genome (GRCh38, GENCODE release 22; (Harrow et al., 2012)) using STAR (Version 2.2.4 with option–outFilterIntronMotifs RemoveNonCanonical; (Dobin et al., 2013)) with default parameters and only uniquely mapping reads were selected for further analysis. Ribosomal and mitochondrial reads were removed using modified scripts from the PORT pipeline (https://github.com/itmat/Normalization). Coverage plots for all uniquely mapped reads were computed using sam2cov (https://github.com/khayer/sam2cov/). SAM files were converted to BAM files using samtools view and BAM files were sorted by coordinate with samtools sort.
Creation of non-overlapping gene, exon and intron annotations
Annotations were based on the comprehensive gene annotation file of the GENCODE Release 22 (GRCh38.p2). The GTF file downloaded from GENCODE (https://www.gencodegenes.org/human/release_22.html) was loaded into R (Version 3.2.2; (R Core Team, 2015), R Foundation for Statistical Computing, Vienna, Austria) and converted into a TranscriptDb object with the makeTranscriptDbFromGFF tool in the Bioconductor package GenomicFeatures (Version 1.22.8;(Lawrence et al., 2013)). From the TranscriptDb object, all annotated Ensembl genes and their exons were obtained using exonsBy (by = “gene”). Ensembl gene ids were replaced by official gene symbols using biomaRt (Version 2.26.1). Genes with several Ensembl gene IDs were combined into one record. For each duplicated gene, overlapping exons were combined into single exons. Thus, genes were defined as the sequence between the first base of the first exon and the last base of the last exon. Introns were defined as the gap regions between non-overlapping exons. Furthermore, regions shared by overlapping genes were removed to count reads that map to one gene or to genic elements (exon or intron) from one gene.
Differential gene expression analysis
The mapped, filtered RNA sequencing reads were counted using a custom R script including the R packages Rsamtools (1.22.0), GenomicFeatures (1.22.8) and GenomicAlignments (1.6.3;(Lawrence et al., 2013)). Briefly, sorted BAM files were loaded into R (3.2.2) using readGAlignmentPairs and the number of reads mapping to genes, mapping to exons or introns, was computed using findOverlaps (with options type = “within” and ignore.strand = TRUE) and countSubjectHits. Genes were analyzed for differential expression using the R package DESeq2 (1.10.1;(Love et al., 2014)). Paired analysis was used to determine differences between TDPpos and TDPneg nuclei (option design = ∽experiment+condition in DESeqDataSetFromMatrix tool where experiment is the subject id). Batch effects, mainly caused by gender, were identified with the R package sva (3.18.0) and removed according to the DESeq2 vignette.
WGCNA and Gene Ontology Analysis
Gene ontology analysis of significantly differentially expressed genes with gene symbols was performed using EnrichR according to 2015 gene ontology terms (Kuleshov et al., 2016). Pathways with an adjusted p value < 0.05 were considered significantly enriched pathways. Weighted gene co-expression network analysis was done using the R package DESeq2 and WGCNA (1.51). First, counts were normalized and transformed using functions estimateSizeFactors, DESeq and getVarianceStabilizedData. The pickSoftThreshold function was used for the selection of the soft thresholding power b. A power of 16 was chosen which was the lowest power for which the scale-free topology fit index reaches 0.9. This was then used to derive the adjacency matrix from the normalized counts. To minimize effects of noise and spurious associations, the adjacency matrix was transformed into a Topological Overlap Matrix using the function TOM and the corresponding dissimilarity (1-TOM) was calculated. Next hierarchical clustering and the branch cutting algorithm Dynamic Tree Cut (function cutreeDynamic with minimum cluster size of 21) were used to identify co-expression modules. Modules with high correlation (> 0.8) were merged into a common module using function mergeCloseModules. The resulting module eigengenes of each module were correlated with TDP-43 status to identify modules whose co-expression can be linked to TDP-43 status using the function cor (with option use = “p”) and corPvalueStudent (to calculate p values). EnrichR was used to identify genes that were enriched for pathways related to ubiquitin processing, RNA splicing and DNA repair within a module that significantly correlated with TDP-43 status. The similarity matrix and connections for these genes were then output into VisANT using the function exportNetworkToVisANT. The nodes were color coded and clustered according to the specific pathway as described in the legend.
Alternative splicing analysis
All FASTQ files were trimmed to 100bp using a Python script, aligned to GRCh38 using STAR, and ribosomal and mitochondrial reads were removed as described in previous sections. The resulting SAM files were converted to sorted BAM files using samtools and rMATS.3.0.9 (Shen et al., 2014) was run using default parameters with the following options (-t paired –len 100 –c 0.05 – analysis P). Significant alternative splicing events were used if Bonferroni-Hochberg multiple testing adjusted p values were less than 0.05.
RNA binding protein CLIP analysis
Published TDP-43 iCLIP data from SH-SY5Y cells (Tollervey et al., 2011) was used to analyze TDP-43 binding sites. Raw hg18 Bowtie files were converted to SAM files using samtools with the bowtie2sam.pl and then converted to FASTQ files in UNIX. The resulting files were aligned to hg38 transcriptome using STAR with the following parameters (–runThreadN 8–outSAMAttribute All– outFilterMultimapScoreRange 0–alignIntronMax 50000–outFilterMatchNMin 15–outFilterMatchNminOverLread 0.9–outSAMtype BAM SortedByCoordinate). PIPECLIP (Chen et al., 2014) was run using the python script with the sorted BAM file with the following parameters (−l 25 −m 2 −c 3 −r 0 −M 0.01 −c 0.01 −s hg38). The resulting BED files were used for subsequent analysis. Using R, the “GenomicRanges” package was used to determine whether coordinates of RNA binding protein sites overlapped with differentially expressed genes’ genomic coordinates using the findOverlaps command. The number of genes with RNA binding protein sites were quantified and used to test for enrichment of differentially expressed genes with RNA binding protein sites with chi-square tests performed on GraphPad Prism (GraphPad, San Diego, CA, USA). Significant enrichment was detected with p values less than 0.05.
Preprocessing, mapping and filtering of ATAC-seq data
Sequencing reads were demultiplexed by the University of Pennsylvania Functional Genomics Core and the raw read FASTQ files from four sequencing runs were merged for each sample using the bash command cat. Sequencing read quality was assessed with FastQC (Version 0.11.3). Nextera paired-end adaptor sequences were removed from reads using Trimmomatic in single end mode (Version 0.36 with option -phred33, seedMismatches = 2, palindromeClipThreshold = 30, simpleClipThreshold = 10 and option MINLEN:36; (Bolger et al., 2014)). Only reads with a minimum length of 36 bp were kept after trimming and were aligned against the human genome (GRCh38, GENCODE release 25) using STAR (Version 2.2.4 with option–alignIntronMax 1 and–alignMatesGapMax 1800; (Dobin et al., 2013)) with default parameters. Reads that (1) mapped to more than one locus; (2) mapped to the mitochondrial genome; and (3) were read duplicates were excluded. Filtering was done with samtools (0.1.19) and MarkDuplicates (option REMOVE_DUPLICATES = true) from the Picard tools (2.3.0) was run for the deduplication. Next, the resulting bam files were converted to bed files using bedtools (2.24.0). Finally, reads were offset by +4 bp if they mapped to the positive strand and by 5 bp if they mapped to the negative strand. Thereby, the 5′ end of the alignment matches the Tn5 transposase cut site.
Identification and annotation of differentially accessible genomic regions
The human autosomes were divided into 1,000 bp long non-overlapping bins using bedtools makewindows tool. Next, reads mapping to each bin were counted using findOverlaps and countSubjectHits functions from the R package GenomicAlignments. Bins with less than 4 average read count over all 14 samples were excluded from the analysis. Next the Bioconductor package edgeR (3.12.1) was used to identify differentially accessible genomic regions. Briefly, differences in library composition due to differences in sequencing depth were adjusted for by calculation of a scaling factor with the function calcNormFactors from the edgeR package. Paired analysis (option design = ~ patient+condition where patient is the subject id and option robust = TRUE in function estimateDisp) and a generalized linear model (GLM) likelihood ratio test was used to determine differences between TDPpos and TDPneg nuclei (glmFit function).
Annotation of bins with genomic and repeat elements
For genomic partition analysis, UCSC knownGene annotation GFF files and RepeatMasker repeat annotation files for the hg38 genome build were downloaded from the UCSC table browser. A custom awk script was then used to extract 5′ UTR exons and in-trons, 3′ UTR exons and introns, and exons and introns for each protein coding gene. Promoter annotations were defined as 1,000bp upstream of the first exon in the transcript, either coding or in the UTR. The GFF files were then converted to BED format and parsed to only include canonical chromosomes (chr1−22, chrX, chrY), after which all overlapping exons were merged together (bedtools v2.18.1 merge command) and the intervals were sorted. Then, mutually exclusive genomic element annotations were generated using a hierarchical scheme where any base pair overlapping multiple annotations is assigned to a class following the hierarchy 5′ UTR exon > 5′ UTR intron > 3′ UTR exon > 3′ UTR intron > promoter > mRNA exon > mRNA intron > repeat, and if it did not fall into any of these categories it was classified as intergenic. This was implemented with a custom bash script using awk and the bed-tools complement and intersect commands. Each set of differentially accessible genomic bins was then compared against these annotations using the bedtools intersect command. First, bins were annotated against the mutually exclusive annotations with a requirement that the annotation overlapped at least 51% of the bin (-f 0.51). Any bin not overlapping a 5′ UTR exon or intron, 3′ UTR exon or intron, promoter, mRNA exon, or mRNA intron was then re-overlapped against the original RepeatMasker annotations with a 16% overlap requirement to define the full set of bins overlapping repeat elements. Any repeats overlapping bins with these criteria were annotated with RepeatMasker repeat family annotations when available.
DATA AND SOFTWARE AVAILABILITY
The RNA-seq and ATAC-seq data have been deposited in the Gene Expression Omnibus (GEO) database as GSE126543.
Supplementary Material
KEY RESOURCES TABLE
| REAGENT or RESOURCE | SOURCE | IDENTIFIER |
|---|---|---|
| Antibodies | ||
| AF488-NeuN | Millipore | MAB377X; RRID:AB_2149209 |
| Anti-TDP-43 | Center for Neurodegenerative Disease Research, University of Pennsylvania | 2089 |
| Anti-TDP-43 | Proteintech | 10782–2-AP, RRID:AB_615042 |
| H3K9me3 | Cell Signaling | 13969 |
| Biological Samples | ||
| Autopsy human brain tissue (mid-frontal neocortex) | Center for Neurodegenerative Disease Research, University of Pennsylvania | N/A |
| Chemicals, Peptides, and Recombinant Proteins | ||
| Lamivudine | Sigma-Aldrich | L1295 |
| Critical Commercial Assays | ||
| Ovation RNA-seq System V2 | Nugen | 7102–08 |
| Ovation Rapid DR Multiplex System | Nugen | 0319–32 |
| Nextera DNA Library Preparation Kit | Illumina | FC-121–1030 |
| Nextera Index Kit | Illumina | FC-121–1011 |
| APEX Alexa Fluor 647 Antibody Labeling Kit | ThermoFischer | A10475 |
| Deposited Data | ||
| Raw and analyzed RNA-seq and ATAC-seq datasets | This paper | GSE126543 |
| Experimental Models: Cell Lines | ||
| HeLa | ATCC | ATCC-CCL-2 |
| Oligonucleotides | ||
| L1ORF2 forward primer; TGCGGAGAAATAGGAACACTTTT | Sigma-Genosys | N/A |
| L1ORF2 reverse primer; TGAGGAATCGCCACACTGACT | Sigma-Genosys | N/A |
| SATA forward primer; GGTCAATGGCAGAAAAGGAAAT | Sigma-Genosys | N/A |
| SATA reverse primer; CGCAGTTTGTGGGAATGATTC | Sigma-Genosys | N/A |
| L1ORF2 Taqman probe; VIC-CTGTAAACTAGTTCAACCATT-MGBNFQ | ThermoFisher (Applied Biosystems) | N/A |
| SATA Taqman probe; 6-FAM-TCTTCGTTTCAAAACTAG-MGBNFQ | ThermoFisher (Applied Biosystems) | N/A |
| sgRNA 1 top (targeting TARDBP); CACCGCCCATGGAAAACAACCGAAC | Sigma-Genosys | N/A |
| sgRNA 1 bottom (targeting TARDBP); AAACGTTCGGTTGTTTTCCATGGGC | Sigma-Genosys | N/A |
| sgRNA 2 top (targeting TARDBP); CACCGACATCCGATTTAATAGTGTT | Sigma-Genosys | N/A |
| sgRNA 2 bottom (targeting TARDBP); AAACAACACTATTAAATCGGATGTC | Sigma-Genosys | N/A |
| Recombinant DNA | ||
| pEF06R | Farkash et al., 2006 | Addgene #42940 |
| pSpCas9(BB)-2A-Puro (PX459) V2.0 | Ran et al., 2013 | Addgene #62988 |
| pMSCV-PIG | Mayr and Bartel, 2009 | Addgene #21654 |
| Software and Algorithms | ||
| R Bioconductor | R Core Team, 2015 | http://www.R-project.org/ |
| GraphPad Prism | GraphPad | |
| DESeq2 | Love et al., 2014 | https://github.com/mikelove/DESeq2 |
| rMATS | Shen et al., 2014 | http://rnaseq-mats.sourceforge.net/ |
| PIPECLIP | Chen et al., 2014 | https://github.com/QBRC/PIPE-CLIP |
| STAR | Dobin et al., 2013 | https://github.com/alexdobin/STAR/releases |
| EnrichR | Kuleshov et al., 2016 | http://amp.pharm.mssm.edu/Enrichr/ |
| EdgeR | Robinson et al., 2010 | http://bioconductor.org/packages/release/bioc/html/edgeR.html |
| WGCNA | Langfelder and Horvath, 2008 | https://horvath.genetics.ucla.edu/html/CoexpressionNetwork/Rpackages/WGCNA/ |
Highlights.
Nuclei without nuclear TDP-43 were sorted from post-mortem FTD-ALS human brains
Loss of nuclear TDP-43 was associated with widespread transcriptome changes
Loss of nuclear TDP-43 was linked to chromatin decondensation at LINEs
Loss of nuclear TDP-43 enhanced LINE retrotransposition in vitro
ACKNOWLEDGMENTS
These studies were supported by a grant from the Judith & Jean Pape Adams Charitable Foundation, a Clinical Scientist Development Grant from the Doris Duke Charitable Foundation, and NIH grants (T32 AG000255, R21 NS097749, R01 NS095793, P01 AG017586, and P30 AG010124). We thank Paul Hallberg from the University of Pennsylvania Flow Cytometry Core for technical assistance, and the Center for Neurode-generative Disease at the University of Pennsylvania for their support. We thank Dr. Aivi Nguyen for her assistance with the graphical abstract. We are indebted to the patients, caretakers, families, and physicians, for without their meaningful contributions and dedication to medical research this work would not be possible.
Footnotes
SUPPLEMENTAL INFORMATION
Supplemental Information can be found online at https://doi.org/10.1016/j.celrep.2019.04.003.
DECLARATION OF INTERESTS
E.Y.L. is currently affiliated with ETHOS Health Communications, Yardley, PA, USA. J.R. is currently affiliated with DZNE e.V., Bonn, Germany.
REFERENCES
- Amlie-Wolf A, Ryvkin P, Tong R, Dragomir I, Suh E, Xu Y, Van Deerlin VM, Gregory BD, Kwong LK, Trojanowski JQ, et al. (2015). Transcrip-tomic Changes Due to Cytoplasmic TDP-43 Expression Reveal Dysregulation of Histone Transcripts and Nuclear Chromatin. PLoS ONE 10, e0141836. [DOI] [PMC free article] [PubMed] [Google Scholar]
- Andrews S (2010). FastQC: a quality control tool for high throughput sequence data (Babraham Institute). http://www.bioinformatics.babraham.ac.uk/projects/fastqc.
- Avendaño-Vázquez SE, Dhir A, Bembich S, Buratti E, Proudfoot N, and Baralle FE (2012). Autoregulation of TDP-43 mRNA levels involves interplay between transcription, splicing, and alternative polyA site selection. Genes Dev. 26, 1679–1684. [DOI] [PMC free article] [PubMed] [Google Scholar]
- Ayala YM, De Conti L, Avendaño-Vázquez SE, Dhir A, Romano M, D’Ambrogio A, Tollervey J, Ule J, Baralle M, Buratti E, and Baralle FE (2011). TDP-43 regulates its mRNA levels through a negative feedback loop. EMBO J. 30, 277–288. [DOI] [PMC free article] [PubMed] [Google Scholar]
- Azevedo FA, Carvalho LR, Grinberg LT, Farfel JM, Ferretti RE, Leite RE, Jacob Filho W, Lent R, and Herculano-Houzel S (2009). Equal numbers of neuronal and nonneuronal cells make the human brain an isomet-rically scaled-up primate brain. J. Comp. Neurol 513, 532–541. [DOI] [PubMed] [Google Scholar]
- Baillie JK, Barnett MW, Upton KR, Gerhardt DJ, Richmond TA, De Sapio F, Brennan PM, Rizzu P, Smith S, Fell M, et al. (2011). Somatic retrotransposition alters the genetic landscape of the human brain. Nature 479, 534–537. [DOI] [PMC free article] [PubMed] [Google Scholar]
- Beck CR, Collier P, Macfarlane C, Malig M, Kidd JM, Eichler EE, Badge RM, and Moran JV (2010). LINE-1 retrotransposition activity in human genomes. Cell 141, 1159–1170. [DOI] [PMC free article] [PubMed] [Google Scholar]
- Bernard A, Lubbers LS, Tanis KQ, Luo R, Podtelezhnikov AA, Finney EM, McWhorter MM, Serikawa K, Lemon T, Morgan R, et al. (2012). Transcriptional architecture of the primate neocortex. Neuron 73, 1083–1099. [DOI] [PMC free article] [PubMed] [Google Scholar]
- Bolger AM, Lohse M, and Usadel B (2014). Trimmomatic: a flexible trimmer for Illumina sequence data. Bioinformatics 30, 2114–2120. [DOI] [PMC free article] [PubMed] [Google Scholar]
- Bowen LN, Tyagi R, Li W, Alfahad T, Smith B, Wright M, Singer EJ, and Nath A (2016). HIV-associated motor neuron disease: HERV-K activation and response to antiretroviral therapy. Neurology 87, 1756–1762. [DOI] [PMC free article] [PubMed] [Google Scholar]
- Buenrostro JD, Giresi PG, Zaba LC, Chang HY, and Greenleaf WJ (2013). Transposition of native chromatin for fast and sensitive epigenomic profiling of open chromatin, DNA-binding proteins and nucleosome position. Nat. Methods 10, 1213–1218. [DOI] [PMC free article] [PubMed] [Google Scholar]
- Bundo M, Toyoshima M, Okada Y, Akamatsu W, Ueda J, Nemoto-Miyauchi T, Sunaga F, Toritsuka M, Ikawa D, Kakita A, et al. (2014). Increased l1 retrotransposition in the neuronal genome in schizophrenia. Neuron 81, 306–313. [DOI] [PubMed] [Google Scholar]
- Chen B, Yun J, Kim MS, Mendell JT, and Xie Y (2014). PIPE-CLIP: a comprehensive online tool for CLIP-seq data analysis. Genome Biol. 15, R18. [DOI] [PMC free article] [PubMed] [Google Scholar]
- Cooper-Knock J, Kirby J, Ferraiuolo L, Heath PR, Rattray M, and Shaw PJ (2012). Gene expression profiling in human neurodegenerative disease. Nat. Rev. Neurol 8, 518–530. [DOI] [PubMed] [Google Scholar]
- Coufal NG, Garcia-Perez JL, Peng GE, Yeo GW, Mu Y, Lovci MT, Morell M, O’Shea KS, Moran JV, and Gage FH (2009). L1 retrotranspo-sition in human neural progenitor cells. Nature 460, 1127–1131. [DOI] [PMC free article] [PubMed] [Google Scholar]
- Coufal NG, Garcia-Perez JL, Peng GE, Marchetto MC, Muotri AR, Mu Y, Carson CT, Macia A, Moran JV, and Gage FH (2011). Ataxia telangiectasia mutated (ATM) modulates long interspersed element-1 (L1) retrotransposition in human neural stem cells. Proc. Natl. Acad. Sci. USA 108, 20382–20387. [DOI] [PMC free article] [PubMed] [Google Scholar]
- Dai L, Huang Q, and Boeke JD (2011). Effect of reverse transcriptase inhibitors on LINE-1 and Ty1 reverse transcriptase activities and on LINE-1 retrotransposition. BMC Biochem. 12, 18. [DOI] [PMC free article] [PubMed] [Google Scholar]
- Darmanis S, Sloan SA, Zhang Y, Enge M, Caneda C, Shuer LM, Hay-den Gephart MG, Barres BA, and Quake SR (2015). A survey of human brain transcriptome diversity at the single cell level. Proc. Natl. Acad. Sci. USA 112, 7285–7290. [DOI] [PMC free article] [PubMed] [Google Scholar]
- De Cecco M, Ito T, Petrashen AP, Elias AE, Skvir NJ, Criscione SW, Caligiana A, Brocculi G, Adney EM, Boeke JD, et al. (2019). L1 drives IFN in senescent cells and promotes age-associated inflammation. Nature 566, 73–78. [DOI] [PMC free article] [PubMed] [Google Scholar]
- Dobin A, Davis CA, Schlesinger F, Drenkow J, Zaleski C, Jha S, Batut P, Chaisson M, and Gingeras TR (2013). STAR: ultrafast universal RNA-seq aligner. Bioinformatics 29, 15–21. [DOI] [PMC free article] [PubMed] [Google Scholar]
- Erwin JA, Marchetto MC, and Gage FH (2014). Mobile DNA elements in the generation of diversity and complexity in the brain. Nat. Rev. Neurosci 15, 497–506. [DOI] [PMC free article] [PubMed] [Google Scholar]
- Erwin JA, Paquola AC, Singer T, Gallina I, Novotny M, Quayle C, Bed-rosian TA, Alves FI, Butcher CR, Herdy JR, et al. (2016). L1-associated genomic regions are deleted in somatic cells of the healthy human brain. Nat. Neurosci 19, 1583–1591. [DOI] [PMC free article] [PubMed] [Google Scholar]
- Evrony GD, Cai X, Lee E, Hills LB, Elhosary PC, Lehmann HS, Parker JJ, Atabay KD, Gilmore EC, Poduri A, et al. (2012). Single-neuron sequencing analysis of L1 retrotransposition and somatic mutation in the human brain. Cell 151, 483–496. [DOI] [PMC free article] [PubMed] [Google Scholar]
- Evrony GD, Lee E, Mehta BK, Benjamini Y, Johnson RM, Cai X, Yang L, Haseley P, Lehmann HS, Park PJ, and Walsh CA (2015). Cell lineage analysis in human brain using endogenous retroelements. Neuron 85, 49–59. [DOI] [PMC free article] [PubMed] [Google Scholar]
- Evrony GD, Lee E, Park PJ, and Walsh CA (2016). Resolving rates of mutation in the brain using single-neuron genomics. eLife 5, e12966. [DOI] [PMC free article] [PubMed] [Google Scholar]
- Farkash EA, Kao GD, Horman SR, and Prak ET (2006). Gamma radiation increases endonuclease-dependent L1 retrotransposition in a cultured cell assay. Nucleic Acids Res. 34, 1196–1204. [DOI] [PMC free article] [PubMed] [Google Scholar]
- Faulkner GJ, and Garcia-Perez JL (2017). L1 Mosaicism in Mammals: Extent, Effects, and Evolution. Trends Genet. 33, 802–816. [DOI] [PubMed] [Google Scholar]
- Freibaum BD, Lu Y, Lopez-Gonzalez R, Kim NC, Almeida S, Lee KH, Badders N, Valentine M, Miller BL, Wong PC, et al. (2015). GGGGCC repeat expansion in C9orf72 compromises nucleocytoplasmic transport. Nature 525, 129–133. [DOI] [PMC free article] [PubMed] [Google Scholar]
- Frost B, Hemberg M, Lewis J, and Feany MB (2014). Tau promotes neu-rodegeneration through global chromatin relaxation. Nat. Neurosci 17, 357–366. [DOI] [PMC free article] [PubMed] [Google Scholar]
- Gonatas NK, Stieber A, Mourelatos Z, Chen Y, Gonatas JO, Appel SH, Hays AP, Hickey WF, and Hauw JJ (1992). Fragmentation of the Golgi apparatus of motor neurons in amyotrophic lateral sclerosis. Am. J. Pathol 140, 731–737. [PMC free article] [PubMed] [Google Scholar]
- Goodier JL (2016). Restricting retrotransposons: a review. Mob. DNA 7, 16. [DOI] [PMC free article] [PubMed] [Google Scholar]
- Gulick RM, Mellors JW, Havlir D, Eron JJ, Gonzalez C, McMahon D,Richman DD, Valentine FT, Jonas L, Meibohm A, et al. (1997). Treatment with indinavir, zidovudine, and lamivudine in adults with human immunodefi-ciency virus infection and prior antiretroviral therapy. N. Engl. J. Med 337, 734–739. [DOI] [PubMed] [Google Scholar]
- Guo C, Jeong HH, Hsieh YC, Klein HU, Bennett DA, De Jager PL, Liu Z, and Shulman JM (2018). Tau Activates Transposable Elements in Alzheimer’s Disease. Cell Rep. 23, 2874–2880. [DOI] [PMC free article] [PubMed] [Google Scholar]
- Harrow J, Frankish A, Gonzalez JM, Tapanari E, Diekhans M, Kokocin-ski F, Aken BL, Barrell D, Zadissa A, Searle S, et al. (2012). GENCODE: the reference human genome annotation for The ENCODE Project. Genome Res. 22, 1760–1774. [DOI] [PMC free article] [PubMed] [Google Scholar]
- Hawrylycz MJ, Lein ES, Guillozet-Bongaarts AL, Shen EH, Ng L, Miller JA, van de Lagemaat LN, Smith KA, Ebbert A, Riley ZL, et al. (2012). An anatomically comprehensive atlas of the adult human brain tran-scriptome. Nature 489, 391–399. [DOI] [PMC free article] [PubMed] [Google Scholar]
- Huang C, Tong J, Bi F, Zhou H, and Xia XG (2012). Mutant TDP-43 in motor neurons promotes the onset and progression of ALS in rats. J. Clin. Invest 122, 107–118. [DOI] [PMC free article] [PubMed] [Google Scholar]
- Igaz LM, Kwong LK, Lee EB, Chen-Plotkin A, Swanson E, Unger T, Malunda J, Xu Y, Winton MJ, Trojanowski JQ, and Lee VM (2011). Dysregulation of the ALS-associated gene TDP-43 leads to neuronal death and degeneration in mice. J. Clin. Invest 121, 726–738. [DOI] [PMC free article] [PubMed] [Google Scholar]
- Jovicičić A, Mertens J, Boeynaems S, Bogaert E, Chai N, Yamada SB, Paul JW 3rd, Sun S, Herdy JR, Bieri G, et al. (2015). Modifiers of C9orf72 dipeptide repeat toxicity connect nucleocytoplasmic transport defects to FTD/ALS. Nat. Neurosci 18, 1226–1229. [DOI] [PMC free article] [PubMed] [Google Scholar]
- Kirkwood TB (2005). Understanding the odd science of aging. Cell 120, 437–447. [DOI] [PubMed] [Google Scholar]
- Kopera HC, Larson PA, Moldovan JB, Richardson SR, Liu Y, and Moran JV (2016). LINE-1 Cultured Cell Retrotransposition Assay. Methods Mol. Biol 1400, 139–156. [DOI] [PMC free article] [PubMed] [Google Scholar]
- Krach F, Batra R, Wheeler EC, Vu AQ, Wang R, Hutt K, Rabin SJ, Baughn MW, Libby RT, Diaz-Garcia S, et al. (2018). Transcriptome-pathology correlation identifies interplay between TDP-43 and the expression of its kinase CK1E in sporadic ALS. Acta. Neuropathologica 136, 405–423. [DOI] [PMC free article] [PubMed] [Google Scholar]
- Krug L, Chatterjee N, Borges-Monroy R, Hearn S, Liao WW, Morrill K, Prazak L, Rozhkov N, Theodorou D, Hammell M, and Dubnau J (2017). Retrotransposon activation contributes to neurodegeneration in a Drosophila TDP-43 model of ALS. PLoS Genet. 13, e1006635. [DOI] [PMC free article] [PubMed] [Google Scholar]
- Kuleshov MV, Jones MR, Rouillard AD, Fernandez NF, Duan Q, Wang Z, Koplev S, Jenkins SL, Jagodnik KM, Lachmann A, et al. (2016). Enrichr: a comprehensive gene set enrichment analysis web server 2016 update. Nucleic Acids Res. 44 (W1), W90–W97. [DOI] [PMC free article] [PubMed] [Google Scholar]
- Lagier-Tourenne C, Polymenidou M, Hutt KR, Vu AQ, Baughn M, Huelga SC, Clutario KM, Ling SC, Liang TY, Mazur C, et al. (2012). Divergent roles of ALS-linked proteins FUS/TLS and TDP-43 intersect in processing long pre-mRNAs. Nat. Neurosci 15, 1488–1497. [DOI] [PMC free article] [PubMed] [Google Scholar]
- Langfelder P, and Horvath S (2008). WGCNA: an R package for weighted correlation network analysis. BMC Bioinformatics 9, 559. [DOI] [PMC free article] [PubMed] [Google Scholar]
- Lawrence M, Huber W, Pagès H, Aboyoun P, Carlson M, Gentleman R, Morgan MT, and Carey VJ (2013). Software for computing and annotating genomic ranges. PLoS Comput. Biol 9, e1003118. [DOI] [PMC free article] [PubMed] [Google Scholar]
- Lee EB, Lee VM, and Trojanowski JQ (2011). Gains or losses: molecular mechanisms of TDP43-mediated neurodegeneration. Nat. Rev. Neurosci 13, 38–50. [DOI] [PMC free article] [PubMed] [Google Scholar]
- Lee EB, Porta S, Michael Baer G, Xu Y, Suh E, Kwong LK, Elman L, Grossman M, Lee VM, Irwin DJ, et al. (2017). Expansion of the classification of FTLD-TDP: distinct pathology associated with rapidly progressive frontotemporal degeneration. Acta Neuropathol. 134, 65–78. [DOI] [PMC free article] [PubMed] [Google Scholar]
- Li W, Jin Y, Prazak L, Hammell M, and Dubnau J (2012). Transposable elements in TDP-43-mediated neurodegenerative disorders. PLoS ONE 7, e44099. [DOI] [PMC free article] [PubMed] [Google Scholar]
- Li W, Prazak L, Chatterjee N, Grüninger S, Krug L, Theodorou D, and Dubnau J (2013). Activation of transposable elements during aging and neuronal decline in Drosophila. Nat. Neurosci 16, 529–531. [DOI] [PMC free article] [PubMed] [Google Scholar]
- Li W, Lee MH, Henderson L, Tyagi R, Bachani M, Steiner J, Campa-nac E, Hoffman DA, von Geldern G, Johnson K, et al. (2015). Human endogenous retrovirus-K contributes to motor neuron disease. Sci. Transl. Med 7, 307ra153. [DOI] [PMC free article] [PubMed] [Google Scholar]
- Lin C, Yang L, Tanasa B, Hutt K, Ju BG, Ohgi K, Zhang J, Rose DW, Fu XD, Glass CK, and Rosenfeld MG (2009). Nuclear receptor-induced chromosomal proximity and DNA breaks underlie specific translocations in cancer. Cell 139, 1069–1083. [DOI] [PMC free article] [PubMed] [Google Scholar]
- Ling SC, Polymenidou M, and Cleveland DW (2013). Converging mecha-nisms in ALS and FTD: disrupted RNA and protein homeostasis. Neuron 79, 416–438. [DOI] [PMC free article] [PubMed] [Google Scholar]
- Love MI, Huber W, and Anders S (2014). Moderated estimation of fold change and dispersion for RNA-seq data with DESeq2. Genome Biol. 15, 550. [DOI] [PMC free article] [PubMed] [Google Scholar]
- Macia A, Widmann TJ, Heras SR, Ayllon V, Sanchez L, Benkaddour-Boumzaouad M, Muñoz-Lopez M, Rubio A, Amador-Cubero S, Blanco-Jimenez E, et al. (2017). Engineered LINE-1 retrotransposition in nondividing human neurons. Genome Res. 27, 335–348. [DOI] [PMC free article] [PubMed] [Google Scholar]
- Mansuroglu Z, Benhelli-Mokrani H, Marcato V, Sultan A, Violet M, Chauderlier A, Delattre L, Loyens A, Talahari S, Bégard S, et al. (2016). Loss of Tau protein affects the structure, transcription and repair of neuronal pericentromeric heterochromatin. Sci. Rep 6, 33047. [DOI] [PMC free article] [PubMed] [Google Scholar]
- Mayr C, and Bartel DP (2009). Widespread shortening of 3’UTRs by alternative cleavage and polyadenylation activates oncogenes in cancer cells. Cell 138, 673–684. [DOI] [PMC free article] [PubMed] [Google Scholar]
- McCormick AL, Brown RH Jr., Cudkowicz ME, Al-Chalabi A, and Garson JA (2008). Quantification of reverse transcriptase in ALS and elimination of a novel retroviral candidate. Neurology 70, 278–283. [DOI] [PubMed] [Google Scholar]
- Molyneaux BJ, Arlotta P, Menezes JR, and Macklis JD (2007). Neuronal subtype specification in the cerebral cortex. Nat. Rev. Neurosci 8, 427–437. [DOI] [PubMed] [Google Scholar]
- Muotri AR, Chu VT, Marchetto MC, Deng W, Moran JV, and Gage FH (2005). Somatic mosaicism in neuronal precursor cells mediated by L1 retrotransposition. Nature 435, 903–910. [DOI] [PubMed] [Google Scholar]
- Muotri AR, Marchetto MC, Coufal NG, Oefner R, Yeo G, Nakashima K, and Gage FH (2010). L1 retrotransposition in neurons is modulated by MeCP2. Nature 468, 443–446. [DOI] [PMC free article] [PubMed] [Google Scholar]
- Neumann M, Sampathu DM, Kwong LK, Truax AC, Micsenyi MC, Chou TT, Bruce J, Schuck T, Grossman M, Clark CM, et al. (2006). Ubiquitinated TDP-43 in frontotemporal lobar degeneration and amyotrophic lateral sclerosis. Science 314, 130–133. [DOI] [PubMed] [Google Scholar]
- Polymenidou M, Lagier-Tourenne C, Hutt KR, Huelga SC, Moran J, Liang TY, Ling SC, Sun E, Wancewicz E, Mazur C, et al. (2011). Long pre-mRNA depletion and RNA missplicing contribute to neuronal vulnerability from loss of TDP-43. Nat. Neurosci 14, 459–468. [DOI] [PMC free article] [PubMed] [Google Scholar]
- Prudencio M, Belzil VV, Batra R, Ross CA, Gendron TF, Pregent LJ, Murray ME, Overstreet KK, Piazza-Johnston AE, Desaro P, et al. (2015). Distinct brain transcriptome profiles in C9orf72-associated and sporadic ALS. Nat. Neurosci 18, 1175–1182. [DOI] [PMC free article] [PubMed] [Google Scholar]
- Prudencio M, Gonzales PK, Cook CN, Gendron TF, Daughrity LM, Song Y, Ebbert MTW, van Blitterswijk M, Zhang YJ, Jansen-West K, et al. (2017). Repetitive element transcripts are elevated in the brain of C9orf72 ALS/FTLD patients. Hum. Mol. Genet 26, 3421–3431. [DOI] [PMC free article] [PubMed] [Google Scholar]
- R Core Team (2015). R: A Language and Environment for Statistical Computing (The R Foundation). https://www.r-project.org/foundation/.
- Ran FA, Hsu PD, Wright J, Agarwala V, Scott DA, and Zhang F (2013). Genome engineering using the CRISPR-Cas9 system. Nat. Protoc 8, 2281– 2308. [DOI] [PMC free article] [PubMed] [Google Scholar]
- Robinson MD, McCarthy DJ, and Smyth GK (2010). edgeR: a Bioconductor package for differential expression analysis of digital gene expression data. Bioinformatics 26, 139–140. [DOI] [PMC free article] [PubMed] [Google Scholar]
- Saldi TK, Ash PE, Wilson G, Gonzales P, Garrido-Lecca A, Roberts CM, Dostal V, Gendron TF, Stein LD, Blumenthal T, et al. (2014). TDP-1, the Caenorhabditis elegans ortholog of TDP-43, limits the accumulation of double-stranded RNA. EMBO J. 33, 2947–2966. [DOI] [PMC free article] [PubMed] [Google Scholar]
- Scekic-Zahirovic J, Sendscheid O, El Oussini H, Jambeau M, Sun Y, Mersmann S, Wagner M, Dieterlé S, Sinniger J, Dirrig-Grosch S, et al. (2016). Toxic gain of function from mutant FUS protein is crucial to trigger cell autonomous motor neuron loss. EMBO J. 35, 1077–1097. [DOI] [PMC free article] [PubMed] [Google Scholar]
- Sciamanna I, Gualtieri A, Cossetti C, Osimo EF, Ferracin M, Macchia G, Aricò E, Prosseda G, Vitullo P, Misteli T, and Spadafora C (2013). A tumor-promoting mechanism mediated by retrotransposon-encoded reverse transcriptase is active in human transformed cell lines. Oncotarget 4, 2271–2287. [DOI] [PMC free article] [PubMed] [Google Scholar]
- Sharma A, Lyashchenko AK, Lu L, Nasrabady SE, Elmaleh M, Mendel-sohn M, Nemes A, Tapia JC, Mentis GZ, and Shneider NA (2016). ALS-associated mutant FUS induces selective motor neuron degeneration through toxic gain of function. Nat. Commun 7, 10465. [DOI] [PMC free article] [PubMed] [Google Scholar]
- Shen S, Park JW, Lu ZX, Lin L, Henry MD, Wu YN, Zhou Q, and Xing Y (2014). rMATS: robust and flexible detection of differential alternative splicing from replicate RNA-Seq data. Proc. Natl. Acad. Sci. USA 111, E5593– E5601. [DOI] [PMC free article] [PubMed] [Google Scholar]
- Srinivasan K, Friedman BA, Larson JL, Lauffer BE, Goldstein LD, Appling LL, Borneo J, Poon C, Ho T, Cai F, et al. (2016). Untangling the brain’s neuroinflammatory and neurodegenerative transcriptional responses. Nat. Commun 7, 11295. [DOI] [PMC free article] [PubMed] [Google Scholar]
- Steele AJ, Al-Chalabi A, Ferrante K, Cudkowicz ME, Brown RH Jr., and Garson JA (2005). Detection of serum reverse transcriptase activity in patients with ALS and unaffected blood relatives. Neurology 64, 454–458. [DOI] [PubMed] [Google Scholar]
- Strong MJ, Abrahams S, Goldstein LH, Woolley S, Mclaughlin P, Snowden J, Mioshi E, Roberts-South A, Benatar M, HortobáGyi T, et al. (2017). Amyotrophic lateral sclerosis - frontotemporal spectrum disorder (ALS-FTSD): Revised diagnostic criteria. Amyotroph. Lateral Scler. Frontotem-poral Degener 18, 153–174. [DOI] [PMC free article] [PubMed] [Google Scholar]
- Sun W, Samimi H, Gamez M, Zare H, and Frost B (2018). Pathogenic tau-induced piRNA depletion promotes neuronal death through transposable element dysregulation in neurodegenerative tauopathies. Nat. Neurosci 21, 1038–1048. [DOI] [PMC free article] [PubMed] [Google Scholar]
- Thomas CA, Tejwani L, Trujillo CA, Negraes PD, Herai RH, Mesci P, Macia A, Crow YJ, and Muotri AR (2017). Modeling of TREX1-dependent autoimmune disease using human stem cells highlights L1 accumulation as a source of neuroinflammation. Cell Stem Cell 21, 319–331.e318. [DOI] [PMC free article] [PubMed] [Google Scholar]
- Toledo JB, Van Deerlin VM, Lee EB, Suh E, Baek Y, Robinson JL, Xie SX, McBride J, Wood EM, Schuck T, et al. (2014). A platform for discovery: The University of Pennsylvania Integrated Neurodegenerative Disease Biobank. Alzheimers Dement 10, 477–484.e471. [DOI] [PMC free article] [PubMed] [Google Scholar]
- Tollervey JR, Curk T, Rogelj B, Briese M, Cereda M, Kayikci M, König J, Hortobágyi T, Nishimura AL, Zupunski V, et al. (2011). Characterizing the RNA targets and position-dependent splicing regulation by TDP-43. Nat. Neurosci 14, 452–458. [DOI] [PMC free article] [PubMed] [Google Scholar]
- Tsai KJ, Yang CH, Fang YH, Cho KH, Chien WL, Wang WT, Wu TW, Lin CP, Fu WM, and Shen CK (2010). Elevated expression of TDP-43 in the forebrain of mice is sufficient to cause neurological and patho-logical phenotypes mimicking FTLD-U. J. Exp. Med 207, 1661–1673. [DOI] [PMC free article] [PubMed] [Google Scholar]
- Upton KR, Gerhardt DJ, Jesuadian JS, Richardson SR, Sánchez-Luque FJ, Bodea GO, Ewing AD, Salvador-Palomeque C, van der Knaap MS, Brennan PM, et al. (2015). Ubiquitous L1 mosaicism in hippocampal neurons. Cell 161, 228–239. [DOI] [PMC free article] [PubMed] [Google Scholar]
- Wils H, Kleinberger G, Janssens J, Pereson S, Joris G, Cuijt I, Smits V, Ceuterick-de Groote C, Van Broeckhoven C, and Kumar-Singh S (2010). TDP-43 transgenic mice develop spastic paralysis and neuronal inclusions characteristic of ALS and frontotemporal lobar degeneration. Proc. Natl. Acad. Sci. USA 107, 3858–3863. [DOI] [PMC free article] [PubMed] [Google Scholar]
- Xu YF, Gendron TF, Zhang YJ, Lin WL, D’Alton S, Sheng H, Casey MC, Tong J, Knight J, Yu X, et al. (2010). Wild-type human TDP-43 expression causes TDP-43 phosphorylation, mitochondrial aggregation, motor deficits, and early mortality in transgenic mice. J. Neurosci 30, 10851–10859. [DOI] [PMC free article] [PubMed] [Google Scholar]
- Zeisel A, Muñoz-Manchado AB, Codeluppi S, Lönnerberg P, La Manno G, Juréus A, Marques S, Munguba H, He L, Betsholtz C, et al. (2015). Brain structure. Cell types in the mouse cortex and hippocampus revealed by single-cell RNA-seq. Science 347, 1138–1142. [DOI] [PubMed] [Google Scholar]
- Zhang Y, Chen K, Sloan SA, Bennett ML, Scholze AR, O’Keeffe S, Phatnani HP, Guarnieri P, Caneda C, Ruderisch N, et al. (2014). An RNA-sequencing transcriptome and splicing database of glia, neurons, and vascular cells of the cerebral cortex. J. Neurosci 34, 11929–11947. [DOI] [PMC free article] [PubMed] [Google Scholar]
- Zhang K, Donnelly CJ, Haeusler AR, Grima JC, Machamer JB, Steinwald P, Daley EL, Miller SJ, Cunningham KM, Vidensky S, et al. (2015). The C9orf72 repeat expansion disrupts nucleocytoplasmic transport. Nature 525, 56–61. [DOI] [PMC free article] [PubMed] [Google Scholar]
Associated Data
This section collects any data citations, data availability statements, or supplementary materials included in this article.
Supplementary Materials
Data Availability Statement
The RNA-seq and ATAC-seq data have been deposited in the Gene Expression Omnibus (GEO) database as GSE126543.