Abstract
The ability to calculate rigid-body transformations between arbitrary coordinate systems (i.e., registration) is an invaluable tool in robotics. This effort builds upon previous work by investigating strategies for improving the registration accuracy between a robotic arm and an extrinsic coordinate system with relatively inexpensive parts and minimal labor. The framework previously presented is expanded with a new test methodology to characterize the effects of strategies that improve registration performance. In addition, statistical analyses of physical trials reveal that leveraging more data and applying machine learning are two major components for significantly reducing registration error. One-shot peg-in-hole tests are conducted to show the application-level performance gains obtained by improving registration accuracy. Trends suggest that the maximum translation positioning error (postregistration) is a good, albeit not perfect, indicator for peg insertion performance.
Note to Practitioners
In a dynamic robotic workcell environment where robots may be frequently relocated or may need to collaborate with other robots, it is simpler and more robust to program robots in an external or unifying reference frame. The process of robot registration involves finding the location of a robot with respect to another reference frame. For instance, if parts are in known locations on a table and a robot can locate itself with respect to the table (an external reference frame), then the robot will also know the location of the parts. Furthermore, if two or more robots can locate themselves with respect to the table, then each robot will not only know the location of the parts, but also the location of every other robot. This knowledge facilitates the coordination of robot motions and robot collaboration and eases the integration of additional robots into the workcell. Since robot registration is critically necessary and occurs frequently, its process needs to be inexpensive, fast, and accurate. This paper details the requirements for a relatively inexpensive and fast robot registration experience, along with detailing strategies that incur significant improvements to registered robot positioning accuracy with minimal overhead. A quantitative verification process is presented to evaluate the performance impacts of these strategies. Peg-in-hole experiments are conducted to validate the notion that more accurate robot registration translates to more reliable task-level performance.
Index Terms: Multirobot coordination, robot performance, robot registration
I. Introduction
In [1], a framework was presented for performing, verifying, and validating the robot coordinate frame registration in manufacturing applications. Targeting multirobot configurations in flexible factory environments, this framework provided mechanisms for 1) capturing coordinate registration data used in a basic 3-point registration; 2) evaluating and reporting the registration error; and 3) validating the performance assessment metrology. Characterizing registration error provides end users with a powerful tool with which they can quickly assess the expected performance of a given robot configuration. However, the framework provided no mechanisms or guidance by which the performance might be improved. Moreover, the 3-point registration process, while simple and effective, yielded relatively large registration errors that also scaled across the workspace.
Many commercial industrial robots include a 3–5 orthogonal point registration process (see [2] and [3]) that is used to explicitly define the positive x-, y-, and z-axes of world, tool, or “work” frames. Such accommodations are both simple and effective for single-application robot workcells and are best targeted for gross registrations of marginally dynamic configurations. However, they offer limited support for multiple reference frames and do not provide convenient metrics by which their registration uncertainties may be reported. The processes of verification and validation thus become ex post facto in situ performance evaluations followed by iterative reregistration.
Robotic applications that need highly precise and accurate placement of tools (e.g., robot surgery) rely on two principal approaches [4]: 1) leveraging fixtures to rigidly immobilize and fix objects relative to the robot’s coordinate system and 2) affixing fiducials to an object, which are then manually probed for explicit coordinate mapping. The fiducial-based approach is believed to be the more accurate of the two [5], [6].
Other approaches use robot feedback at predetermined calibration poses to automatically register the robot to a sensor’s coordinate system. For example, in [7], a robot is used to calibrate and evaluate a mixed reality headset. The robot is registered to a motion capture system using a constrained bundle adjustment method [8] to correct for marker location uncertainty and map directly to known robot poses. Similarly, in [9], pose feedback from a multirobot system touching optical fiducials is used to generate an interpolated pseudo three-dimensional (3-D) mapping from image space coordinates to robot base frame coordinates for the acquisition and assembly of cell phone case components.
Many contemporary approaches derive from the classical hand-eye (AX = XB) calibration problem first solved in [10] and [11]. In these problems, A and B are the homogeneous transformation matrices of the end-of-arm tooling and the sensor relating two separate robot motions and X is the unknown relationship between the robot’s tool flange and the sensor. Extensions of the hand-eye calibration problem approach the multisystem problem in which an unknown transformation from the robot’s base to the world (or another robot) Y. Approaches to addressing the hand-eye, robot-world (AX = YB) calibration problem range from closed-form approaches (see [12]) to probabilistic approximations [13] of the unknowns X and Y. Extending the problem even further, some researchers are working to provide solutions to the issues that arise when there is uncertainty in the mounting of tools [denoted by the measurable relative motion transformations from the robot’s base frame to its tool flange C and the unknown transformation from the tool flange to the tool center point (TCP) Z]. Current approaches to the handeye, robot-world, and tool-flange (AXB = YCZ) calibration problem include both multistep and simultaneous closed-form approaches using robot-mounted sensors [14], [15]. Many solutions to the AX = YB and AXB = YCZ calibration problems may be used to provide registrations of excellent quality for flexible manufacturing environments at the cost of computational complexity and extensive sampling with expensive sensors. The goal, and ultimate contribution of this effort, is to provide algorithmic tools with which multiple robots may be registered together quickly, cheaply, and with sufficient accuracy for the manufacturing application.
In this paper, the registration framework presented in [1] is expanded by presenting a test methodology for the statistical evaluation of efforts to improve registration performance. In addition, a number of strategies and tools are presented to reduce registration error without dramatically increasing computational effort, design complexity, or manual labor. To instill the utmost clarity, this paper is systematically organized as follows. Section II discusses the experimental setup for measuring registration performance and statistical tests for data analysis. Section III details various strategies for performing and improving robot registration. Section IV verifies the test methodology and discusses the statistical comparisons of registration performance data. Section V provides a validation step that analyzes functional level impact of registration performance using one-shot peg-in-insertions. This paper concludes with a discussion on the expected performance gains by employing different registration strategies.
II. Registration Test Method and Performance Analysis
In line with the established registration framework, a metrology basis for evaluating the performance gains is presented. This section describes the test configuration and methodology, performance measures, and statistical assessments that constitute the verification and validation of the methodology.
A. Experimental Setup
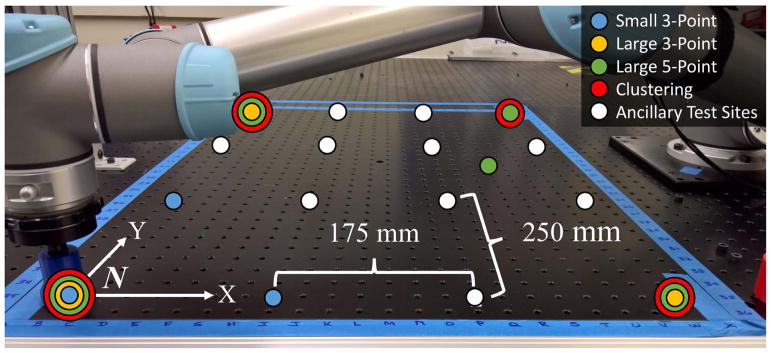
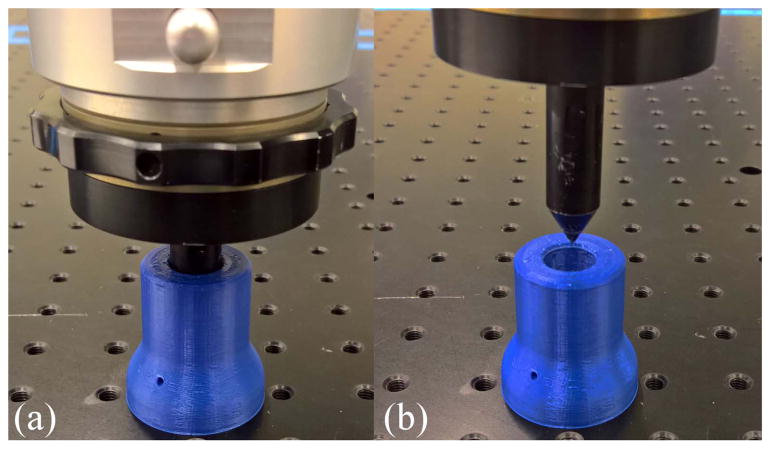
The experimental setup includes a robot, an optical bread-board (Fig. 1), an end-effector “stylus” tool, and a 3-D printed “collimator” (Fig. 2). The robot has six degrees of freedom with a nominal reach of 850 mm. The aluminum, conical end-effector stylus tool serves to facilitate both robot registration and the performance measurement thereof. The modular test bed consists of an optical breadboard mounted to a rigid aluminum frame that supports both the test configuration and the robot. The optical breadboard surface is composed of six 600 mm × 900 mm plates, each with flatness ratings of ±0.15 mm over 0.09 m2 and M6 threaded holes spaced 25 mm apart. The breadboard serves to accurately place the collimator over the area of the plate. In this paper, all tests were conducted on a single plate to eliminate uncertainty associated with possible misalignment with adjacent plates.
Fig. 1.
Location of 16 sites in the metrology test bed. Colored dots indicate the input points for the respective registration methods, with concentric circles indicating shared training points. White dots indicate ancillary site locations for measuring registration performance. N is the target coordinate system.
Fig. 2.
Stylus end-effector (a) inside and (b) outside of aligning collimator.
The collimator (Fig. 2) was built using an extruded polymer (acrylonitrile butadiene styrene) 3-D printer, and is used in conjunction with the stylus-tooled end-effector to force the robot (under gravity compensation) to place its TCP in a location that is known in both a coordinate system fixed to the optical breadboard, and the base of the robot. This information constitutes the basis for robot registration (Section III). Overall, the registration construction is relatively inexpensive since the collimator is 3-D printed, the stylus is off-the-shelf tight-tolerance metal rod, and accurate reference positioning was obtained via an optical breadboard.
B. Performance Measures
The systemic metric selected for quantifying postregistration robot positioning performance is the Euclidean distance from the robot’s TCP translational position in ℝ3 expressed in the extrinsic coordinate system N to the ground truth position as measured by the optical breadboard expressed in N (see Fig. 1 for coordinate system placement). This distance is called translation error e.
C. Comparative Statistics
To rigorously characterize the performance of various registration strategies, four statistical tests were chosen. The first test quantifies the spatial correlation between the translation error and the distance from the extrinsic coordinate system’s origin. The significance of this test is twofold. First, correlated data violate an underlying assumption of statistical tests, namely, the independence of sampled data (randomness). Testing on correlated data has been shown to deviate the hypothetical error rates (false positives or false negatives) [16]. Furthermore, attenuating the dependence of translation error on the robot’s current configuration in space is preferential. The second test involves the Kolmogorov–Smirnov (KS) test to determine if there exists a statistically significant difference in the distribution of translation error between any two registration methods. Third, the Levene test with the Brown–Forsythe statistic is used to conduct an analysis of sample variance (ANOVA). Depending on the outcome of the Levene test, a fourth test, an appropriate Student’s T-test, is applied to determine if there is a detectable difference in the means of translation error between samples of any two registration methods. All statistical tests1 were conducted at a 95% confidence level (CL). Statistical tests can also be conducted from a number of available packages including R and MATLAB.
III. Registration Strategies
In this section, benchmarks and strategies for the robot registration process are described. The 3-point registration method (Section III-A) is used as a baseline performance indicator. Improvement strategies include: 1) increasing the area over which registration measurements are taken; 2) taking redundant measurements over a defined area (Section III-B); 3) applying optimization to the registration (Section III-C); and 4) utilizing multiple registration kernels to optimize localized performance (Section III-D). Regardless of the approach, data collection for registration was obtained within 1 min, while registration algorithms completed within a few seconds (variable with implementation, settings, and amount of data).
A. Minimum 3-Point
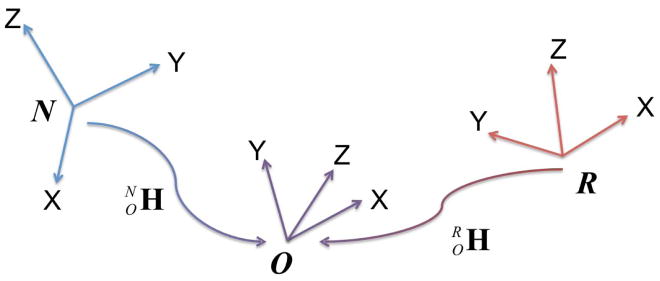
Described in detail in [1], the 3-point registration process uses two colocated sets of three points measured in ℝ3: one set of points in the robot’s base coordinate frame R, and one set of points measured in the target coordinate system N. Specifically, for each point pi = [pi,x, pi,y, pi,z]T, Rpi in the R coordinate space corresponds with N pi in the N coordinate space. These points are used to generate a third coordinate system O that provides a common reference to which the robot and the target coordinate system can be transformed (Fig. 3). The 4 × 4 homogeneous transformation matrix from R to is generated by the H(·) operator as
Fig. 3.
Transformation from one arbitrary coordinate system, R, to another, N, relies on defining an intermediate coordinate system, O, with a known transformation to and from R and N.
| (1) |
The value of is defined as
| (2) |
where N x̂, N ŷ, and N ẑ ∈ ℝ3 are calculated as
| (3) |
| (4) |
and
| (5) |
The value of is computed similarly using the points gathered in R. The generation of each matrix is bounded to O(υ) time, where υ is the dimensionality of each data point vector (here, υ = 3). However, depending on which algorithms are used for matrix multiplication and inversion, the calculation of H(·) is theoretically bounded to O(n3) time for an n × n matrix.
The 3-point registration method provides a benchmark of performance, as it is the simplest approach to generalized multisystem registration. It is, however, also the most error-prone. From [1], it was hypothesized that maximizing the distance between sampled poses such that the work volume is subsumed would result in reduced translational and rotational errors. However, as was seen in that paper, such impacts on performance were robot-dependent. A more formalized evaluation of the registration strategy is repeated in this paper to quantify the statistical impact on performance.
B. Redundant Combinatorial Averaging
The next logical strategy leverages more data points to add redundancy to the registration. In particular, an arbitrary number of additional points that are measurable in both R and N can be used by calculating the transformation matrix for all unique 3-point noncollinear combinations (i.e., a full-factorial set of registrations). Subsequently, an element-wise average across all the calculated transformation matrices yields a single averaged homogeneous transformation matrix
| (6) |
where the set Q consists of all matrices created using
| (7) |
and | · | indicates cardinality and M is the total number of available points. The worst case time to complete of (6) is O(|Q|n), but the process for calculating the redundant combinatorial average is dominated by the computation of (7), which is completed in O(|Q|n3). Also, note that (6) assumes orthogonality of the rotational component of the resultant homogeneous transformation matrix , which is feasible only for extremely small rotational deviations. Otherwise, the average rotation must be computed separately from the translational component (see [17]). It is also assumed in (7) that pj, pk, and pl are not collinear.
This approach is hypothesized to improve registration since any one 3-point registration is subject to measurement error, and averaging multiple registrations would help attenuate inaccuracies induced by the error associated with any one registration.
C. Simulated Annealing Optimization
Simulated annealing (SA) is a well-known global optimization routine that requires an acceptance probability density function p(·), a cost function E(·), and a cooling schedule T (·). Applying SA to the problem of coordinate system registration will be achieved as follows.
Given an initial registration from R to N , the following error matrix is defined as the error between all points measured in N by 1) a reference system (Npi,ref ∈ ℝ3×1) and 2) a robot (Npi,robot ∈ ℝ3×1):
| (8) |
and cost function
| (9) |
where Ei is the i th row of E, NPref = [N p1,ref, …, N pn,ref]T ∈ ℝn×3, and NProbot = [N p1,robot, …, N pn,robot]T ∈ ℝn×3. All points N pi,ref are assumed directly measurable, while N pi,robot is calculated from
| (10) |
where is assumed given and Rpi,robot is measurable by a robot. Furthermore, is a modifier 4×4 transformation matrix defined by the parameters for optimization Θ = {x, y, z, α, β, γ }, where α is the rotation about the x-axis, β is the rotation about the y-axis, and γ is the rotation about the z-axis (Euler ZYX convention is used). Essentially, will be used to make small adjustments to to improve registration accuracy. Inherent Gaussian error is assumed to exist for both N pi,ref and N pi,robot, therefore
| (11) |
Given the collection of ground truth data points NPref, the posterior distribution in the unknown parameters is
| (12) |
and given a Gaussian error model, the likelihood function can be defined as
| (13) |
where Ei is the i th row of E. Substituting a noninformative prior p(Θ, σ2) ∝ σ−2 and (13) into (12) yields
| (14) |
Coupling the acceptance probability density function in (14) with a cooling schedule
| (15) |
completes the requirements for performing SA, where τ is the current iteration in the SA sampling process and n is the total number of iterations. In this case, C = 2. It is worth noting that, because SA is a hill-climbing heuristic, it is theoretically unbounded. Therefore, the methodology converges in, at worst, O(∞) time. The computational complexity results are thus implementation specific (programming environment, user-defined settings, etc.). Here, the convergence to an optimal registration was completed within a few seconds.
An attractive quality of this approach is that optimization progresses under the assumption that measurements (from both reference and robot) are not error-free, which is an accurate reflection of reality.
D. Clustering
A positive correlation exists between the registration error and the distance from the origin of the registration pattern. It is hypothesized that selecting the closest from a number of localized registration regions may reduce these spatially correlated errors. Generating and maintaining a transformation matrix for all M registration points may be excessively redundant if the robot’s work volume is subsumed by the registration set. Subsampling the training set, therefore, presents a more reasonable and generalized solution. One simple approach to automating the subsampling process is to use centroid-based clustering algorithms (e.g., k-means [18]) to seed the work volume with registration kernels. This would associate geographically similar registration points in the robot’s ℝ6 coordinate space. This allows spatially disparate dense groups of registration points (see Fig. 4) to be represented by a single reference coordinate system transformation.
Fig. 4.
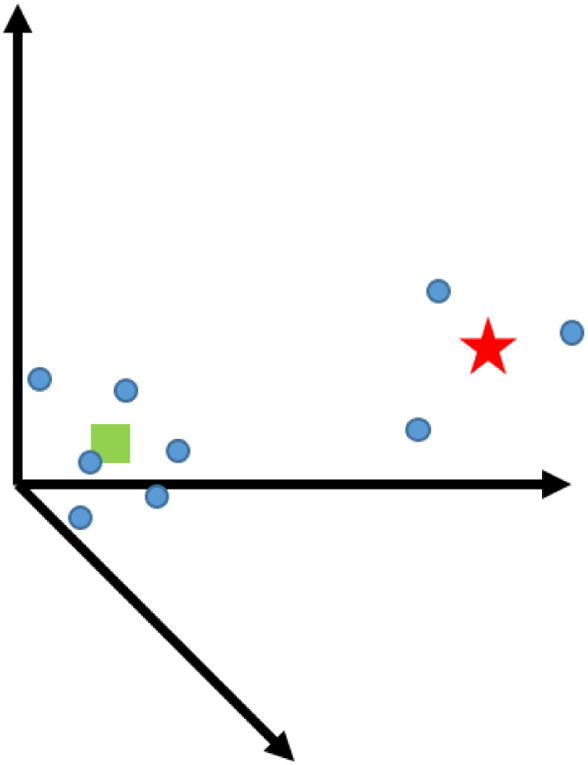
Nominal two-cluster data set in ℝ3 in which the data points (blue dots) are naturally grouped into two cluster kernels (red star and green square).
Each cluster consists of feature patterns composed of the coordinate space’s input points {N p1, …, N pM} ∈ ℝ3 and associated attributes consisting of the robot’s input points {Rp1, …, RpM} ∈ ℝ6. Clustering is performed on the feature space values for k clusters, where each cluster kernel N pc ∈ C = {N p1, …, N pk} ∈ ℝ3 is the centroid of all spatially correlated coordinate space points. Similarly, the cluster’s average attributes Rpc ∈ {Rp1, …, Rpk} ∈ ℝ6 are the mean of the associated robot base points. The clustering algorithm takes O(υkMt) time, where υ is the dimension of the pattern and attribute vectors (here, υ = 6), and t is the number of reclustering iterations that must be completed prior to convergence (which is bounded to [19]).
Each cluster c is then associated with matrix rooted at N pc. This matrix is calculated as
| (16) |
where mc is the number of member input patterns associated with the cluster and
| (17) |
using the H(·) function from (1). The number of registrations averaged is based on the population of each cluster, so the time to complete (16) given (17) is O(qn3), where is the total number of registrations performed over all k clusters. As with (6), (16) assumes orthogonality of given expectations of extremely small rotational deviations. Otherwise, the rotational component may need to be averaged separately from the translational component.
If M is small compared with the number of clusters (e.g., if M ≤ 3k), or if too many cluster members are collinear, the entire registration set may be used in (16) [i.e., ]. Otherwise, a pattern N pj is said to belong to cluster c based on the assertion that, ∀d ∈ C, d ≠ c, the distance from N pj to N pc is less than the distance from N pj to N pd. For a queried target coordinate space position t associated with kernel N pc, the robot would use the transformation matrix to determine its base coordinate system pose Rpt to place the TCP at Npt.
IV. Verification: Registration Improvement
In this section, the evaluation methodology is verified by assessing the performance gains expected from employing the strategies outlined in Section III. The test configuration was set up as described in Section II-A. Registration data were collected by hand-guiding the robot to predefined registration seats located on a single optical breadboard plate (Fig. 1). Seven registrations were generated using the following procedures:
Small 3-Point: The 3-point registration method trained using data collected over a (250 × 175) mm2 area.
Large 3-Point: The 3-point registration method trained using data collected over a (750 × 525) mm2 area.
Large 5-Point: The combinatorial registration method described in Section III-B trained using five registration points2 collected over a (750 × 525) mm2 area.
SA Small 3-Point: Small 3-point, above, optimized using SA as described in Section III-C.
SA Large 3-Point: Large 3-point, above, optimized using SA.
SA Large 5-Point: Large 5-point, above, optimized using SA.
Clustering: The clustering method described in Section III-D, with two clusters based on four registration data points taken over a (750 × 525) mm2 area.
A. Spatial Correlation r
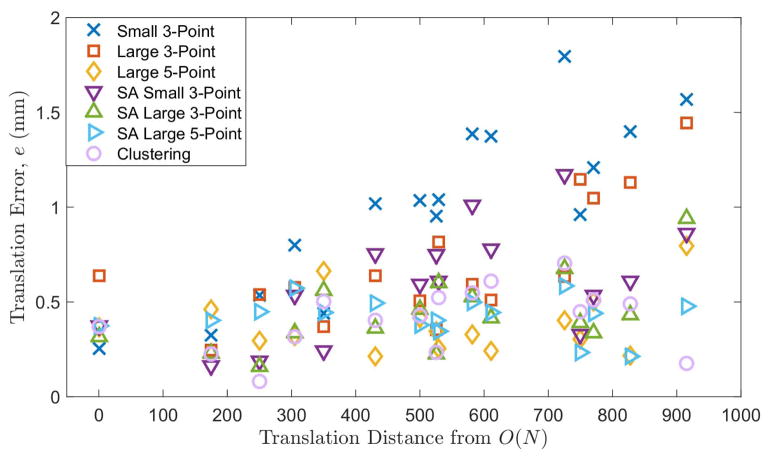
To quantify spatial correlation, the correlation coefficient r, the corresponding p-value p was calculated between the translation distance from the origin of N, O(N), and the translation error. The p-value indicates the probability of obtaining r by chance when the true value of r is zero. Referring to Table I, significant spatial correlation (at the 95% CL) between the translation error and the distance from the world origin is detected for Small 3-point, Large 3-point, SA Small 3-point, SA Large 3-point, and Clustering registration methods. Insignificant spatial correlation is detected for Large 5-point and SA Large 5-point registration methods.
TABLE I.
Correlation Coefficient (r) and p-Value Between the Registered Translational Error and the Distance From the Extrinsic Coordinate System Origin.
| Registration Method | r | p |
|---|---|---|
| Small 3-point | 0.855 | 0.000* |
| Large 3-point | 0.687 | 0.000* |
| Large 5-point | 0.141 | 0.214 |
| SA Small 3-point | 0.546 | 0.000* |
| SA Large 3-pomt | 0.513 | 0.000* |
| SA Large S-point | −0.109 | 0.337 |
| Clustering | 0.316 | 0.004* |
Indicates Statistical Significance
Referring to Fig. 5 and observing the r values across registration methods, two important trends are noticeable: 1) registering on more data reduces spatial correlation and 2) applying machine learning reduces spatial correlation. As a general note, since correlation is detected within some of the performance data, the actual error rates of the subsequent statistical tests involving spatially correlated data sets may deviate from their theoretical values (i.e., alterations to Types I and II error rates). Nevertheless, the tests will be conducted as their accuracy is still likely higher than conclusions made by visual inspection.
Fig. 5.
Registration error as a function of distance from world origin.
B. Distribution KS
The KS test was used to determine whether the distributions of performance samples of two different registration methods are sufficiently similar (i.e., samples come from the same population). The result of this test is also a first-line indicator as to whether differences will be seen between sample means and variances in subsequent testing. To reduce the reporting complexity associated with conducted comparative tests across all pairs of registration methods, statistical tests were only conducted between two adjacent methods as listed in Table II (order is approximately established by decreasing error variance.) Therefore, results should be interpreted in sequential context.
TABLE II.
Values and Significance of Performance Distribution, Mean, and Variance.
| Registration Method | KS | ē (mm) | (mm2) |
|---|---|---|---|
| Small 3-point | - | 1.006 | 0201 |
| Large 3-point | 0.000* | 0.699* | 0.113* |
| SA Small 3-point | 0.155 | 0.594 | 0.087 |
| SA Large 3-point | 0.000* | 0.435* | 0.046* |
| Clustering | 0.907 | 0.410 | 0.035 |
| Large 5-point | 0.106 | 0.383 | 0.031 |
| SA Large 5-point | 0.000* | 0.422 | 0.019* |
Indicates Statistical Significance With Entry of Previous Row
For example, significant distributional differences were detected between Small 3-point and Large 3-point, but not between Large 3-point and SA Small 3-point. Inference suggests then that there is likely a significant distributional difference between Small 3-point and SA Small 3-point. Following, a significant distributional difference is seen between SA Large 3-point and SA Small 3-point. Differences should also then exist between SA Large 3-point and Small 3-point. Finally, distributional difference is significant between SA Large 5-point and Large 5-point, and differences should be detected between SA Large 5-point and all previously listed registration methods. The main trends here are that increasing the distance between registration points, increasing the quantity of registration points, and applying machine learning to the registration process, which are all relevant and impactful factors for inciting changes in registration performance. The following analyses will reveal more detail regarding these differences in performance.
C. Sample Variance
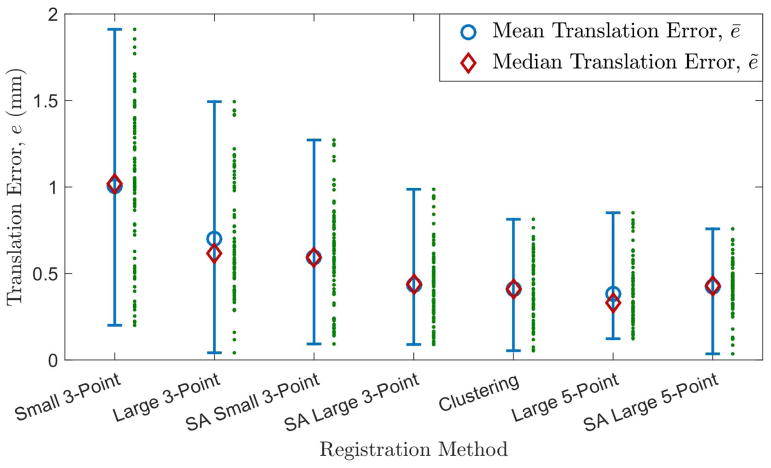
Similar to the results of the KS test, the onset of statistically significant differences in translation error variance were detected between Small 3-point and Large 3-point, SA Small 3-point and SA Large 3-point, and Large 5-point and SA Large 5-point. In this category, the best performing registration method outperforms the worst performing registration method by a factor of ten. This further corroborates the notion that substantial changes can be obtained by increasing the distance between points for registration, obtaining more points for registration, and applying machine learning to registration. In this particular case, those changes consist of rather large reductions in sample variances. This trend is visualized in Fig. 6 where the raw translation error, mean translation error ē, median translation error ẽ, and maximum and minimum translation errors are plotted.
Fig. 6.
Range of registration errors per registration method. The mean and median errors are marked on the bar plot, while the raw measurement errors are shown to the right of the respective plots.
D. Sample Mean ē
Similar trends are again seen when comparing sample means. In this category, the best performing registration method outperforms the worst performing registration method by at least a factor of two. However, significant reduction in mean translation error is not seen after the SA Large 3-point registration method. This is likely due to the fact that the process for registration and subsequent performance measurements is inherently prone to some level of measurement error, which positively lower bounds the best mean performance possible. Regardless, the results still point to the same three factors for improving registration as before.
V. Validation: Functional Performance
As a validation step, one-shot peg-in-hole insertion trials were performed to evaluate the effectiveness of registered translation error as a primary indicator for application-level performance. The assembly process involved inserting the peg into the hole given a single attempt without any corrective maneuvers (hence, one-shot). Although outside the scope of these insertion trials, there exist several additional methods for improving insertion performance without the addition of extrinsic sensors including remote center of compliance devices [20], intrinsic force or impedance control [21], pose misalignment correction [22], and inclusion of chamfers in the design of assembly parts [23].
A. Setup
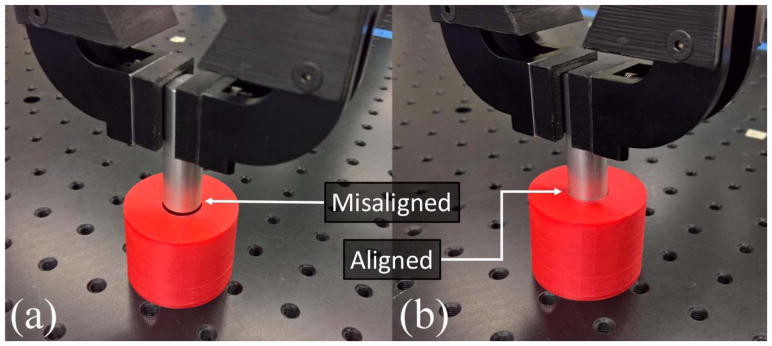
The assembly parts consisted of a 3-D printed hole and an aluminum cylindrical peg of diameter 15 mm with a peg-hole clearance of 0.08 mm (Fig. 7). Again, these pegs are inexpensively manufactured from low-cost tight-tolerance metal rods. The pegs were held with a pneumatic parallel gripper attached to the robot and inserted into the hole under position control. The forces at the TCP were monitored and the assembly was aborted if a force spike in excess of 30 N was measured in the z-axis, which indicated sufficient peg-hole misalignment.
Fig. 7.
Position-based robotic peg-in-hole insertions in (a) failed and (b) successful states. Small translational or rotational offsets result in peg-hole misalignments that prevent successful insertions.
The evaluation consisted of running the peg-in-hole insertion at the aforementioned 16 sites shown in Fig. 1. The insertions were attempted at each location using the different registration methods described in Section IV. It was observed that the parallel gripper was more rigid in its direction of actuation (x-axis) than in the direction orthogonal to both the direction of insertion (z-axis) and x-axis. As such, two sets of five repetitions were performed at each assembly site—five repetitions at a 0° rotation about the z-axis, and five repetitions at a 90° rotation about the z-axis—to incorporate the effects of an anisotropically compliant gripper on the insertions.
B. Results and Analysis
The probability of successfully inserting a peg is shown in Table III with its associated registration method. Given a CL ∈ ℝ : [0, 1], number of successes m, and number of independent trials n, one can calculate the theoretical upper probability of success (PS) ∈ ℝ : [0, 1] from the following inequality involving the binomial cumulative distribution function:
| (18) |
where PS is its minimum value to some precision while still satisfying (18) [24]. Meanwhile, indication of statistical significance at the 95% CL between the PS values of different registrations was achieved through the use of the Kolmogorov–Conover algorithm [25]. These tabulated PS values reveal that, for this particular insertion task, registrations that leverage machine learning or more data points yield the most significant performance gains. In fact, the Clustering and SA Large 5-point methods (which leverage both machine learning and slightly more data) yield the highest PS values of 0.982 (all pegs were successfully inserted).
TABLE III.
Mean Translational Error, Maximum Translational Error, and Significance of Probability of Successful Insertion.
| Registration Method | ē (mm) | max(e) (mm) | PS |
|---|---|---|---|
| Large 3-point | 0.699 | 1.493 | 0.427 |
| Small 3-point | 1.006 | 1.911 | 0.590* |
| SA Large 3-point | 0.435 | 0.987 | 0.817* |
| SA Small 3-point | 0.594 | 1.271 | 0.889* |
| Large 5-point | 0.383 | 0.851 | 0.897 |
| Clustering | 0.410 | 0.813 | 0.982* |
| SA Large 5-point | 0.422 | 0.758 | 0.982 |
Indicates Statistical Significance With Entry of Previous Row
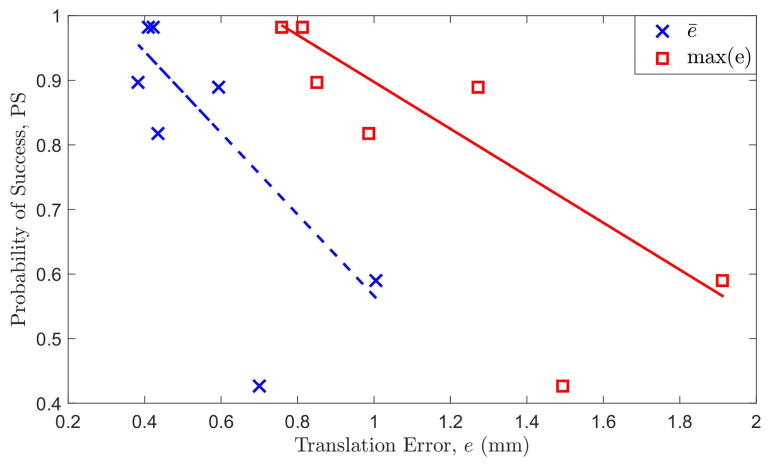
Interestingly, Table III also reveals some counter-intuitive results. First, the listing order of registration methods in this table is by increasing PS values. When compared to Table II, all of the registration methods experienced a shift in their listing by one row except for SA Large 5-point. This implies that quantifying translation error is not a perfect indicator for task-level robot performance. In Fig. 8, PS is plotted against the mean and maximum translation error per registration method.
Fig. 8.
Probability of a successful insertion as a function of mean and maximum translation error.
As shown, PS is negatively correlated with translation error, but the PS-error signal becomes extremely noisy with larger translation errors. This discrepancy likely indicates that task-level performance does not solely depend on translation error. Other factors may include the direction of translation error, orientation error, mechanical properties and alignment of the gripper, and properties of the robot arm. Regardless, there does exist a correlation between translation error and PS. In fact, the maximum translation error and PS produce a statistically significant correlation coefficient r of −0.805 with a p of 0.029. Meanwhile, the mean translation error and PS produce an r of −0.740 and p of 0.057 (barely insignificant at a 95% CL). This slight discrepancy indicates that the maximum translation error is perhaps a more robust indicator of PS than the mean translation error.
This conclusion is logical since if the maximum translation error is within the tolerance required for peg insertion, then all insertions should succeed. On the other hand, the mean translation error may be within the tolerance required for peg insertion, but the variance in translation error may be sufficiently large to prevent successful insertion for some scenarios.
VI. Conclusion
In this paper, an extension to a registration framework was presented that provides test methodologies and metrics for the statistical evaluation of performance gains associated with simple strategies targeted at minimizing or correcting registration error. A number of generalized strategies for reducing registration errors were also presented, and the metrological impacts of applying these strategies were investigated. Verification and validation steps were provided to assess the correctness of the methodology. Key, generalized takeaways include the following.
Adding Registration Data Points Reduces Registration Error: However, as M → ∞, the registration effectively becomes a one-to-one mapping with diminishing returns (specifically, the registration error will eventually be dominated by the repeatability and rigidity uncertainty of robots, tools, and parts).
Applying Machine Learning or Optimization Methods (e.g., Clustering, SA) to the Acquired Registration Data Can Provide Significant Performance Gains: Even simple methods to compensate for errors from the base registration reduce uncertainty and improve robot performance.
Larger Registration Patterns Result in Lower Registration Error: However, as was observed in Section V, the lower registration error of larger patterns does not necessarily guarantee superior application-level performance over smaller patterns.
Maximum Registration Error Is a Better Performance Indicator Than Mean/Median Error: It was observed in Section V that maximum registration error is significantly correlated with expected performance.
Biographies

Karl Van Wyk received the bachelor’s degree in mechanical engineering from Vanderbilt University, Nashville, TN, USA, in 2009, and the M.S. and Ph.D. degrees in mechanical engineering from the University of Florida, Gainesville, FL, USA, in 2011 and 2014, respectively.
He is currently a Research Scientist with the Intelligent Systems Division, National Institute of Standards and Technology, Gaithersburg, MD, USA. His current research interests include dynamics and control of robotic systems, machine learning, and robotic hands.

Jeremy A. Marvel (M’10) received the bachelor’s degree in computer science from Boston University, Boston, MA, USA, the master’s degree in computer science from Brandeis University, Waltham, MA, USA, and the Ph.D. degree in computer engineering from Case Western Reserve University, Cleveland, OH, USA.
Following a tour at Akron University, Akron, OH, USA, as an Adjunct Professor, he served as a Research Associate at the Institute for Research in Engineering and Applied Physics, University of Maryland, College Park, MD, USA, while simultaneously taking a role as a Guest Researcher at the National Institute of Standards and Technology (NIST), Gaithersburg, MD, USA. In 2012, he transitioned to NIST as a Computer Scientist, where he contributed directly to projects on robotic perception and dexterous manipulation and led research efforts for traditional and collaborative robot safety. He currently leads a team of scientists and engineers in metrology efforts at NIST toward collaborative robot performance. He is also a Research Scientist with the Intelligent Systems Division, NIST. His current research interests include intelligent and adaptive solutions for robot applications, with particular attention paid to human–robot and robot–robot collaborations, multirobot coordination, safety, perception, and automated parameter optimization.
Footnotes
Software for statistical tests is freely available at https://www.nist.gov/el/intelligent-systems-division-73500/performance-data-analytics.
The fifth registration point was chosen off-center and inside the rectangular area in order to prevent collinearity with the corner registration points (see Fig. 1).
Disclaimer
Certain commercial equipment, instruments, or materials are identified in this paper to foster understanding. Such identification does not imply recommendation or endorsement by the National Institute of Standards and Technology, nor does it imply that the materials or equipment identified are necessarily the best available for the purpose.
References
- 1.Marvel JA, Van Wyk K. Simplified framework for robot coordinate registration for manufacturing applications. Proc. IEEE Int. Symp. Assembly Manuf; Sep. 2016; pp. 56–63. [Google Scholar]
- 2.KUKA System Software 5.6 LR: Operating and Programming Instructions for System Integrators, KSS 5.6 LR SI V5 EN Ed. KUKA Laboratories GmbH; Augsburg, Germany: 2012. [Google Scholar]
- 3.Operating Manual: IRC5 With FlexPendant. ABB AB; Västeras, Sweden: 2015. [Google Scholar]
- 4.Grunert P, Darabi K, Espinosa J, Filippi R. Computer-aided navigation in neurosurgery. Neurosurg Rev. 2003;26(2):73–99. doi: 10.1007/s10143-003-0262-0. [DOI] [PubMed] [Google Scholar]
- 5.Woerdeman PA, Willems PWA, Noordmans HJ, Tulleken CAF, van der Sprenkel JWB. Application accuracy in frameless image-guided neurosurgery: A comparison study of three patient-to-image registration methods. J Neurosurg. 2007;106(6):1012–1016. doi: 10.3171/jns.2007.106.6.1012. [DOI] [PubMed] [Google Scholar]
- 6.Haidegger T, Xia T, Kazanzides P. Accuracy improvement of a neurosurgical robot system. Proc. IEEE/RAS-EMBS Int. Conf. Biomed. Robot. Biomechatronics; 2008. pp. 836–841. [Google Scholar]
- 7.Satoh K, Takemoto K, Uchiyama S, Yamamoto H. A registration evaluation system using an industrial robot. Proc. 5th IEEE/ACM Int. Symp. Mixed Augmented Reality; Sep. 2006; pp. 79–87. [Google Scholar]
- 8.Kotake D, Uchiyama S, Yamamoto H. A marker calibration method utilizing a priori knowledge on marker arrangement. Proc. 3rd IEEE/ACM Int. Symp. Mixed Augmented Reality; Aug. 2004; pp. 89–98. [Google Scholar]
- 9.Marvel JA. PhD dissertation. Dept. Elect. Eng. Comput. Sci., Case Western Reserve Univ; Cleveland, OH, USA: 2010. Autonomous learning for robotic assembly applications. [Google Scholar]
- 10.Tsai RY, Lenz RK. A new technique for fully autonomous and efficient 3D robotics hand/eye calibration. IEEE Trans Robot Autom. 1989 Jun;5(3):345–358. [Google Scholar]
- 11.Shiu YC, Ahmad S. Calibration of wrist-mounted robotic sensors by solving homogeneous transform equations of the form AX= XB. IEEE Trans Robot Autom. 1989 Jan;5(1):16–29. [Google Scholar]
- 12.Shah M. Solving the robot-world/hand-eye calibration problem using the Kronecker product. J Mech Robot. 2013;5(3):031007. [Google Scholar]
- 13.Li H, Ma Q, Wang T, Chirikjian GS. Simultaneous hand-eye and robot-world calibration by solving the AX = Y B problem without correspondence. IEEE Robot Autom Lett. 2016 Jan;1(1):145–152. [Google Scholar]
- 14.Wang J, Wu L, Meng MQ-H, Ren H. Towards simultaneous coordinate calibrations for cooperative multiple robots. Proc. IEEE/RSJ Int. Conf. Intell. Robots Syst; Sep. 2014; pp. 410–415. [Google Scholar]
- 15.Wu L, Wang J, Qi L, Wu K, Ren H, Meng MQH. Simultaneous hand–eye, tool–flange, and robot–robot calibration for comanipulation by solving the AXB=YCZ problem. IEEE Trans Robot. 2016 Feb;32(2):413–428. [Google Scholar]
- 16.Aguirre GK, Zarahn E, D’Esposito M. A critique of the use of the Kolmogorov–Smirnov (KS) statistic for the analysis of BOLD fMRI data. Magn Reson Med. 1998;39(3):500–505. doi: 10.1002/mrm.1910390322. [Online]. Available: [DOI] [PubMed] [Google Scholar]
- 17.Moakher M. Means and averaging in the group of rotations. SIAM J Matrix Anal Appl. 2002;24(1):1–16. [Google Scholar]
- 18.Lloyd SP. Least squares quantization in PCM. IEEE Trans Inf Theory. 1982 Feb;IT-28(2):129–137. [Google Scholar]
- 19.Arthur D, Vassilvitskii S. How slow is the K-means method?. Proc. 22nd Annu. Symp. Comput. Geometry; 2006. pp. 144–153. [Google Scholar]
- 20.Whitney D, Nevins J. What is remote center compliance (RCC) and what can it do?; Proc. 9th ISIR; Washington, DC, USA. 1979. [Google Scholar]
- 21.Marvel JA, Falco J. Tech Rep 7901. Nat. Inst. Standards Technol; Gaithersburg, MD, USA: 2012. Nistir 7901: Best practices and performance metrics using force control for robotic assembly. [Online]. Available: [DOI] [Google Scholar]
- 22.Tang T, Lin H-C, Zhao Y, Chen W, Tomizuka M. Autonomous alignment of peg and hole by force/torque measurement of robotic assembly. Proc. IEEE Int. Conf. Autom. Sci. Eng; Sep. 2016; pp. 162–167. [Google Scholar]
- 23.Boothroyd G, Dewhurst P, Knight WA. Product Design for Manufacture Assembly. 2. ch. 3. Boca Raton, FL, USA: CRC Press; 2002. Product design for manual assembly; pp. 133–173. [Google Scholar]
- 24.Gilliam D, Leigh S, Rukhin A, Strawderman W. Pass-fail testing: Statistical requirements and interpretations. J Res Nat Inst Standards Technol. 2009 Apr;114:195–199. doi: 10.6028/jres.114.013. [DOI] [PMC free article] [PubMed] [Google Scholar]
- 25.Conover W. A kolmogorov goodness-of-fit test for discontinuous distributions. J Amer Statist Assoc. 1972;67(339):591–596. [Google Scholar]


