Abstract
Ultrasound attenuation coefficient estimation has diagnostic potential for clinical applications such as differentiating tumors and quantifying fat content in the liver. The two commonly used attenuation coefficient estimation methods in ultrasound array imaging system are the spectral shift method and the reference-phantom-based methods. The spectra shift method estimates the central frequency downshift along depth, whereas the reference-phantom-based methods use a well-calibrated phantom to cancel system dependent effects in attenuation estimation. In this study, we propose a novel system- independent attenuation coefficient estimation technique based on spectra normalization of different frequencies. This technique does not require a reference phantom for normalization. The power of each frequency component is normalized by the power of an adjacent frequency component in the spectrum to cancel system-dependent effects such as focusing and time gain compensation. This method is referred to as the reference frequency method, and its performance has been evaluated in phantoms and in-vivo liver studies. The reference frequency method technique can be applied to various transducer geometries (e.g. linear or curved arrays) with different beam patterns (e.g. focused or unfocused).
Index Terms: Ultrasound attenuation coefficient estimation (ACE), frequency power spectra decay, system-independent, least squares method (LSM)
I. Introduction
Ultrasound attenuation coefficient estimation (ACE) has diagnostic potential for many clinical applications such as differentiating tumors and quantifying fat content in the liver [1–5]. One example is for breast tissue classification. It was reported that fibrosis has higher acoustic attenuation than normal tissue, which provides clinical potential for breast cancer diagnosis [6]. Another example for ACE applications is fatty liver quantification. The accumulation of fatty droplets in the liver can lead to steatosis, which may progress to fibrosis, cirrhosis, liver failure or hepatocellular carcinoma [7]. There- fore, the measurement of fat content in liver has high clinical significance to avoid progression of steatosis to fibrosis or worse conditions. Previous studies have reported that elevated fat content in the liver is associated with increased ultra- sound attenuation [2–5]. Therefore, by measuring ultrasound attention coefficient estimation (ACE), one can potentially quantify liver fat [2–5, 8]. Compared with the clinical gold standard, liver biopsy, ACE is a non-invasive measurement, which is more suitable for frequent follow-up exams [9]. Hence, accurate ACE in the liver has clinical promises in fatty liver detection and assessment. In addition, accurate ACE is the prerequisite for measuring other acoustic parameters, such as the backscatter coefficient [10, 11], effective scatterer diameter, and effective acoustic concentration [12]. Therefore, robust ACE is important for many other ultrasound clinical applications.
At present, the two commonly used ACE methods in ultrasound array imaging systems are the spectral shift method [13–15] and the reference phantom-based methods [10, 16–21], with many efforts on improving the methods’ stability [22–25]. The spectral shift method estimates the attenuation coefficient through the downshift of the ultrasound center frequency with increasing depth [21]. For the reference phantom-based methods, such as the spectra difference method [10, 17, 18], spectra log difference method [19, 20], and the hybrid method [21, 25], a well-calibrated phantom is used to normalize system-dependent effects such as focusing, diffraction, and time gain compensation (TGC). However, in practice, a well-calibrated phantom is not always available and its ultrasound properties may change over time [12].
Herein, we propose a new ACE method: the reference frequency method (RFM). RFM does not require a well-calibrated reference phantom. System-dependent effects can be cancelled out by spectral normalization using adjacent ultrasound frequency components, which allows RFM to be implemented with various transducer geometries (e.g., linear or curved arrays) and beam patterns (e.g., focused or unfocused).
The paper is organized as follows: Section II introduces backscattered ultrasound signal modeling and derives the theoretical basis for RFM. Experimental configurations are also described, including those used in the phantom and in-vivo liver studies. Section III describes the results acquired in the phantom and in-vivo liver studies and demonstrates the RFM performance. Section IV discusses the advantages and future directions of RFM. Section V presents the conclusion.
II. Methods
A. Backscattered Ultrasound Signal Modeling
In ultrasound imaging, the power spectrum of the backscattered radiofrequency (RF) signals S(fi , zk) is a function of backscatter location and the frequency of ultrasound, which can be modelled as [10, 26]
| (1) |
where G(fi) accounts for the transmit and receive transducer responses at frequency fi (i is the frequency component index); TGC(zk) is the time gain compensation (TGC), which varies as a function of depth zk (k is the depth index); D(fi , zk) is the combined effects of focusing, beamforming, and diffraction; BSC(fi) is the backscatter coefficient which is assumed to be uniform in the local region of interest (ROI); and A(fi, zk) is the frequency-dependent attenuation defined as [10, 26]:
| (2) |
where a is the frequency-dependent ultrasound attenuation coefficient. A(fi, zk) is also assumed to be uniform in the ROI and has linear frequency dependency. This model generally fits ultrasound systems with different beam patterns (e.g. focused or unfocused) [10, 26].
B. Linear Decay of Frequency Power Ratio
To estimate attenuation coefficient a, certain multiplicative terms shown in Eq. (1) need to be cancelled first. This can be accomplished by regarding the adjacent frequency in the power spectrum fi−1 as the reference frequency and calculating the power ratio (Rs(fi, zk)) between adjacent frequency components S(fi , zk) and S(fi−1, zk) as
| (3) |
We assume that the differences of beamforming and diffraction effects between fi and fi−1 (i.e., two adjacent frequency components) are negligible in the imaging regions where beam patterns change slowly, such as in plane wave imaging or in the post-focal zone of focused beam imaging. We then obtain the following relationship:
| (4) |
In addition, TGC(zk) is assumed to be independent of fi. Hence, these two terms (i.e., D and TGC) can be cancelled after determining the ratio as in Eq. (3), and we obtain the following relationship:
| (5) |
After taking the natural logarithm on both sides of Eq. (5), we obtain the following linear relationship between frequency power ratio (ln[Rs(fi, zk)]) and imaging depth (zk):
| (6) |
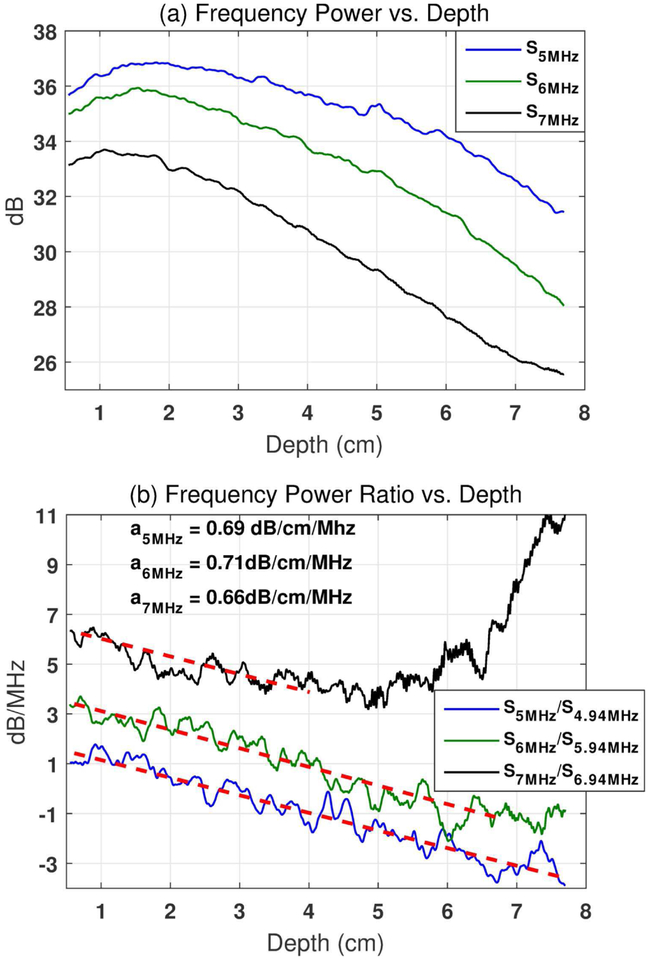
Equation (6) shows that the frequency power ratio (ln[Rs(fi , zk)]) decays with increasing depth (zk) at a linear rate of [−4a(fi − fi−1)]. Therefore, the attenuation coefficient can be estimated from the slope of the decay curve with respect to each frequency component. The term {ln[G(fi)] − ln[G(fi−1)] + ln[BSC(fi)] − ln[BSC(fi−1)]} is the intercept of the decay curve (independent of zk) which does not affect the slope of the curve (i.e., attenuation coefficient). Figure 1 (a)shows the frequency power after natural logarithm calculation (i.e., ln[S(fi, zk)]) as a function of depth with three example frequency components (fi = 5, 6, and 7 MHz) in a calibrated tissue-mimicking phantom (Fibroscan- calibrated value: 0.68 dB/cm/MHz). Figure 1 (b)shows the frequency power ratio after natural logarithm conversion (i.e., ln[Rs(fi, zk)]) as a function of depth calculated at the same frequency components with their adjacent frequencies (fi = 5, 6, and 7 MHz, and Δf = fi − fi−1 = 0.06MHz). In Figure 1 (b), the frequency curves decay with similar linear slopes for different frequencies at zk ≤ 4cm. However, the 6 MHz frequency curve starts to deviate from the linear decay trend at a depth of approximately 6 cm, and the 7 MHz frequency curve starts at approximately 4 cm. The deviation is caused by the higher ultrasound attenuation experienced by the higher frequency signals, which results in significantly lowered signal-to-noise-ratio (SNR) and consequently falsely elevated frequency power ratio. The higher the ultrasound frequency, the shallower the depth that the deviation would start to occur. The falsely elevated decay curve may lead to underestimation of the attenuation coefficient and limit the penetration of the method. In practice, the assumption of uniform tissue acoustic attenuation may be violated by non-uniform tissue structures, which leads to significant oscillations of the frequency power ratio decay curves. In such cases, directly fitting a linear slope to the frequency power ratio decay curve at each frequency and averaging the results may be suboptimal for obtaining robust attenuation measurement. Therefore, here we adopted the least squares method (LSM) to mitigate these issues (i.e., noise and oscillations on the decay curve) and improve the estimation accuracy. In LSM, the power spectra ratio after natural logarithm calculation (i.e., ln[Rs(fi, zk)]) at all frequencies can be fitted to a one-parameter model [27]. The model can automatically search for the best solution to minimize estimation errors over all frequencies.
Fig. 1.
(a). Frequency power after natural logarithm conversion (i.e., ln[S(fi, zk)]) as a function of depth at three example frequencies (i.e., fi = 5, 6, and 7 MHz). (b). Frequency power ratio after natural logarithm conversion(i.e., ln[RS(fi, zk)], Δf = fi − fi−1 = 0.06MHz) as a function of depth calculated with the same frequency components and their adjacent frequencies. The frequency power ratio decay curves for 6 and 7 MHz were shifted upwards by 2 and 4 dB/MHz, respectively, for better visualization. The linear fittings for each frequency are shown by the red dashed lines with the attenuation coefficient values shown in the left upper corner of (b). The data were acquired from a Fibroscan-calibrated tissue-mimicking phantom (0.68 dB/cm/MHz). The phantom was imaged with unfocused plane wave imaging at 5 MHz center frequency using a Verasonics Vantage system.
C. Attenuation Coefficient Estimation with the Least Squares Method
After calculating the spectra ratio ((Eq. 5)), two unknown terms remain in the expression: the transducer frequency response [G(fi)] and backscatter coefficient [BSC(fi)]. To complete ACE with the LSM model, these two terms need to be cancelled. Cancellation can be accomplished by normalizing the frequency power ratio [Rs(fi , zk)] using the value obtained at a reference depth, zr [i.e., Rs(fi, zr), r is the reference depth index]. Afterward, both G(fi) and BSC(fi) in (Eq. 5) can be cancelled because of depth independency. Estimations obtained using different zr values can be averaged to reduce errors due to electric noise (as shown in Fig. 1)[28], oscillations due to small non-uniform structures in the tissue, and spatial variation noise due to constructive and destructive interferences from the backscattered signals [29]. Uncorrelated zr values with at least one-pulse-length interval are preferred for effective averaging. The normalization step can be described as
| (7) |
Taking the natural logarithm on both sides of Eq. (7), we obtain the following linear relationship of the LSM model:
| (8) |
when zk ≠ zr.
There is only one unknown variable, a, that needs be solved in the LSM model:
| (9) |
when zk ≠ zr.
R is the total number of reference depths used in the LSM fitting.
D. Defining Constraints for LSM
To further stabilize the estimates determined using LSM, constraints can be added to the model:
| (10) |
Then the solution of the LSM in Eq. (9) subject to the above bound constraints can be solved via proximal gradient iteration [30]. The maximum and minimum constraints can be determined in an adaptive way according to the acquired data. Because one measurement of the frequency power ratio, ln[Rsnor(fi, zk, zr)], can generate one estimation of a, we can first calculate all possible a values using all measurements as follows:
| (11) |
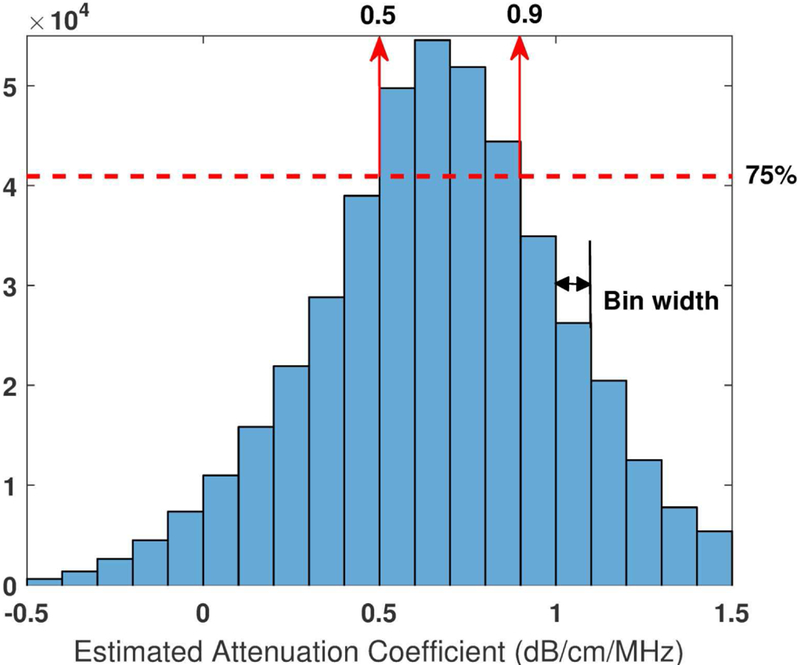
One attenuation value ai,k,r can be generated from each frequency component fi at each depth zk using each reference depth zr. The distribution of all estimated attenuation values can then be obtained by estimating the histogram of ai,k,r . Figure 2 shows a histogram example obtained from a Fibroscan-calibrated tissue-mimicking phantom (calibrated value: 0.68 dB/cm/MHz). The histogram presented a relatively wide range of attenuation distribution. This is caused by the oscillations of the frequency power ratio decay curves (Figure 1 (b)) due to noise and the constructive and destructive interferences from the backscattered signals [29]. In addition, when zk gets close to zr, it is equivalent to using a small-sized ROI for attenuation estimation. The estimation accuracy with small-sized ROI would be lowered and errors could occur (e.g., negative estimations in Figure 2) [23]. An extreme condition is when zk = zr, which makes the denominator of Eq. (11) zero. Consequently, constraints would be necessary for LSM to stabilize the attenuation estimation. In the example of Figure 2, the bin width of the histogram was set to be0.1 dB/cm/MHz. The cut-off limits were selected at 75% of the most frequent value (the cut-off limits were empirically determined and indicated by the red dashed line) on both sides. Then we calculate the constraints in this example as
| (12) |
Fig. 2.
Histogram of all estimated attenuation without any constraints (ai,k,r). The data were acquired from a Fibroscan-calibrated tissue-mimicking phantom with calibrated value of 0.68 dB/cm/MHz. The phantom was imaged with unfocused plane wave imaging at 5 MHz center frequency using a Vantage system. fi range: 4–6 MHz, Δf = fi- fi−1=0.06MHz, a total number of 34 fi was used; zk range: 3 cm, zk = zk-zk−1=0.0055cm, a total number of 550 zk was used; zr range: 3 cm, Δzr = zr-zr−1=0.1cm, a total number of 30 zr was used; A total number of 34 × 550 × 30 = 5.6 × 10⁵ attenuation values were estimated.
E. Experimental Configurations
1). Through-Transmission Calibration:
The proposed RFM was first validated using the through-transmission (T-T) calibration method [31]. A tissue-mimicking phantom was fabricated following the procedure as described in [31] (cylinder phantom, diameter: 5 cm, height: 4cm). A 50%−50% evaporated milk-to-water ratio was tested in the study using a pair of identical unfocused single-element transducers (Olympus, Center Valley, PA), transmitted at a 5 MHz center frequency.
RFM was then applied to estimate the attenuation coefficient of the fabricated tissue-mimicking phantom. The estimated value was then compared with the T-T calibrated value. RFM data were acquired using unfocused plane wave compounding with a Verasonics Vantage system (Verasonics Inc., Kirkland, WA), equipped with a linear array transducer L11–4v (4.5 – 10.5 MHz, Verasonics Inc., Kirkland, WA). For compounding plane wave imaging, 16 compounding angles were selected, which ranged from −15° to +15° at 2°interval. The pulse repetition frequency (PRF) was 4 kHz, leading to a 250 Hz post-compounding PRF. The center frequency of the transmit pulse was 5 MHz.
We then selected a region of interest (ROI) on the beam-formed IQ image. The ROI was set from 1 cm to 3.5 cm, both laterally and axially (i.e., size of 2.5 cm × 2.5 cm). Then, the selected ROI was divided into 10-wavelength-long data blocks along the axial direction (i.e. size of 0.3 cm ×2.5 cm). The axial overlap between data blocks were around 98%. Each A-line segment (i.e., 0.3-cm-long) in a given data block was first zero-padded to calculate sufficiently close fi and fi−1 values in the spectrum (Δf = fi − fi−1 = 0.06MHz in Figure 1). Then the Welch technique [32] was applied to the zero-padded A-line segment (0.3-cm-long) to obtain a single power spectrum. The power spectra of all A-line segments in the given data block were averaged laterally to obtain the mean power spectrum at a certain depth (zk), which is denoted as S(f, zk). A total number of 450 mean power spectra were obtained in a 2.5-cm-long ROI with 98% axial overlap between data blocks (Δzk = zk − zk−1 = 0.0055cm). The frequency power ratio between adjacent frequencies was calculated using Eq. (3). Then, the normalization step, as shown in Eq. (7), was applied by dividing the power ratio [Rs(fi, zk)] by the ratio acquired at the reference depth zr [Rs(fi , zr)]. Multiple zr values were selected from the top to the bottom of the ROI along the axial direction at 1-mm intervals, resulting in 25 different zr in a 25-mm-long ROI. The frequency range (fi) used for ACE was 4 – 6 MHz. The normalized power spectra ratio [Rsnor(fi, zk, zr)] at all fi, zk, and zr values were then passed to the LSM model for the final ACE shown in Eq. (9).
2). System Independency Phantom Study:
The proposed RFM was also tested on two tissue-mimicking phantoms calibrated using Fibroscan 502 Touch system (Echosens, Paris, France), whose accuracy was validated in simulation, tissue-mimicking phantoms and in-vivo livers as in [5]. Fibroscan acquisitions were performed using the M-probe(3.5 MHz) following regular acquisition procedures [33]. The median controlled attenuation parameters (CAP) measured from the two phantoms were: Phantom1 (cuboid shape, surface area: 6.5cm×18cm, depth: 18cm): 0.68 dB/cm/MHz (CAP = 238 dB/m), and Phantom2 (cuboid shape, surface area:6.5cm×18cm, depth: 18cm): 0.95 dB/cm/MHz (CAP = 332 dB/m), respectively, from ten repeated valid measurements (interquartile range/median <20%). To demonstrate that RFM is system-independent, in addition to the Vantage system tests, both phantoms were also imaged with a General Electric LOGIQ E9 (LE9) system (General Electric Healthcare, Wauwatosa, WI) with conventional line-by-line focused beam scanning and a linear array transducer 9L-D (2 – 8 MHz, General Electric Healthcare, Wauwatosa, WI). For the LE9 focused-beam imaging, 176 A-lines were beamformed with focal depth of 2.5 cm (f -number = 5). The imaging frame rate was 25 Hz. The center frequency of the transmit pulse was 5 MHz. Five repeated acquisitions were conducted on each phantom using each imaging system (Vantage-unfocused or LE9-focused).
For post-IQ processing, the lateral size of the ROI was 2.5-cm-wide and was positioned around the center of the image. Axially, the ROI was selected from 3 – 6 cm depth range to coincide with the post-focal zone of the focused beams using the LE9 system. This is because the focus beam pattern varies slowly in the post-focal zone, which reduces the diffraction differences between adjacent frequency components as assumed in Eq. (4). The frequency range used for ACE was 4 – 6 MHz. The rest of the IQ data post processing steps are the same as those in T-T calibration. In addition, detailed focusing effect on ACE was analyzed as functions of different depth ranges selected for ACE and different f -numbers during focused beam transmissions. The f -number testing was accomplished with the Vantage system and L11–4v probe since the f -number can be flexibly adjusted in Vantage rather than LE9. The focus was set at 2.5 cm with ROI ranged from 3 – 6 cm axially. All other parameters were the same as for Vantage-plane wave imaging configurations.
3). In-vivo Liver Attenuation Coefficient Estimation:
The proposed method was also tested on five patients going through clinically-indicated magnetic resonance imaging (MRI) of liver (all males; age: 53±17 years; body mass indices: 29±3.9 kg/m2). The study was approved by Institutional Review Board (IRB) of Mayo Clinic. A written informed consent was obtained at the time of enrollment of each participant. All patients underwent overnight fasting. Pro- ton density fat fraction (PDFF) acquired with MRI was used as reference standard. PDFF is a standardized and objective measure of mobile proton density proportion attributable to fat in the liver which has been shown to have high measurement accuracy in phantoms, human liver samples, and animal and human studies [34]. Thus, PDFF is considered as a reliable quantification metric of liver fat content and was often used as reference standard in literatures [35, 36]. The elevated fat content in the liver is also associated with increased ultrasound attenuation [2–5]. Therefore, the correlation between PDFF and ACE values was calculated to evaluate the performance of proposed ACE method. The PDFF was measured with MRI scanner GE Optima 450 (General Electric Healthcare, Wauwatosa, WI) using IDEAL IQ sequence. The in-vivo liver ACE was performed using unfocused plane wave compounding mode on the Verasonics Vantage system. The unfocused mode could avoid the focusing effects on ACE and ensure a more flexible ROI selection range. The focusing effects on the ACE accuracy will be shown in the result section (Section III-B). The Vantage system was equipped with a curved array transducer C1–6D (1 – 6 MHz, General Electric Healthcare, Wauwatosa, WI). The transmit center frequency was 3.5 MHz. Other parameter settings were identical to the ones used in the phantom studies (Section II-E2).
For the in-vivo liver study, an ROI with sizes of 3.5 cm ×4.5 cm laterally and axially, respectively, was selected around the most uniform area in the liver B-mode images. Large vascular structures were avoided in the ROI selection [2]. The frequency band used for ACE was 3.0 – 4.0 MHz.
III. Results
A. Through-transmission Phantom Measurements
The estimated attenuation coefficient values determined using the fabricated tissue-mimicking phantom with T-T calibration and the proposed RFM were 0.443±0.032 and 0.457±0.025 dB/cm/MHz, respectively. No significant difference (p=0.602) between these two groups of measurements was detected using two-tailed t test, with a significance level of 5%. The T-T calibration validates the accuracy of RFM.
B. System Independency Phantom Study
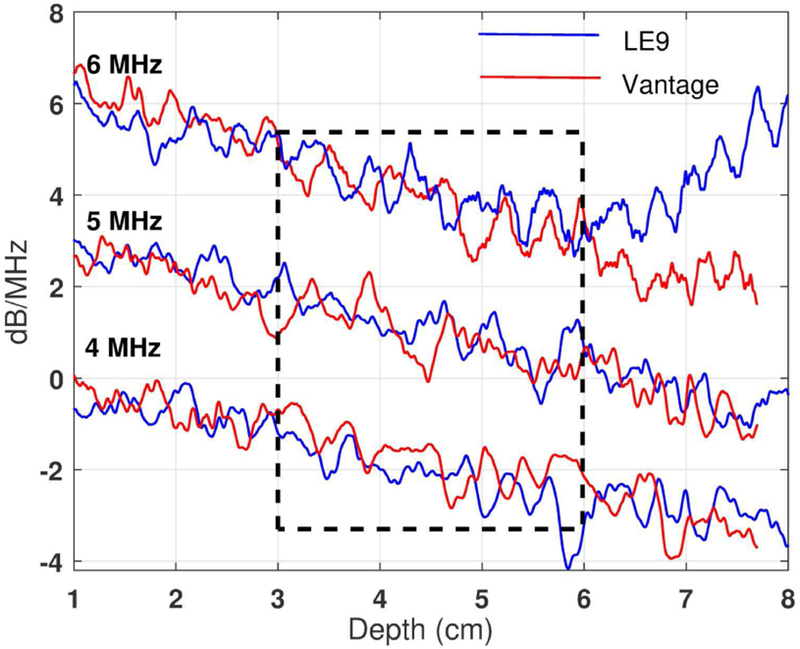
Figure 3 shows the frequency power spectra ratio decay curves after natural logarithm calculation using Phantom 1(0.68dB/cm/MHz calibrated attenuation coefficient) with both Vantage and LE9 systems. Three sample frequencies are shown: 4, 5, and 6 MHz. The decay curves obtained using different ultrasound systems and transmission modes are in good agreement at these three example frequencies.
Fig. 3.
Frequency power ratio decay curves after natural logarithm (i.e., ln[RS(fi, zk)]) as a function of depth acquired from a Fibroscan-calibrated phantom (0.68 dB/cm/MHz). The curves were acquired at 4, 5, and 6 MHz using Vantage-unfocused (central frequency: 5 MHz) and LE9-focused (central frequency: 5 MHz) systems, respectively. The frequency power ratio decay curves for 5 and 6 MHz were shifted upwards by 2 and 4 dB/MHz, respectively, for better visualization.
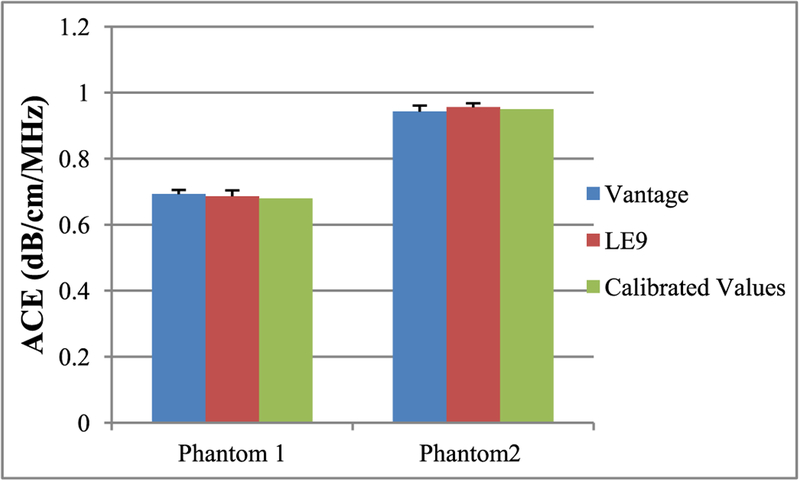
Tables I and II show the ACE values for the two Fibroscan-calibrated phantoms determined using Vantage and LE9 systems, respectively. The ACE values with and without constraints are both shown, which were consistent from both imaging systems. The values also agreed well with Fibroscan calibrations. The ACE values estimated without constraints showed slightly higher standard deviation than those estimated with constraints, demonstrating the effectiveness of the constraints. Figure 4 shows the bar plots of ACE with constraints on the two phantoms using the two imaging systems. No significant difference between these two groups of measurements was detected using two-tailed t test, with a significance level of 5%. This phantom study demonstrated the system independency of RFM—accurate ACE values can be obtained with different imaging configurations.
Table I.
ACE OF PHANTOM 1* (DB/cM/MHz)
| Trial | Vantage-Unfocused | LE9-Focused | ||
|---|---|---|---|---|
| With constraints |
Without constraints |
With constraints |
Without constraints |
|
| 1 | 0.68 | 0.68 | 0.68 | 0.69 |
| 2 | 0.71 | 0.72 | 0.67 | 0.70 |
| 3 | 0.69 | 0.69 | 0.69 | 0.72 |
| 4 | 0.68 | 0.68 | 0.71 | 0.68 |
| 5 | 0.69 | 0.73 | 0.67 | 0.64 |
| Mean | 0.69 | 0.70 | 0.68 | 0.69 |
| STD | 0.01 | 0.02 | 0.02 | 0.03 |
Fibroscan-calibrated value: a=0.68dB/cm/MHz. Two-tailed t-test between Vantage and LE9 measurements with constrains: p=0.59. Histogram generated constrains: Vantage system, [amin amax] =[0.46 0.98] dB/cm/MHz; GE system, [amin amax] =[0.50 0.90] dB/cm/MHz.
Table II.
ACE OF PHANTOM 2* (dB/CM/MHz)
| Trial | Vantage-Unfocused | LE9-Focused | ||
|---|---|---|---|---|
| With constraints |
Without constraints |
With constraints |
Without constraints |
|
| 1 | 0 95 | 0.95 | 0.95 | 0.94 |
| 2 | 0.92 | 0.91 | 0.96 | 0.95 |
| 3 | 0.94 | 0.95 | 0.97 | 0.97 |
| 4 | 0.96 | 0.96 | 0.94 | 0.93 |
| 5 | 0.96 | 0.96 | 0.96 | 0.95 |
| Mean | 0.95 | 0.95 | 0.96 | 0.95 |
| STD | 0.02 | 0.02 | 0.01 | 0.01 |
Fibroscan-calibrated value: a=0.95dB/cm/MHz. Two-tailed t-test between Vantage and LE9 measurements with constrains: p=0.23. Histogram generated constrains: Vantage system, [amin amax] =[0.60 1.20] dB/cm/MHz; GE system, [amin amax] =[0.58 1.20] dB/cm/MHz.
Fig. 4.
Bar plots of mean ACE values acquired from two Fibroscan-calibrated phantoms using Vantage and LE9 imaging systems. The error bars show the standard deviation from 5 repeated measurements.
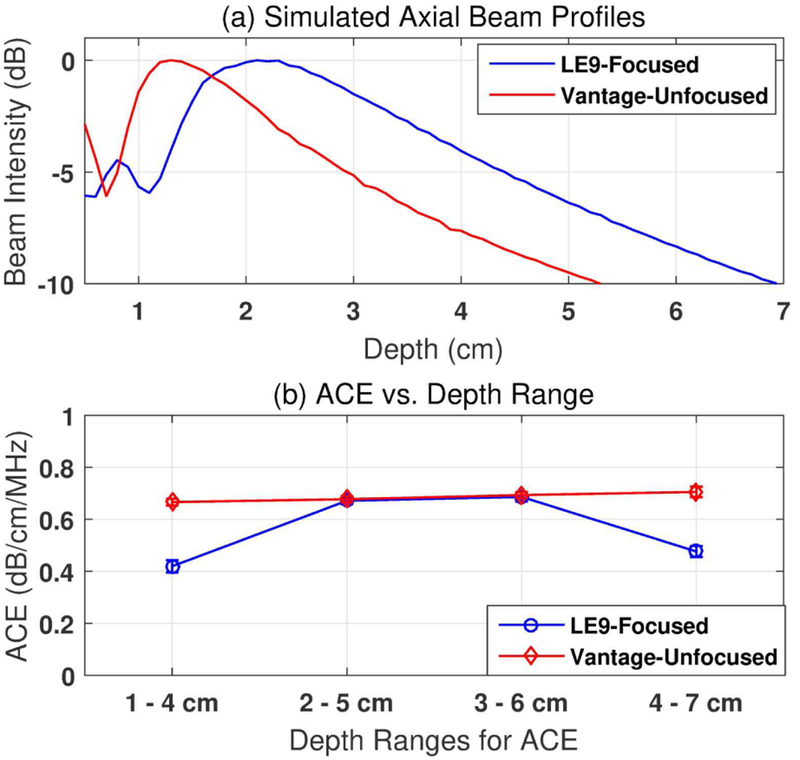
The RFM was based on the assumption that the differences of diffraction effects between two adjacent frequency components are negligible in the imaging regions where beam patterns change slowly as shown in Eq. (4). This assumption holds true in plane wave imaging and in the post-focal zone of focused beam imaging (with f -number = 5) as shown in phantom tests. For a more thorough investigation, the focusing effect of the proposed method was then studied for various depth ranges and f -numbers. Figure 5 (a)shows the axial beam profiles simulated in Field II [37, 38] following the same transducer geometries and the imaging conditions as in phantom studies. Figure 5(b) shows attenuation values measured from Phantom 1 with different depth ranges selected for ACE using both imaging systems. For Vantage-unfocused system, the beam pattern changes slowly after 1 cm depth. The assumption in Eq. (4) is valid and accurate attenuation estimations were obtained for a large imaging region (i.e., 1–7 cm). However, for LE9-focused system, the beam pattern changes more rapidly in the focal zone as compared to post-focal zone. When the ROI coincides with the beam focal zone (i.e., 1–4 cm, focusing at2.5 cm), the focusing effect could not be completely cancelled by calculating the power ratio between adjacent frequencies, leading to underestimation of the attenuation value. In deeper depth region (i.e., 4–7 cm), the drop of attenuation value was due to the low SNR and the resulting falsely elevated frequency power ratio at higher frequency components (e.g. 6 MHz acquired with LE9 as shown in Fig. 3). Despite these, accurate attenuations could be obtained in the post-focal zones with adequate SNR (i.e., 2–5 cm and 3–6 cm).
Fig. 5.
(a) Field II-Simulated axial beam profiles following the LE9 and Vantage imaging configurations. (b) Focusing effect on different ranges of depths used for attenuation estimation. The data were acquired from a Fibroscan-calibrated tissue-mimicking phantom with calibrated value of 0.68 dB/cm/MHz. The error bars show the standard deviation from 5 repeated measurements.
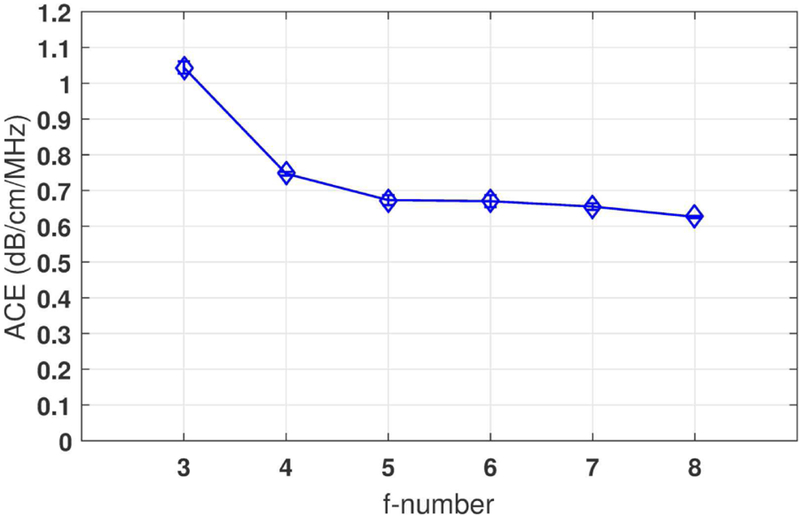
Figure 6 shows the ACE values measured from focused beam imaging with different f -numbers using Vantage system. When the beams are tightly focused (e.g., f -number = 3), the ACE value was overestimated in the post-focal zone. This is because the beam energy diverged fast in this region. The rapid decrease of the backscattered signal intensity led to an illusion of higher attenuation. When f -number was 4 or higher, valid measurements could be achieved in focused-beam imaging (less than 10% error as compared to calibrated value).
Fig. 6.
Focusing effect with different f -numbers. The data were acquired from a Fibroscan-calibrated tissue-mimicking phantom with calibrated value of 0.68 dB/cm/MHz. The phantom was imaged with focused beam imaging at 5 MHz center frequency using a Verasonics Vantage system. Focus: 2.5 cm depth; Depth range for ACE: 3–6 cm; The error bars show the standard deviation from 5 repeated measurements.
C. In-vivo Liver Attenuation Coefficient Estimation
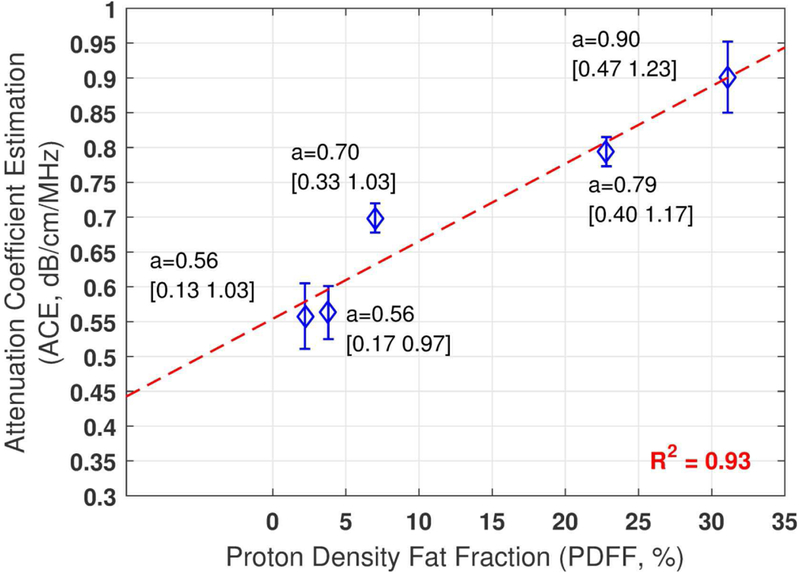
Figure 7 shows the mean ACE values estimated on each patient from three repeated measurements. The ACE estimations show good correlation with PDFF values (coefficient of determination, R2=0.93), further demonstrating the feasibility and potential of the method.
Fig. 7.
In-vivo human liver ACE from five patients and their correlation with proton density fat fraction. The mean attenuation values from three repeated estimations are shown for each patient with the histogram generated constraint values shown in the brackets. The error bars show the standard deviation.
IV. Discussion
This paper describes a new system-independent attenuation coefficient estimation technique, reference frequency method (RFM), which uses the power of the adjacent frequency as the reference to cancel system-dependent effects such as focusing, TGC, and diffraction. RFM does not require a reference phantom and can be applied to different transducer geometries (e.g., linear or curved arrays) and different beam patterns (e.g., plane wave or focused beams).
RFM presented accurate estimations in the through- transmission calibration and the Fibroscan-calibrated phantom studies. The combination of the least squares method with constraints could effectively suppress spatial variations of the spectra, leading to more robust and accurate attenuation coefficient estimations. However, the data-generated constraints require histograms of all estimated attenuation values which may increase the computation load of the method. In the in-vivo liver study, ACE values obtained with RFM showed good correlation with clinically-indicated PDFF values, further demonstrating the method’s feasibility. The signal-to-noise- ratio (SNR) is an important factor for robust attenuation coefficient estimation (ACE), especially for deeper imaging regions with higher imaging frequencies (as shown in Fig. 1). Extensive studies have been performed to improve the SNR of B-mode images, such as using multiple transmit beams [39], coded excitations [40] or multiplane wave imaging [41–43]. The robustness of the proposed RFM-ACE technique is expected to be further improved after combination with these SNR-improving techniques. The noise cancellation strategies as described in [9] can also be applied to suppress the noise influence on RFM-ACE analysis.
The RFM was based on the assumption that the differences of diffraction effects between two adjacent frequency components are negligible. This assumption was valid when the beam patterns changed slowly such as in plane wave imaging and the post-focal zone of loosely-focused beam imaging (f -number ≥ 4). However, for the regions where beam patterns changed rapidly, this assumption was violated and the method could not yield accurate estimations. In addition, performing ACE in the post-focal zone may limit the penetration of RFM in focused-beam imaging due to insufficient SNR as compared to focal-zone. Beam profile simulations or measurements may be needed, especially in imaging with tightly-focused beams, to cancel the beam diffraction effects more effectively for ACE.
The in-vivo ACE measurements in patients had larger variations (maximum STD/mean = 8.4%) than those in phantom studies. One possible reason may be because different liver sections were imaged in each trial and liver properties may vary in different acoustic windows. In addition, the in-vivo liver ACE was only performed with Vantage-unfocused system in this study to allow more flexible ROI locations. Future patient studies using focused beams will be conducted to investigate the performance of the proposed method for in- vivo application.
In this study, the entire ROI was assumed to have uniform attenuation coefficient. This method offers a robust solution to estimate mean attenuation coefficient of relatively uniform tissues such as liver. For heterogeneous tissues, however, the estimation accuracy may be compromised because the uniform assumption is violated. In addition, the least squares method with constraints averages out small oscillations of the frequency power ratio decay curves to stabilize attenuation coefficient estimations. Correspondingly, the method may not be sensitive enough to detect local attenuation variations in heterogeneous tissues.
The ROI size is usually a trade-off between reduced ACE variance and improved ACE spatial resolutions [29]. The ROI used in the study is relatively large because the normalization step of RFM relies on the power spectra ratio determined at reference depth zr. Multiple uncorrelated zr values (i.e., with at least one pulse-length interval) are needed to effectively average out spatial variations of ACE measurements. Future studies may focus on reducing the ROI size while retaining the estimation precision needed to apply RFM on heterogeneous tissues. Another limitation of this study is that we did not systematically compare the performance of the proposed method with those of other ACE methods (e.g., spectra shift method and reference phantom-based methods) under the same conditions. Future study may be needed in this area. It would be also interesting to test the accuracy of different methods as functions of focusing effect, ROI size, SNR level, speed of sound, and phantom selection (homogeneous or inhomogeneous) [23, 44].
In this study, the attenuation frequency dependency was assumed to be linear [as shown in Eq. (2)]:
| (13) |
For a more general model, tissue attenuation can be written in the nonlinear form as na ≠ 1. Modifying RFM to adapt to nonlinear models will be the subject of future studies.
V. Conclusion
In this paper, we proposed a reference frequency method (RFM) to enable system-independent and reference-phantom-free attenuation coefficient estimation for biological tissues. RFM uses the adjacent frequency components of the ultrasound signal to cancel system effects such as focusing and TGC. When combined with least squares method, RFM demonstrated accurate ACE estimations in phantoms and in in-vivo livers. The proposed RFM can be potentially applied to various ultrasound imaging systems with different transducers and imaging configurations.
Acknowledgment
The authors are grateful to R. R. Kinnick for his valuable help performing the phantom study. The study is supported in part by funding from National Institute of Diabetes and Digestive and Kidney Diseases of the National Institutes of Health under Award Number R01DK106957. The content is solely the responsibility of the authors and does not necessarily represent the official views of the National Institutes of Health.
Biographies

Ping Gong received B.Sc degree from Tianjin University, China, majoring Biomedical Engineering in 2010. She completed her M.Sc. degree in the Department of Electrical and Computer Engineering at Lakehead University, Canada in 2012 and Ph.D. in Biomedical Physics, Ryerson University in 2016. She is now with the Department of Radiology, Mayo Clinic College of Medicine, Rochester, Minnesota, USA. Her research focuses on developing ultra- sound transmission and beamforming algorithms to improve ultrasound image quality.

Pengfei Song (IEEE/S’09/M’14) was born in Weihai, China, on April 16, 1986. He received the B.Eng. degree in Biomedical Engineering from the Huazhong University of Science and Technology, Wuhan, China, in 2008; the M.S. degree in Bio-logical Systems Engineering from the University of Nebraska-Lincoln, Lincoln, NE, in 2010; and the Ph.D. degree in Biomedical Sciences-Biomedical Engineering from the Mayo Graduate School, Mayo Clinic College of Medicine, Rochester, MN, in 2014. He is currently an Assistant Professor in the Department of Radiology, Mayo Clinic College of Medicine, Rochester, MN. His current research interests are ultrasound microvessel imaging and ultrasound shear wave elastography. Dr. Song is a member of IEEE, AIUM, and SigmaXi.

Chengwu Huang was born in Guangdong, China in 1989. He received the B.S. degree in biomedical engineering from Beihang University, Beijing, China, in 2012, and the Ph.D. degree from the Department of Biomedical Engineering at Tsinghua University, Beijing, China, in 2017. He is now with the Department of Radiology, Mayo Clinic College of Medicine, Rochester, Minnesota, USA. His current research interests include ultrasound microvessel imaging and ultrasound elastogrpahy.

Joshua Trzasko (IEEE/M’99/SM’2014) received the B.S. degree in Electrical and Computer Engineering in 2003 from Cornell University and the Ph.D. degree in Biomedical Engineering from Mayo Graduate School in 2009. He is currently an Associate Consultant in the Division of Medical Physics and Assistant Professor of Radiology and Biomedical Engineering at Mayo Clinic. Dr. Trzasko’s research focuses on the development and application of statistical signal processing methods for medical imaging, including: quantitative imaging, artifact correction, and limited data reconstruction in magnetic resonance imaging (MRI); radiation dose reduction in x-ray computed tomography (CT); and ultrasound (US) microvasculature imaging.

Shigao Chen (IEEE/M’02) received the B.S. and M.S. degrees in biomedical engineering from Tsinghua University, China, in 1995 and 1997, respectively, and the Ph.D. degree in biomedical imaging from the Mayo Graduate School, Rochester, MN, in 2002. He is currently an Associate Professor of the Mayo Clinic College of Medicine. His research interest is noninvasive quantification of the viscoelastic properties of soft tissue using ultrasound, and ultrasound microvessel imaging.
References
- [1].d’Astous F and Foster F, “Frequency dependence of ultrasound attenua- tion and backscatter in breast tissue,” Ultrasound in medicine & biology, vol. 12, no. 10, pp. 795–808, 1986. [DOI] [PubMed] [Google Scholar]
- [2].Taylor KJW et al. , “Quantitative US Attenuation in Normal Liver and IN Patients with Diffuse Liver-Disease - Importance of Fat,” Radiology, vol. 160, no. 1, pp. 65–71, July 1986. [DOI] [PubMed] [Google Scholar]
- [3].Lin T, Ophir J, and Potter G, “Correlation of Ultrasound-Attenuation with Pathologic Fat and Fibrosis in Liver-Disease,” Ultrasonic Imaging, vol. 10, no. 1, pp. 59–59, January 1988. [DOI] [PubMed] [Google Scholar]
- [4].Lu ZF, Zagzebski JA, and Lee FT, “Ultrasound backscatter and attenuation in human liver with diffuse disease,” Ultrasound in Medicine and Biology, vol. 25, no. 7, pp. 1047–1054, September 1999. [DOI] [PubMed] [Google Scholar]
- [5].Sasso M et al. , “Controlled Attenuation Parameter (CAP): A Novel VCTE (TM) Guided Ultrasonic Attenuation Measurement for the Evaluation of Hepatic Steatosis: Preliminary Study and Validation in a Cohort of Patients with Chronic Liver Disease From Various Causes,” Ultrasound in Medicine and Biology, vol. 36, no. 11, pp. 1825–1835, November 2010. [DOI] [PubMed] [Google Scholar]
- [6].Landini L, Sarnelli R, and Squartini F, “Frequency-dependent attenuation in breast tissue characterization,” Ultrasound in Medicine and Biology, vol. 11, no. 4, pp. 599–603, 1985. [DOI] [PubMed] [Google Scholar]
- [7].Farrell GC, George J, Hall P. d. l. M., and McCullough AJ, Fatty liver disease: NASH and related disorders. John Wiley & Sons, 2008. [Google Scholar]
- [8].Gaitini D et al. , “Feasibility study of ultrasonic fatty liver biopsy: texture vs. attenuation and backscatter,” Ultrasound in medicine & biology, vol. 30, no. 10, pp. 1321–1327, 2004. [DOI] [PubMed] [Google Scholar]
- [9].Kanayama Y, Kamiyama N, Maruyama K, and Sumino Y, “Real-time ultrasound attenuation imaging of diffuse fatty liver disease,” Ultrasound in medicine & biology, vol. 39, no. 4, pp. 692–705, 2013. [DOI] [PubMed] [Google Scholar]
- [10].Yao LX, Zagzebski JA, and Madsen EL, “Backscatter Coefficient Measurements Using a Reference Phantom to Extract Depth-Dependent Instrumentation Factors,” Ultrasonic Imaging, vol. 12, no. 1, pp. 58–70, 1990. [DOI] [PubMed] [Google Scholar]
- [11].Boote EJ, Zagzebski JA, and Madsen EL, “Backscatter coefficient imaging using a clinical scanner,” Medical physics, vol. 19, no. 5, pp. 1145–1152, 1992. [DOI] [PubMed] [Google Scholar]
- [12].Oelze ML and Mamou J, “Review of Quantitative Ultrasound: Envelope Statistics and Backscatter Coefficient Imaging and Contributions to Diagnostic Ultrasound,” IEEE Transactions on Ultrasonics Ferroelectrics and Frequency Control, vol. 63, no. 2, pp. 336–351, February 2016. [DOI] [PMC free article] [PubMed] [Google Scholar]
- [13].Kuc R and Li H, Reduced-order Autoregeressive Modeling for Center- frequency Estimation,” Ultrasonic Imaging, vol. 7, no. 3, pp. 244–251, July 1985. [DOI] [PubMed] [Google Scholar]
- [14].Samimi K and Varghese T, “Performance Evaluation of the Spectral Centroid Downshift Method for Attenuation Estimation,” IEEE Trans- actions on Ultrasonics Ferroelectrics and Frequency Control, Article vol. 62, no. 5, pp. 871–880, May 2015. [DOI] [PMC free article] [PubMed] [Google Scholar]
- [15].Bigelow TA, McFarlin BL, O’Brien WD, and Oelze ML, “In vivo ultrasonic attenuation slope estimates for detecting cervical ripening in rats: Preliminary results,” Journal of the Acoustical Society of America, Article vol. 123, no. 3, pp. 1794–1800, March 2008. [DOI] [PMC free article] [PubMed] [Google Scholar]
- [16].Coila AL and Lavarello R, “Regularized spectral log difference technique for ultrasonic attenuation imaging,” IEEE transactions on ultrasonics, ferroelectrics, and frequency control, vol. 65, no. 3, pp. 378–389, 2018. [DOI] [PubMed] [Google Scholar]
- [17].Parker KJ, Lerner RM, and Waag RC, “Comparison of techniques for in vivo attenuation measurements,” IEEE Transactions on Biomedical engineering, vol. 35, no. 12, pp. 1064–1068, 1988. [DOI] [PubMed] [Google Scholar]
- [18].Parker KJ and Waag RC, “Measurement of ultrasonic attenuation within regions selected from B-scan images,” IEEE transactions on biomedical engineering, no. 8, pp. 431–437, 1983. [DOI] [PubMed] [Google Scholar]
- [19].Kuc R and Schwartz M, “Estimating the acoustic attenuation coefficient slope for liver from reflected ultrasound signals,” IEEE Transactions on Sonics and Ultrasonics, vol. 26, no. 5, pp. 353–361, 1979. [Google Scholar]
- [20].Kuc R, “Clinical application of an ultrasound attenuation coefficient estimation technique for liver pathology characterization,” IEEE Trans- actions on Biomedical Engineering, no. 6, pp. 312–319, 1980. [DOI] [PubMed] [Google Scholar]
- [21].Kim H and Varghese T, “Hybrid Spectral Domain Method for Atteuation Slope Estimation,” Ultrasound in Medicine and Biology, vol. 34, no. 11, pp. 1808–1819, November 2008. [DOI] [PubMed] [Google Scholar]
- [22].Samimi K and Varghese T, “Optimum Diffraction-Corrected Frequency-Shift Estimator of the Ultrasonic Attenuation Coefficient,” IEEE Transactions on Ultrasonics Ferroelectrics and Frequency Control, Article vol. 63, no. 5, pp. 691–702, May 2016. [DOI] [PMC free article] [PubMed] [Google Scholar]
- [23].Labyed Y and Bigelow TA, “A theoretical comparison of attenuation measurement techniques from backscattered ultrasound echoes,” The Journal of the Acoustical Society of America, vol. 129, no. 4, pp. 2316–2324, 2011. [DOI] [PMC free article] [PubMed] [Google Scholar]
- [24].Vajihi Z, Rosado-Mendez IM, Hall TJ, and Rivaz H, “Low Variance Estimation of Backscatter Quantitative Ultrasound Parameters Using Dynamic Programming,” IEEE Transactions on Ultrasonics Ferroelectrics and Frequency Control, vol. 65, no. 11, pp. 2042–2053, November 2018. [DOI] [PMC free article] [PubMed] [Google Scholar]
- [25].Han AG, Andre MP, Erdman JW, Loomba R, Sirlin CB, and O’Brien WD, “Repeatability and Reproducibility of a Clinically Based QUS Phantom Study and Methodologies,” IEEE Transactions on Ultrasonics Ferroelectrics and Frequency Control, vol. 64, no. 1, pp. 218–231, January 2017. [DOI] [PMC free article] [PubMed] [Google Scholar]
- [26].Nam K, Zagzebski JA, and Hally TJ, “Simultaneous Backscatter and Estimation Using a Least Squares Method with Constraints,” Ultrasound in Medicine and Biology, vol. 37, no. 12, pp. 2096–2104, December 2011. [DOI] [PMC free article] [PubMed] [Google Scholar]
- [27].Miller SJ, “The method of least squares,” Mathematics Department Brown University, pp. 1–7, 2006. [Google Scholar]
- [28].Zwiggelaar R, Roscoe JF, and Dee H, “Coping with Noise in Ultrasound Images: A review,” 2012. Available online: http://miua2012.swansea.ac.uk/uploads/Site/Programme/PSA05.pdf
- [29].Oelze ML and O’Brien WD Jr, “Defining optimal axial and lateral resolution for estimating scatterer properties from volumes using ultra- sound backscatter,” The Journal of the Acoustical Society of America, vol. 115, no. 6, pp. 3226–3234, 2004. [DOI] [PubMed] [Google Scholar]
- [30].Combettes PL and Pesquet J-C, “Proximal splitting methods in signal processing,” in Fixed-point algorithms for inverse problems in science and engineering: Springer, 2011, pp. 185–212. [Google Scholar]
- [31].Farrer AI et al. , “Characterization and evaluation of tissue-mimicking gelatin phantoms for use with MRgFUS,” Journal of Therapeutic Ultrasound, vol. 3, p. 9, 06/16 [DOI] [PMC free article] [PubMed] [Google Scholar]
- [32].Welch P, “The use of fast Fourier transform for the estimation of power spectra: A method based on time averaging over short, modified periodograms,” IEEE Transactions on Audio and Electroacoustics, vol. 15, no. 2, pp. 70–73, 1967. [Google Scholar]
- [33].De Ledinghen V and Vergniol J, “Transient elastography (fibroscan),” Gastroenterologie clinique et biologique, vol. 32, no. 6, pp. 58–67, 2008. [DOI] [PubMed] [Google Scholar]
- [34].Kinner S, Reeder SB, and Yokoo T, “Quantitative Imaging Biomarkers of NAFLD,” Digestive Diseases and Sciences, vol. 61, no. 5, pp. 1337–1347, May 2016. [DOI] [PMC free article] [PubMed] [Google Scholar]
- [35].Imbault M et al. , “Ultrasonic fat fraction quantification using in vivo adaptive sound speed estimation,” Physics in Medicine and Biology, vol. 63, no. 21, November 2018. [DOI] [PubMed] [Google Scholar]
- [36].Tada T et al. , “Utility of Attenuation Coefficient Measurement Using an Ultrasound-Guided Attenuation Parameter for Evaluation of Hepatic Steatosis: Comparison With MRI-Determined Proton Density Fat Fraction,” American Journal of Roentgenology, vol. 212, no. 2, pp. 332–341, 2019. [DOI] [PubMed] [Google Scholar]
- [37].Jensen JA, “Field: A program for simulating ultrasound systems,” Med. Biol. Eng. Comput, vol. 34, pp. 351–353, 1996.8945858 [Google Scholar]
- [38].Jensen JA and Svendsen NB, “Calculation of pressure fields from arbitrarily shaped, apodized, and excited ultrasound transducers,” Ultrasonics, Ferroelectrics and Frequency Control, IEEE Transactions on, vol. 39, no. 2, p. 262, 1992. [DOI] [PubMed] [Google Scholar]
- [39].Tong L, Ramalli A, Jasaityte R, Tortoli P, and D’Hooge J, “Multi- Transmit Beam Forming for Fast Cardiac Imaging-Experimental Validation and In Vivo Application,” IEEE Transactions on Medical Imaging, vol. 33, no. 6, pp. 1205–1219, June 2014. [DOI] [PubMed] [Google Scholar]
- [40].Song P, Urban MW, Manduca A, Greenleaf JF, and Chen S, “Coded Excitation Plane Wave Imaging for Shear Wave Motion Detection,” IEEE Transactions on Ultrasonics Ferroelectrics and Frequency Control, vol. 62, no. 7, pp. 1356–1372, July 2015. [DOI] [PMC free article] [PubMed] [Google Scholar]
- [41].Tiran E et al. , “Multiplane wave imaging increases signal-to-noise ratio in ultrafast ultrasound imaging,” Physics in Medicine and Biology, Article vol. 60, no. 21, pp. 8549–8566, November 2015. [DOI] [PubMed] [Google Scholar]
- [42].Gong P, Song P, and Chen S, “Ultrafast Synthetic Transmit Aperture Imaging Using Hadamard-Encoded Virtual Sources With Overlapping Sub-Apertures,” IEEE Trans Med Imaging, vol. 36, no. 6, pp. 1372– 1381, June 2017. [DOI] [PubMed] [Google Scholar]
- [43].Gong P, Song P, and Chen S, “Delay-Encoded Harmonic Imaging (DE- HI) in Multiplane-Wave Compounding,” IEEE Trans Med Imaging, vol. 36, no. 4, pp. 952–959, April 2017. [DOI] [PubMed] [Google Scholar]
- [44].Omari EA and Varghese T, “Signal to noise ratio comparisons for ultrasound attenuation slope estimation algorithms,” Medical physics, vol. 41, no. 3, 2014. [DOI] [PMC free article] [PubMed] [Google Scholar]


