Abstract
Background
In the current meta-analysis, we aimed to systematically review and summarize the eligible studies evaluating the association between dietary acid load in terms of potential renal acid load (PRAL) and net-endogenous acid production (NEAP) with anthropometric parameters and serum lipids in adult population.
Methods
In a systematic search from PubMed, Scopus, Web of Sciences and Cochrane electronic databases up to December 2018, relevant studies were included. Cross-sectional, case control or cohort studies evaluating the association between PRAL and NEAP with the mean values of body mass index (BMI), waist circumference (WC), low and high density lipoprotein cholesterol (LDL, HDL), triglyceride (TG), total cholesterol (TC) and the prevalence of obesity were included.
Results
According to our results, having higher dietary acid load content in terms of high PRAL scores was associated with higher triglyceride concentrations (weighted mean difference (WMD): 3.468; confidence interval (CI): -0.231, 7.166, P = 0.04) and higher obesity prevalence (30% and 27% in highest versus lowest categories). Accordingly, being in the highest category of NEAP was associated with higher prevalence of obesity (25% and 22% in highest versus lowest category). In subgroup analysis, higher PRAL scores was associated with higher BMI in women (WMD: 0.122; CI: -0.001, 0.245; P = 0.049) and higher NEAP in men (WMD: 0.890; CI: 0.430, 1.350; P < 0.001). There was no association between dietary acid load and other studied parameters.
Conclusions
In the current meta-analysis, high dietary acid load content was associated with higher serum triglyceride concentrations and higher obesity prevalence. Reducing dietary acid load content might be a useful preventive strategy against obesity and metabolic disorders.
Introduction
Overweight and obesity, defined as abnormal or excessive fat accumulation in the body, is a major growing epidemic health problem; according to the world health organization report, since 1975, the worldwide obesity has nearly tripled and in 2016, more than 1.9 billion and over 650 million of adults were overweight and obese comprising 39% and 13% respectively [1]. It has been estimated that the direct costs of obesity accounted for 6.8%. (or US$ 70 billion) of total health care—related costs; moreover, huge indirect costs including losing workdays, disabilities, physician visits, and premature mortality alongside with intangible costs including reduced quality of life and impaired mental health because of weight dissatisfaction should also be addressed [2]. Increased prevalence of obesity consequently leads to increased rates of diabetes, metabolic syndrome, cardiovascular events and numerous other chronic obesity-related disease further highlights the importance of preventive strategies. Among them, modifying nutrition and diet-related behaviors must be one of the most effective strategies [3]. Recently, the role of diet- related low-level metabolic acidosis in the pathogenesis of metabolic disorders including metabolic syndrome, diabetes and CVDs has been suggested by numerous researches highlighting the triggering effects of Western dietary pattern [4–7]. Obesity is associated with impaired acid-base balance; obesity lead to higher urinary calcium excretion and reduced urinary pH [8]. It has also been suggested that hydrogen ion accumulation due to acidogenic diets is associated with increased weight gain and obesity and that possibly meat and western diet is a cause of increased organic acid production and fatty acid oxidation in obese individuals; a condition which might be reversed in higher vegetables and fruits consumption [9]. High acidogenic contents of foods including meat, fish, cheese and lower alkaline content of diet including fruits and vegetables are the potential cause of endogenous acid production and elevated dietary acid load [10]. In fact, diet is responsible for more than 10-fold difference in endogenous acid production in different individuals [4]. The diet-induced acid load is estimated according to potential renal acid load (PRAL) and net-endogenous acid production (NEAP) according to information about ingested protein, potassium, calcium, phosphorous and magnesium [11]. The PRAL calculation is based on the formula first suggested by Remer et al [12] as follows: PRAL (mEq/d) = 0.4888 × protein intake (g/day) + 0.0366 × phosphorus (mg/day) -0.0205 × potassium (mg/ day) -0.0125 × calcium (mg/day) - 0.0263 × magnesium (mg/day). While NEAP is calculated based on the Frassetto et al suggested formula [13] as: Estimated NEAP (mEq/d) = [54.5 × protein intake (g/day) ÷ potassium intake (mEq/day)] - 10.2. These estimates are validated according to the estimated equivalents in the 24 hours urine measurement [12, 13]. Numerous studies are available reporting the association between metabolic risk factors with dietary acid load as either PRAL or NEAP or both of them [7, 11, 14–19]. The results of these studies are inconsistence; several reporting the positive association between metabolic risk factors [5, 6, 20] while others not [4, 21]. According to our literature review, only one meta-analysis was carried out evaluating the association between dietary acid load and risk of type two diabetes [22]. While no study is available summarizing the association between dietary acid load either as PRAL or NEAP with obesity indices, prevalence and serum lipids status. Therefore, in the current meta-analysis we summarize the results of studies evaluated the association between PRAL of NEAP with general or central obesity indices (e.g. BMI, WC, WHR), obesity prevalence, serum lipids including TG, TC, LDL, HDL in an updated systematic review and meta-analysis.
Methods
Search strategy
We performed a systematic search using PubMed, Scopus, Web of Sciences and Cochrane electronic databases to the studies evaluated the association between dietary acid load and general or central obesity, serum lipids and metabolic syndrome up to December 2018. No language restriction was applied. Moreover, hand-searching from reference lists of all relevant papers, previous reviews and meta-analyses was performed to cover all relevant publications. Strategy search was created using a combination of the MeSH (Medical Subject Headings) terms from the PubMed database and free text words were used. For each electronic database, search strategy was adopted. The PICO (patients, intervention, comparator and outcome) for studies’ selection is presented in Table 1. We used PICO model because it is one of the most widely used models for formulating clinical questions. The PICO model is one of the frequently used tools for structuring clinical research questions in connection with evidence syntheses. The Cochrane Handbook for Systematic Reviews of Interventions specifies using PICO as a model for developing a review question, thus ensuring that the relevant components of the question are well defined [23, 24].
Table 1. The PICO criteria used for the present systematic review.
| PICO criteria | Description |
|---|---|
| Participants | General adult population |
| Exposure (Interventions) | Highest category of dietary acid load represented by higher scores of PRAL or NEAP |
| Comparisons | Lowest category of dietary acid load represented by higher scores of PRAL or NEAP |
| Outcome | BMI, WC, TG, LDL, TC, HDL, obesity prevalence |
| Study design | Observational studies with the design of cross-sectional, case control or cohort |
Selection and characteristics of the included studies
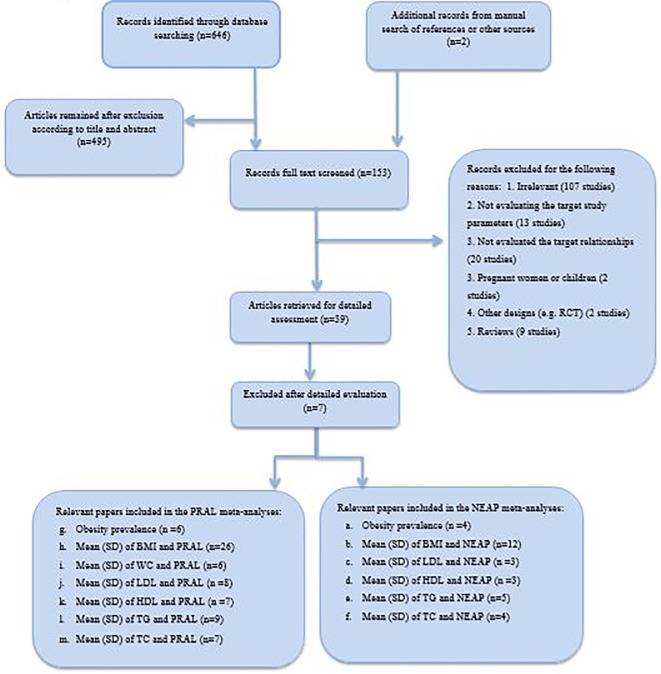
Our search obtained 646 potentially relevant articles from PubMed, Scopus, Cochrane and Google Scholar electronic databases. Thereafter 153 manuscripts were remained for full text screening after duplicate remove and exclusion after title and abstract reading. Totally, 121 manuscripts were excluded because of their irrelevant subject, inappropriate design, being reviews including meta-analysis or systematic reviews, conferences and seminars, not relevant age groups, not evaluating the association of studied parameters (dietary acid load, obesity, lipids and metabolic syndrome) or not measuring the routine dietary acid load. Accordingly 32 manuscripts were included in the systematic review. The Flow diagram of study screening and selection process is presented in Fig 1.
Fig 1. Flow diagram of study screening and selection process.
Inclusion criteria
In the current systematic review and meta-analysis, observational studies with the design of cross-sectional, case control or cohort evaluating the association between dietary acid load and BMI, WC, WHR, obesity, central obesity, lipid profile and metabolic syndrome were included. According to our set of parameters, we conducted numerous meta-analyses. Dietary acid load-obesity or metabolic syndrome meta-analysis included the studies evaluated the odds ratio (OR), relative risk (RR) or prevalence of obesity or metabolic syndrome in the lowest versus highest dietary acid load categories. Accordingly, in dietary acid load–body mass index, dietary acid load–waist circumference or dietary acid load—serum lipids meta-analyses, the study must have reported the mean ± SD of body mass index or waist circumference or waist to hip ratio or serum lipids including triglyceride, cholesterol, low-density lipoprotein cholesterol, high density lipoprotein cholesterol in subjects in the highest versus lowest dietary acid load category as the reference group. For the search purpose, we used MESH (Medical Subject Heading) and non-MESH keywords including the following: (“dietary acid load” OR “dietary acid-based load”) AND (“body mass index” OR “BMI” OR “obesity” OR “central obesity” OR “serum lipids” OR “lipid profile” OR “triglyceride” OR “cholesterol” OR “LDL-cholesterol “low density lipoprotein cholesterol” OR “HDL” OR “high density lipoprotein cholesterol” OR “hypertension” OR “cardiovascular risk factors” OR “cardiometabolic risk factors” OR “metabolic syndrome” OR “diabetes”. The reviewed literatures were inserted into the EndNote software (version X8, for Windows, Thomson Reuters, Philadelphia, PA, USA). Consequently retrieved citations were merged, duplications were eliminated and the review process has been facilitated. Accordingly, titles and abstracts of all articles had been evaluated independently by three reviewers (MAF, LN, ZN). Articles not meeting the eligibility criteria were excluded. Moreover, the reference lists of relevant review article were also evaluated to include additional studies. Full-texts of relevant articles were retrieved if meeting the eligibility criteria, and wee re-evaluated. Any disagreements were discussed and resolved by consensus.
Quality assessment
The methodological quality assessment of the included papers was performed by a nine-star Newcastle-Ottawa scale (NOS) for quality assessment of the cross-sectional, case-control and cohort studies. The 9-point NOS scale has scoring ranges from 0 to nine and is categorized into selection, comparability, and ascertaining of outcome. Studies with equal or more than 7 stars were categorized as high quality [25].
Data collection and extraction
Data were collected according to a standard data extraction form gathering the information about the study characteristics including information about authors name, publication year, geographical area, study design; information about the population including participants age range, mean age of case and control group, number of case and controls, dietary assessment tool, setting, gender and the sample size and information about the adjusting for possible confounders the main findings and estimates of associations.
Data synthesis and analysis
In the current meta-analysis, three meta-analysis approaches were used: the association between odds of obesity or metabolic syndrome and dietary acid load markers was analyzed by estimating the ORs and 95% confidence intervals by calculating the Ln of ORs and its standard error of mean (s.e.) as the effect size of the meta-analysis. Pooled OR [and 95% confidence interval (CI)] was estimated using a weighted random-effect model (the DerSimonian-Laird approach).
The comparison of the continuous variables including BMI, WC, WHR, TG, TC, LDL, HDL between highest versus lowest category of dietary acid load as reference group was performed by measuring the unstandardized mean differences as the effect size calculated by pooled estimate of weighted mean difference (WMD) with 95% confidence interval (CI), and the fixed effects and random effects models.
The prevalence of obesity in highest versus lowest dietary acid load categories was performed by re-calculating the proportions of interest from the relevant numerator and denominator. The overall proportions of interest were derived using meta-analysis techniques by metaprop command in the STATA and presented along with 95% confidence intervals (95% CI) calculated using a normal approximation. Cochran's Q test and I squared test was used to identify between-study heterogeneity; I2 < 25%, no heterogeneity; I2 = 25–50%, moderate heterogeneity; I2 > 50% large heterogeneity [26]. The heterogeneity was considered significant if either the Q statistic had p < 0.1 or I2 > 50%. Sensitivity analysis was used to explore the extent to which inferences might depend on a particular study or a number of publications. Subgroup analysis was performed to identify possible sources of heterogeneity, if required. Begg’s funnel plots was assessed to evaluate the publication bias followed by the Egger's regression asymmetry test and Begg's adjusted rank correlation for formal statistical assessment of funnel plot asymmetry. The data were analyzed using STATA version 13 (STATA Corp, College Station, TX, USA), and P-values less than 0.05 were considered as statistically significant.
Results
Description of the studies reported the dietary acid load as PRAL and NEAP with general and central obesity associations
From all of the systematically reviewed relevant papers (Table 2), totally 29 studies reported the association between PRAL and NEAP with obesity indices including BMI, WC, or the prevalence of general and central obesity [4–7, 11, 14–20, 27–43]. Twelve studies reported higher BMI or WC or the prevalence of general or central obesity in highest versus lowest category of dietary acid load indices [4, 14, 20, 27–29, 31, 32, 35, 37]. Examining the associations between diet-induced metabolic acidosis and cardio-metabolic risk factors among 27809 men and 36851 women of 45–75 years old, Akter S [20] reported higher BMI values in highest versus lowest PRAL quartiles among women (P <0.001) while among men an inverse relation between BMI trend among PRAL quartiles was reported. Other study by Kiefte-de Jong JC examining the association between energy-adjusted NEAP, PRAL and incident type 2 diabetes among 67433 women from the Nurses’ Health Study (NHS), 84310 women from the Nurses’ Health Study II (NHS- II) and 35743 men from the Health Professionals’ Follow-up Study (HPFS), reported higher BMI values in the top quintile versus low quintile of NEAP in baseline analysis of all three cohorts [32]. In other study by Kucharska AM et al [35], BMI, WC and the prevalence of overweight or obesity in highest NEAP tertile were higher than the lowest (P and P trend < 0.05). While in PRAL categories, among men, no significant difference in the BMI and WC in the lowest versus highest PRAL tertiles was observed. The prevalence of overweight or obesity in the highest tertile of PRAL was lower than the lowest. Among women, BMI and WC and the prevalence of overweight or obesity in the highest tertile of PRAL were lower than the lowest. Murakami K [37] reported higher WC in highest quintile of PRAL among Japanese adults while no significant difference in BMI was reported. Totally, the unfavorable result of the higher BMI in lowest category of PRAL or NEAP was reported in three studies [11, 20, 35]. Other fifteen studies reported no association between dietary acid load and general or central obesity indices [5–7, 15, 17–19, 30, 33, 35, 36, 39–43].
Table 2. Characteristics of studies included in the systematic review owing to reporting the association between dietary acid load with general and central obesity indices and the prevalence of obesity.
| First author | Year | Country | Study design | Sex | Age range | Sample size / Population | Number of cases / controls | Dietary assessment/index | Result | Adjusted variables | Quality of the study |
|---|---|---|---|---|---|---|---|---|---|---|---|
| Akter S [5] | 2014 | Japan | Cross-sectional | Both | 18–70 y | 2028/ working population | 676/ 676 | BDHQ/ PRAL, NEAP | No difference was found between BMI and PRAL or NEAP tertiles. | Age, sex | 8 |
| Akter S [6] | 2016 | Japan | Cross-sectional | Both | 19–69 y | 1732 | 433/433 | BDHQ/ PRAL | No significant difference between BMI in different quartiles of PRAL. | - | 6 |
| Akter S [20] | 2015 | Japan | Cross-sectional | Men | 45–75 y | 27808 | 6952/6952 | 147-item FFQ /PRAL | BMI in lowest quartile of PRAL was higher than the highest (P = 0.01) | - | 6 |
| Akter S [20] | 2015 | Japan | Cross-sectional | Women | 45–75 y | 36851 | 9213/9213 | 147-item FFQ/PRAL | BMI in the highest quartile of the PRAL was higher than the lowest (P < 0.001) | - | 6 |
| Akter S [25] | 2017 | Japan | Cross-sectional | Both | 45–75 y | 92478 | 23119/23120 | 147-item FFQ/ PRAL | BMI in the highest quartiles of PRAL was significantly higher than the lowest (P <0.001) | - | 6 |
| Amodu A [4] | 2013 | USA | Cross-sectional | Both | ≥ 20 y | 13274 | 2490/2477 | 24-hour dietary recall questionnaire/NEAP | The prevalence of obesity in highest quartile of NEAP was significantly higher than the lowest (35.9 vs 24.8 P <0.001) | - | 7 |
| Bahadoran Z [26] | 2015 | Iran | Cross-sectional | Both | 19–70 y | 5620 | 1405/1405 | 147-item FFQ/ PRAL | BMI and WC and the prevalence of abdominal obesity in the highest quartile of PRAL was significantly higher than the lowest. | - | 6 |
| Banerjee T [27] | 2018 | USA | Cross-sectional | Both | 21–84 y | 3257 | 1074/1075 | FFQ/ PRAL | BMI in the highest tertile of PRAL was significantly higher than the lowest (P = 0.0002) | - | 7 |
| Chan R [28] | 2015 | China | Cross-sectional | Both | ≥ 65y | 3122 | 780/779 | FFQ/NEAP | No significant difference in the BMI in different quartiles of NEAP was reported. | - | 7 |
| Engberink MF [29] | 2012 | Netherland | Cross-sectional | Both | ≥ 55 y | 2241 | 747/747 | FFQ/ PRAL | Mean BMI and the prevalence of overweight or obesity was higher in the highest versus lowest PRAL tertile. | - | 6 |
| Fagherazzi G [14] | 2014 | France | Cohort- baseline data for BMI | Women | 40-65y | 66485 | 16621/16622 | 208-item diet-history questionnaire/PRAL | Mean BMI and the prevalence of overweight or obesity was higher in the highest versus lowest PRAL quartile. | - | 6 |
| Faure AM [15] | 2017 | Switzerland | Cross-sectional | Men | ≥ 60 y | 117 | 29/29 | 110-item FFQ/PRAL | BMI was non-significantly higher in highest versus lowest PRAL quartiles. | - | 6 |
| Faure AM [15] | 2017 | Switzerland | Cross-sectional | Women | ≥ 60 y | 130 | 32/32 | 110-item FFQ/PRAL | BMI was non-significantly higher in highest versus lowest PRAL quartiles. | - | 6 |
| Gæde J [16] | 2018 | Denmark | Cohort (DCH) | Both | 50–64 y | 54651 | 10930/10931 | 192-item FFQ/PRAL | BMI was not significantly different between PRAL quintiles | - | 5 |
| Gæde J [16] | 2018 | Denmark | Cross-sectional (Inter99) | Both | 30–60 y | 5631 | 1126/1127 | FFQ/PRAL | BMI was not significantly different between PRAL quintiles | - | 6 |
| Haghighatdoost F [17] | 2015 | Iran | Cross-sectional | Both | Mean age 66.8 | 547 | 274/273 | FFQ/PRAL | No significant difference in the BMI, WC and the prevalence of obesity or abdominal obesity between PRAL groupings. | Protein, fat, cholesterol, fiber, whole refined grains, fruit, meat, potassium, phosphorus, beans, nuts, vegetables, BMI | 5 |
| Han E [11] | 2016 | Korea | Cross-sectional | Both | 40–79 y | 11601 | 4202/3859 | One day 24-recall/ PRAL | BMI was slightly lower in highest versus lowest terrtile of PRAL. No difference in WC was observed. | - | 7 |
| Ikizler HO [18] | 2016 | USA | Cross-sectional | Both | 63 | 21/21 | 3-day prospective food diaries/ NEAP | BMI was non-significantly higher in highest versus lowest NEAP tertile. | - | 7 | |
| Iwase H [7] | 2015 | Japan | Cross-sectional | Both | Mean aged 65.7 ±9.3 | 149 | 74/75 | Diet history questionnaire (DHQ)/ NEAP | No significant difference in BMI in highest versus lowest PRAL score groupings was observed. | - | 6 |
| Iwase H [7] | 2015 | Japan | Cross-sectional | Both | Mean aged 65.7 ±9.3 | 149 | 74/75 | Diet history questionnaire (DHQ)/ NEAP | No significant difference in BMI in highest versus lowest PRAL score groupings was observed. | - | 7 |
| Jia T [19] | 2015 | Sweden | Cross-sectional | Both | ≥ 70 y | 861 | 215/ 215 | 7-day food records | No significant difference in BMI in highest versus lowest NEAP quartils was observed. | 6 | |
| Kiefte-de Jong JC [30] | 2017 | USA | Cohort-NHS- median follow-up data | Women | 30–55 y | 121700 | 14974/ 11449 | FFQ/ NEAP | Higher BMI in top quintile versus lowest quintile of NEAP observed. | Age | 7 |
| Kiefte-de Jong JC [30] | 2017 | USA | Cohort-NHS2- median follow-up data | Women | 25–42 y | 116430 | 13878/ 18030 | FFQ/NEAP | Higher BMI in top quintile versus lowest quintile of NEAP observed. | Age | 6 |
| Kiefte-de Jong JC [30] | 2017 | USA | Cohort-HPFS- median follow-up data | Men | 40–75 y | 51529 | 7472/ 6428 | FFQ/NEAP | Higher BMI in top quintile versus lowest quintile of NEAP observed. | Age | 7 |
| Ko BJ [31] | 2017 | Korea | Cross-sectional | Both | ≥ 65 y | 1369 | 342/343 | FFQ/eNEAP | No significant difference in BMI between lowest and highest eNEAP quartiles was reported. | - | 6 |
| Krupp D [32] | 2018 | Germany | Cross-sectional | Both | 18–79 y | 7115 | 1358/1356 | FFQ/PRAL | No significant difference in BMI between different PRAL quintiles was observed. | - | 5 |
| Kucharska AM [33] | 2018 | Poland | Cross-sectional | Men | ≥ 20 y | 2760 | 920/ 920 | 24h-recall/ NEAP | BMI and WC and the prevalence of overweight or obesity in the highest tertile of PRAL were higher than the lowest. | - | 6 |
| Kucharska AM [33] | 2018 | Poland | Cross-sectional | Women | ≥ 20 y | 3409 | 1136/ 1137 | 24h-recall/ NEAP | BMI and WC and the prevalence of overweight or obesity in the highest tertile of PRAL were higher than the lowest. | - | 5 |
| Kucharska AM [33] | 2018 | Poland | Cross-sectional | Men | ≥ 20 y | 2760 | 920/ 920 | 24h-recall/ PRAL | No significant difference in the BMI and WC in the lowest versus highest PRAL tertiles was observed. The prevalence of overweight or obesity in the highest tertile of PRAL was lower than the lowest. | - | 7 |
| Kucharska AM [33] | 2018 | Poland | Cross-sectional | Women | ≥ 20 y | 3409 | 1136/ 1137 | 24h-recall/ PRAL | BMI and WC and the prevalence of overweight or obesity in the highest tertile of PRAL were lower than the lowest. | - | 5 |
| Luis D [34] | 2014 | Sweden | Cross-sectional | Both | 70–71 y | 673 | 224/ 224 | 7-d food records/PRAL | No significant difference in BMI between tertiles of PRAL was observed. | - | 6 |
| Murakami K [35] | 2008 | Japan | Cross-sectional | Both | 18–22 y | 1136 | 227/ 227 | DHQ/ PRAL | No significant difference in BMI between quintiles of PRAL was observed. WC in the highest quintile was significantly higher than the lowest. | Residential block, residential area size, survey year, PA current smoking, |
8 |
| Rebholz CM [36] | 2015 | USA | Cross-sectional | Both | 45–64 y | 15055 | 3011 | FFQ/NEAP, PRAL | The prevalence of overweight or obesity in the highest quartile was significantly higher than the lowest (73.9 vs 59.5%) | - | 6 |
| Welch AA [37] | 2007 | UK | Cross-sectional | Men | 42–82 y | 6375 | 1275/ 1275 | FFQ/ PRAL | No significant difference in BMI between quintiles of PRAL was observed. | - | 6 |
| Welch AA [37] | 2007 | UK | Cross-sectional | Women | 42–82 y | 8188 | 1639/1640 | FFQ/ PRAL | No significant difference in BMI between quintiles of PRAL was observed. | 6 | |
| Welch AA [38] | 2013 | UK | Cross-sectional | Women | 18–79 y | 2689 | 538/ 537 | FFQ/ PRAL | No significant difference in BMI between quintiles of PRAL was observed. | - | 5 |
| Wynn E [39] | 2008 | Swiss | Cross-sectional | Women | ≥ 75 y | 401 | 133/134 | FFQ/ NEAP | No significant difference in BMI between tertiles of NEAP was observed. | - | 5 |
| Hong Xu [40] | 2016 | Sweden | Cross-sectional | Women | 45–84 y | 36470 | 7294/ 7294 | FFQ/ PRAL | No significant difference in BMI between quintiles of PRAL was observed. | - | 5 |
| Hong Xu [40] | 2016 | Sweden | Cross-sectional | Men | 45–84 y | 44957 | 9038/ 8984 | FFQ/ PRAL | No significant difference in BMI between quintiles of PRAL was observed. | - | 6 |
| Hong Xu [41] | 2016 | Sweden | Cross-sectional | Both | 70–71 y | 911 | 304/ 303 | 7-d food records/PRAL | No significant difference in BMI between tertiles of PRAL was observed. | — | 5 |
Description of the studies reported the dietary acid load as PRAL and NEAP with serum lipids and CVD risk factors associations
From all of the systematically reviewed papers (Table 3) totally, seventeen studies reported the associations between PRAL and NEAP with cardiovascular disease (CVD) and serum lipids [4, 7, 11, 17, 19, 21, 28, 29, 31–37, 43, 44]. Higher concentrations of serum lipids including TG, LDL and lower HDL concentrations and higher prevalence of hypercholesterolemia in the highest versus lowest PRAL or NEAP categories was reported in six studies [7, 11, 17, 32, 35, 37]. In the study by Kiefte-de Jong JC et al among three cohort of NHS, NHS- II and HPFS, higher prevalence of hypercholesterolemia in the highest versus lowest quintiles of PRAL and NEAP was in both men and women was reported in all of three cohorts [32]. In other study by Kucharska AM [35] examining the association between dietary acid load and cardio-metabolic risk factors among polish adults, only serum TG tended to increase across tertiels of NEAP only among men; while no significant difference among women or across PRAL tertiles were observed [35]. On the other hand, three studies reported lower TC or higher HDL concentrations in highest versus lowest categories of PRAL or NEAP [21, 34, 35]. Other studies reported no significant difference between lipids across NEAP or PRAL categories [11, 28, 31, 33, 35]. The prevalence of CVD was reported among six studies [4, 19, 29, 31, 35, 36] while one study reporting an inverse association between the prevalence of CVD and NEAP quartile scores [4] and others reported no association. The prevalence of metabolic syndrome or the odds of it has also been reported in three studies [7, 11, 28]; Bahadoran et al [28] reported no difference in the prevalence of metabolic syndrome across quartiles of PRAL. In a cross-sectional population based study of 11601 general Korean population by Han et al higher prevalence of metabolic syndrome among highest versus lowest tertiles of PRAL was reported [11]. The third study, evaluated the association between PRAL, NEAP and metabolic risk factors among patients with T2DM, the prevalence of metabolic syndrome tend to decrease in PRAL or NEAP groupings while the odds of metabolic syndrome in the highest group of PRAL [OR = 2.22; CI: 1.04–4.83] or NEAP was higher than the lowest group as the reference group [OR = 2.61; CI: 1.25–5.55; P <0.001] after adjustment for age, sex, serum uric acid and creatinine, total energy intake, carbohydrate intake and sodium intake. In the study by Hong X et al no significant difference in the prevalence of hyperlipidemia between tertiles of PRAL was observed [7].
Table 3. Characteristics of studies included in the systematic review owing to reporting the association between dietary acid load with serum lipids and risk of CVD, hyperlipidemia and metabolic syndrome.
| First author | Year | Country | Study design | Sex | Age range | Sample size / Population | Number of cases / controls | Dietary assessment/ index | Result | Adjusted variables | Quality of the study |
|---|---|---|---|---|---|---|---|---|---|---|---|
| Amodu A [4] | 2013 | USA | Cross-sectional | Both | ≥ 20 years | 13274 | 2490/2477 | 24-hour dietary recall questionnaire/ NEAP | The prevalence CVD in lowest quartile of NEAP was significantly higher than the highest (P < 0.001). | - | 6 |
| Bahadoran Z [26] | 2015 | Iran | Cross-sectional | Both | 19–70 y | 5620 | 1405/1405 | 147-item food-frequency questionnaire/ PRAL | No significant difference in TG and the prevalence of hypertriglyceridemia and low HDL and the prevalence of metabolic syndrome between quartiles was reported. | - | 6 |
| Banerjee T [27] | 2018 | USA | Cross-sectional | Both | 21–84 y | 3257 | 1074/1075 | FFQ | No significant difference in the prevalence of CVD was reported. | 6 | |
| Engberink MF [29] | 2012 | Netherland | Cross-sectional–baseline data | Both | ≥ 55 y | 2241/ general population | 747/747 | FFQ | No significant difference in the prevalence of CHD and the mean values of HDL and TC was observed. | 7 | |
| Haghighatdoost F [17] | 2015 | Iran | Cross-sectional | Both | Mena age 66.8 | 547/ general population | 274/273 | FFQ/PRAL | TG was significantly higher in higher versus lowers PRAL score groupings. | Protein, fat, cholesterol, fiber, whole refined grains, fruit, meat, potassium, phosphorus, beans, nuts, vegetables, BMI | 9 |
| Han E [11] | 2016 | Korea | Cross-sectional | Both | 40–79 y | 11601/ general population | 4202/3859 | One day 24-recall/ PRAL | TG and the prevalence of metabolic syndrome in highest tertile was significantly higher than the lowest. TC, HDL and LDL were not different. | 6 | |
| Iwase H [7] | 2015 | Japan | Cross-sectional | Both | Mean aged 65.7 ±9.3 | 149/ population with T2DM | 74/75 | Diet history questionnaire (DHQ)/ PRAL | LDL, TG and the odds of metabolic syndrome in highest group of PRAL was significantly higher than the lowest. The prevalence of metabolic syndrome in lowest group of PRAL score was higher than the highest. | age, sex, serum uric acid and creatinine, total energy intake, carbohydrate intake and sodium intake. | 8 |
| Iwase H [7] | 2015 | Japan | Cross-sectional | Both | Mean aged 65.7 ±9.3 | 149/ population with T2DM | 74/75 | Diet history questionnaire (HQ)/ NEAP | LDL and the odds of metabolic syndrome in highest group of PRAL was significantly higher than the lowest. No significant difference in TG was observed. The prevalence of metabolic syndrome in lowest group of PRAL score was higher than the highest |
age, sex, serum uric acid and creatinine, total energy intake, carbohydrate intake and sodium intake. | 8 |
| Jia T [19] | 2015 | Sweden | Cross-sectional | Both | ≥ 70 y | 861/ general population | 215/ 215 | 7-day food records/NEAP | No significant difference in the prevalence of CVD between NEAP quartiles was observed. | - | 6 |
| Kiefte-de Jong JC [30] | 2017 | USA | Cohort-NHS- median follow-up data | Both | 30–55 y | 121700/ general population | 14974/ 11449 | FFQ/ NEAP, PRAL | Higher prevalence of hypercholesterolemia in highest versus lowest quintile of NEAP was reported. | Age, energy intake, BMI, family history of diabetes, menopausal status, HTN and hypercholesterolemia, smoking, alcohol intake, PA, glycemic load, AHEI index, western dietary pattern |
8 |
| Kiefte-de Jong JC [30] | 2017 | USA | Cohort-NHS2- median follow-up data | Women | 25–42 y | 116430/ general population | 13878/ 18030 | FFQ/NEAP, PRAL | Higher prevalence of hypercholesterolemia in highest versus lowest quintile of NEAP was reported. | Age, energy intake, BMI, family history of diabetes, menopausal status, HTN and hypercholesterolemia, smoking, alcohol intake, PA, glycemic load, AHEI index, western dietary pattern | 8 |
| Kiefte-de Jong JC [30] | 2017 | USA | Cohort-HPFS- median follow-up data | Men | 40–75 y | 51529/ general population | 7472/ 6428 | FFQ/NEAP, PRAL | Higher prevalence of hypercholesterolemia in highest versus lowest quintile of NEAP was reported. | Age, energy intake, BMI, family history of diabetes, menopausal status, HTN and hypercholesterolemia, smoking, alcohol intake, PA, glycemic load, AHEI index, western dietary pattern | 8 |
| Ko BJ [31] | 2017 | Korea | Cross-sectional | Both | ≥ 65 y | 1369/ general population | 342/343 | FFQ/eNEAP | No significant difference in TG, TC, the prevalence of hyperlipidemia between lowest and highest eNEAP quartiles was reported. | - | 7 |
| Krupp D [32] | 2018 | Germany | Cross-sectional | Both | 18–79 y | 7115/ general population | 1358/1356 | FFQ/PRAL | TC was lower in fifth quintile compared with the first. | - | 7 |
| Kucharska AM [33] | 2018 | Poland | Cross-sectional | Men | ≥ 20 y | 2760/ general population | 920/ 920 | 24h-recall/ NEAP | TG in highest tertile of NEAP was significantly higher than the lowest. No significant difference in other parameters. | Age, sex | 8 |
| Kucharska AM [33] | 2018 | Poland | Cross-sectional | Women | ≥ 20 y | 3409/ general population | 1136/ 1137 | 24h-recall/ NEAP | No significant difference in TG, TC, LDL, HDL, the prevalence of hyperlipidemia and CVD between PRAL tertiles was observed. | Age, sex | 7 |
| Kucharska AM [33] | 2018 | Poland | Cross-sectional | Men | ≥ 20 y | 2760/ general population | 920/ 920 | 24h-recall/ PRAL | No significant difference in TG, TC, LDL, the prevalence of hyperlipidemia and CVD between NEAP tertiles was observed. HDL in highest tertile was significantly higher than the lowest. | Age, sex | 7 |
| Kucharska AM [33] | 2018 | Poland | Cross-sectional | Women | ≥ 20 y | 3409/ general population | 1136/ 1137 | 24h-recall/ PRAL | No significant difference in TG, TC, LDL and HDL, the prevalence of hyperlipidemia and CVD between PRAL tertiles was observed. | Age, sex | 8 |
| Luis D [34] | 2014 | Sweden | Cross-sectional | Both | 70–71 y | 673/ general population | 224/ 224 | 7-d food records/PRAL | No significant difference in the prevalence of dyslipidemia, CVD between tertiles of PRAL was observed. | - | 6 |
| Moghadam SKH [42] | 2016 | Iran | Cross-sectional | Both | 22–80 y | 925/ general population | 224 | FFQ/ PRAL | No significant difference in LDL, HDL, TG at baseline between quartiles of PRAL was reported. | - | 6 |
| Moghadam SKH [42] | 2016 | Iran | Cohort | Both | 22–80 y | 925/ general population | 224 | FFQ/ PRAL, NEAP | No significant difference in LDL, HDL, TG after three years follow-up between quartiles of PRAL was reported. | Age, sex, BMI,PA, dietary energy, fat, carbohydrate, SFA, fiber |
7 |
| Murakami K [35] | 2008 | Japan | Cross-sectional | Both | 18–22 y | 1136/ general population | 227/ 227 | DHQ/ PRAL | Significantly higher values of TC, LDL between different quartiles of PRAL. No difference in HDL and TAG was observed. | Residential block, residential area size, survey year, PA current smoking, BMI, WC. | 8 |
| Berg EVD [21] | 2012 | Denmark | Cross-sectional | Both | ≥ 18 y | 707/ renal transplant patients | 236/236 | FFQ/NEAP | TC in the highest tertile of NEAP was significantly lower than the lowest. No difference in the TG, HDL between tertiles of NEAP was reported. | - | 7 |
| Hong Xu [41] | 2016 | Sweden | Cross-sectional | Both | 70–71 y | 911 | 304/ 303 | 7-d food records/PRAL | No significant difference in the prevalence of HLP between PRAL tertiles was observed. | Age, BMI, smoking status, PA, education, glucose disposal rate (M), CVD, HTN, HLP, energy-adjusted fiber, MUFA, PUFA, SFA, carbohydrate intake, eGFR, UAER |
8 |
Findings from meta-analysis of the prevalence of general obesity, central obesity and difference in BMI across lowest and highest dietary acid load categories
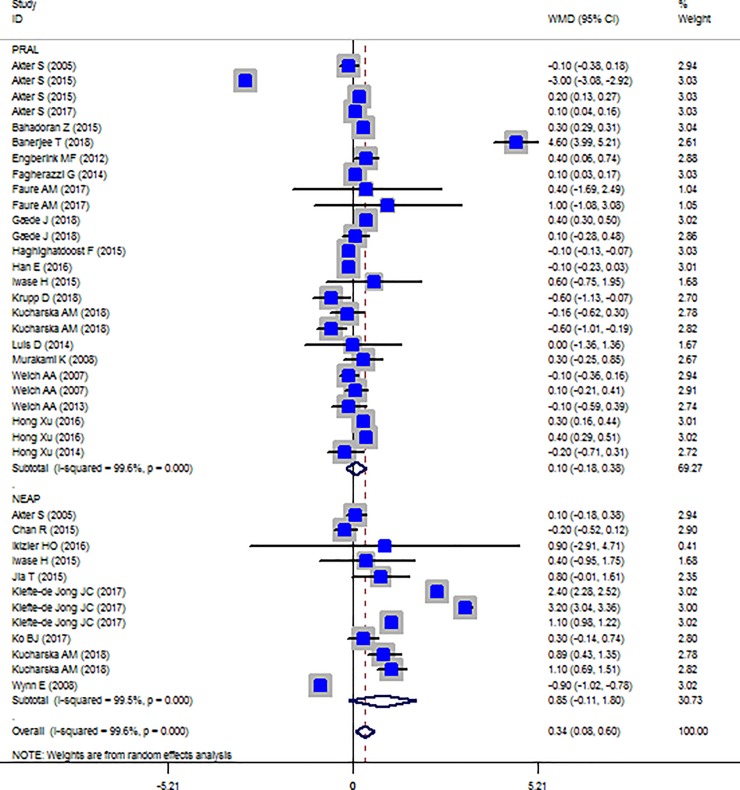
The Forest plot of the studies included in the PRAL, NEAP and BMI meta-analysis are presented in Fig 2. No significant association between BMI and dietary acid load indices was observed (PRAL: WMD = 0.101, 95% CI = -0.179, 0.380; P = 0.481; NEAP: WMD = 0.845, 95% CI = -0.106, 1.797; P = 0.082). However, a great between-study heterogeneity was observed (PRAL: Heterogeneity chi-squared = 6716.43 (d.f. = 25), P < 0.001; I2 = 99.6%; Tau2 = 0.45; NEAP: Heterogeneity chi-squared = 2315.96 (d.f. = 11), P <0.001; I2 = 99.5%; Tau2 = 2.62). Sensitivity analysis showed that excluding the study by Akter et al [20] in men led to significance change in the effect size (WMD: 0.230; CI: 0.105, 0.354; P<0.001).
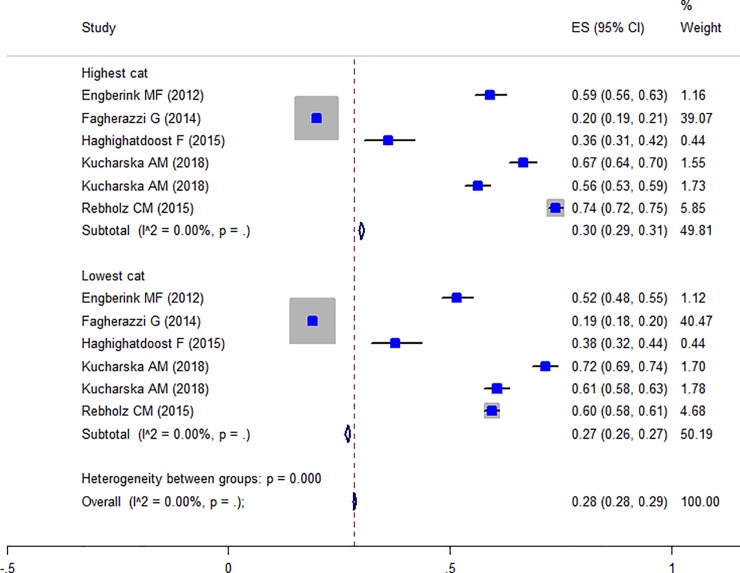
Fig 2. Forest plot illustrating obesity proportions in highest versus lowest PRAL categories.
The results of subgroup analysis for the association between BMI with PRAL and NEAP are presented in Tables 4 and 5. Accordingly, for PRAL-BMI associations, country, dietary assessment tool and sample size are the possible source of heterogeneity whereas, in NEAP-BMI associations, country and dietary assessment tool are the source of heterogeneity. Subgroup analysis also revealed gender difference in the associations between PRAL, NEAP and BMI (Table 4). Higher PRAL scores were associated with increased BMI in females (WMD: 0.122; CI: -0.001, 0.245; P = 0.049) and not in men. While, NEAP and BMI association was significant only among men (WMD: 0.890; CI: 0.430, 1.350; P < 0.001).
Table 4. Results of subgroup analyses of the association between mean difference in BMI and PRAL according to study and participants’ characteristics.
| Group | No. of studies | WMD (95% CI) | P within group | P between group | P heterogeneity | I2, % |
|---|---|---|---|---|---|---|
| Total | 26 | 0.101–0.179, 0.380 | 0.481 | <0.001 | 99.6% | |
| Country | ||||||
| USA | 1 | 4.600 3.989 5.211 | <0.001 | - | - | |
| Denmark | 2 | 0.307 0.034 0.579 | 0.027 | <0.001 | 0.132 | 56.0% |
| Japan | 6 | -0.345–1.645 0.956 | 0.604 | <0.001 | 99.9% | |
| France | 1 | 0.100 0.030 0.170 | 0.005 | - | - | |
| UK | 3 | -0.027–0.213 0.158 | 0.772 | <0.001 | 0.0% | |
| Iran | 2 | 0.100–0.292 0.492 | 0.616 | <0.001 | 99.8 | |
| Korea | 1 | -0.100–0.233 0.033 | 0.141 | - | - | |
| Netherland | 1 | 0.400 0.055 0.745 | 0.023 | - | - | |
| Switzerland | 2 | 0.702–0.773 2.177 | 0.351 | 0.690 | 0.0% | |
| Germany | 1 | -0.600–1.131–0.069 | 0.027 | 0.164 | - | |
| Poland | 2 | -0.392–0.822 0.039 | 0.074 | 0.112 | 48.5 | |
| Sweden | 4 | 0.300 0.138 0.462 | <0.001 | 0.597 | 50.0 | |
| Continent | ||||||
| Europe/ USA | 17 | 0.285 0.050 0.521 | 0.017 | 0.965 | <0.001 | 94.1% |
| Asia | 9 | -0.251–0.759 0.257 | 0.333 | <0.001 | 99.9% | |
| Dietary assessment tool | ||||||
| FFQ | 17 | 0.185–0.179 0.549 | 0.320 | <0.001 | 0.320 | 99.8% |
| DHQ | 4 | 0.092 0.025 0.160 | 0.007 | 0.395 | 0.0% | |
| Food Record | 2 | -0.175–0.652 0.301 | 0.471 | 0.471 | 0.0% | |
| 24-H-Recall | 3 | -0.248–0.549 0.052 | 0.105 | 0.079 | 60.6% | |
| Sample size | ||||||
| 1000 < | 6 | -0.100–0.133–0.066 | <0.001 | <0.001 | 0.777 | 0.0% |
| 1000–10000 | 12 | 0.309–0.066 0.683 | 0.107 | <0.001 | 95.5% | |
| >10000 | 8 | -0.200–1.007 0.607 | 0.627 | <0.001 | 99.9% | |
| Gender | ||||||
| Male | 6 | -0.444–2.261 1.373 | 0.632 | <0.001 | <0.001 | 99.8% |
| Female | 8 | 0.122–0.001 0.245 | 0.049 | 0.002 | 69.4% | |
| Both gender | 12 | 0.297 0.111 0.483 | 0.002 | <0.001 | 98.6% | |
Studies eligible for inclusion in the systematic review and meta-analysis
Table 5. Results of subgroup analyses of the association between mean difference in BMI and NEAP according to study and participants’ characteristics.
| Group | No. of studies | WMD (95% CI) | P within group | P between group | P heterogeneity | I2, % |
|---|---|---|---|---|---|---|
| Total | 12 | 0.845–0.106 1.797 | 0.082 | <0.001 | 99.5% | |
| Country | ||||||
| USA | 4 | 2.142 1.018 3.266 | <0.001 | <0.001 | <0.001 | 99.4% |
| China | 1 | -0.200–0.523 0.123 | 0.224 | - | - | |
| Japan | 2 | 0.112–0.159 0.384 | 0.418 | 0.670 | 0.0% | |
| Swiss | 1 | -0.900–1.020–0.780 | <0.001 | - | - | |
| Korea | 1 | 0.300–0.135 0.735 | 0.177 | - | 0.0% | |
| Poland | 2 | 1.006 0.698 1.314 | <0.001 | 0.506 | - | |
| Sweden | 1 | 0.800–0.013 1.613 | 0.054 | - | - | |
| Continent | ||||||
| USA | 4 | 2.142 1.018 3.266 | <0.001 | <0.001 | <0.001 | 99.4% |
| Europe | 4 | 0.457–0.827 1.742 | 0.485 | <0.001 | 97.9% | |
| Asia | 4 | 0.050–0.180 0.281 | 0.668 | 0.267 | 24.0% | |
| Dietary assessment tool | ||||||
| FFQ | 6 | 0.986–0.393 2.365 | 0.161 | <0.001 | <0.001 | 99.8% |
| DHQ | 2 | 0.112–0.159 0.384 | 0.418 | 0.670 | 0.0% | |
| 7 day-Food Record | 1 | 0.800–0.013 1.613 | 0.054 | - | - | |
| 24-H-Recall | 2 | 1.006 0.698 1.314 | <0.001 | 0.506 | 0.0% | |
| 3 day-Food Dairy | 1 | 0.900–2.911 4.711 | 0.643 | - | - | |
| Sample size | ||||||
| 1000 < | 4 | 0.100–1.132 1.331 | 0.874 | <0.001 | <0.001 | 85.4% |
| 1000–10000 | 5 | 0.421–0.047 0.889 | 0.087 | <0.001 | 87.5% | |
| >10000 | 3 | 2.233 1.067 3.398 | <0.001 | <0.001 | 99.6% | |
| Gender | ||||||
| Male | 1 | 0.890 0.430 1.350 | <0.001 | <0.001 | - | - |
| Female | 2 | 0.090–1.870 2.050 | 0.928 | <0.001 | 98.8% | |
| Both gender | 9 | 1.036 0.185 1.886 | 0.017 | <0.001 | 99.1% | |
Studies eligible for inclusion in the systematic review and meta-analysis
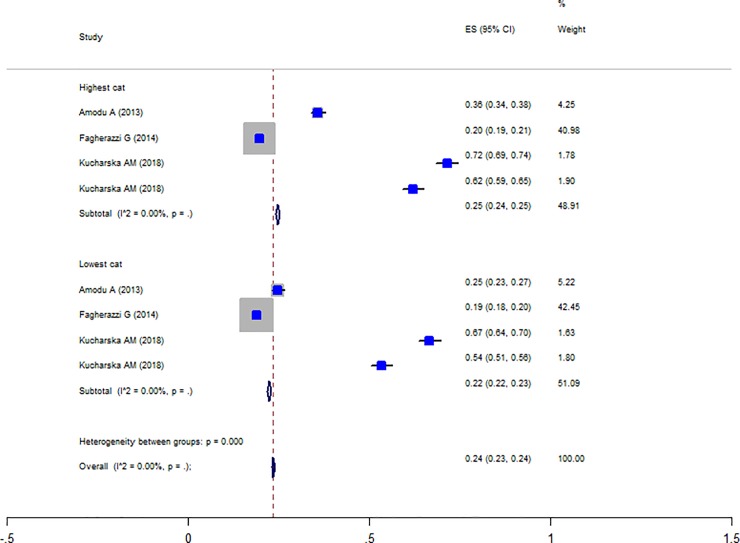
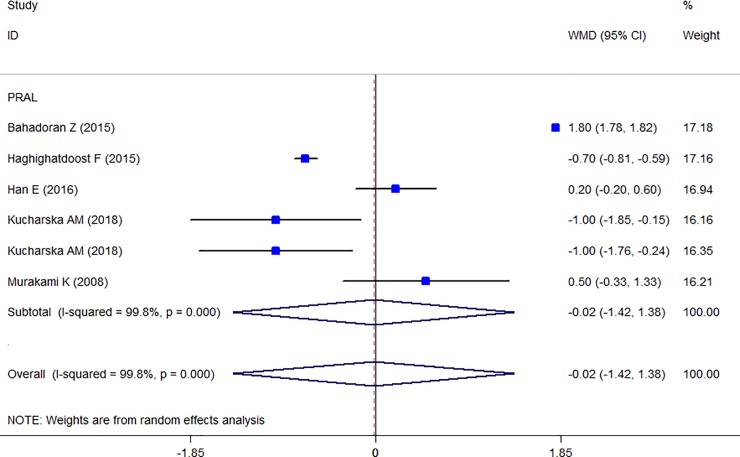
Totally, five studies were reported the prevalence of obesity in different PRAL categories [14, 17, 31, 35, 38] and the Forest plot is presented in Fig 3. The prevalence of obesity in the highest PRAL category was 30% (CI: 0.29–0.31) and in the lowest category was 27% (CI: 0.26–0.27) with no evidence of heterogeneity. Moreover, three studies were also reported the prevalence of obesity in different NEAP categories [4, 14, 35] and the Forest plot (Fig 4) indicates that the prevalence of obesity in the highest NEAP category was 25% (CI: 0.24–0.24) and in the lowest category was 22% (CI: 0.22–0.23) with no evidence of heterogeneity. As shown, the higher prevalence of obesity in the highest scores of PRAL and NEAP had been reported. The prevalence of central obesity was identified in only two studies [17, 28] and therefore, no meta-analysis was performed. The association between waist circumferences as an indicator of central obesity with PRAL was reported in seven studies and the Forest plot (Fig 5) revealed no association (WMD: -0.021; CI:-1.422, 1.38, P = 0.977) with a great heterogeneity (Heterogeneity chi-squared = 2079.18 (d.f. = 5), P < 0.001; I2 = 99.8%; Tau2 = 2.97). In sensitivity analysis excluding the study by Wynn et al [41] revealed a significant association (WMD: 1.036; CI: 0.185, 1.886; P = 0.017). Table 6 presents the possible effects of country and continent on the heterogeneity. Among the reviewed studies only two studies reported the WC-NEAP associations and therefore were excluded from the meta-analysis [35, 37].
Fig 3. Forest plot illustrating obesity proportion in highest versus lowest NEAP categories.
Fig 4. Forest plot illustrating weighted mean difference in BMI in highest versus lowest PRAL and NEAP.
Fig 5. Forest plot illustrating weighted mean difference in WC in highest versus lowest PRAL.
Table 6. Results of subgroup analyses of the association between mean difference in WC and PRAL according to study and participants’ characteristics.
| Group | No. of studies | WMD (95% CI) | P within group | P between group | P heterogeneity | I2, % |
|---|---|---|---|---|---|---|
| Total | 6 | -0.021–1.422 1.38 | 0.977 | <0.001 | 99.8% | |
| Country | ||||||
| Japan | 1 | 0.500–0.330 1.330 | 0.238 | <0.001 | - | - |
| Iran | 2 | 0.551–1.899 3.001 | 0.660 | <0.001 | 99.9% | |
| Korea | 1 | 0.200–0.200 0.600 | 0.327 | - | - | |
| Poland | 2 | -1.000–1.568–0.432 | 0.001 | 1 | 0.0% | |
| Continent | ||||||
| Europe | 2 | -1.000–1.568–0.432 | <0.001 | <0.001 | 1 | 0.0% |
| Asia | 4 | 0.450–1.248 2.149 | 0.603 | <0.001 | 99.8% | |
| Dietary assessment tool | ||||||
| FFQ | 2 | 0.551–1.899 3.001 | 0.660 | <0.001 | <0.001 | 99.9% |
| DHQ | 1 | 0.500–0.330 1.330 | 0.238 | 0.003 | 82.5% | |
| 24-H-Recall | 3 | -0.544–1.457 0.368 | 0.242 | - | - | |
| Sample size | ||||||
| <1000 | 1 | -0.700–0.809–0.591 | <0.001 | <0.001 | - | - |
| 1000–5000 | 4 | 0.100–1.591 1.791 | 0.908 | <0.001 | 97.1% | |
| >5000 | 1 | 0.200–0.200 0.600 | 0.327 | - | - | |
| Gender | ||||||
| Male | 1 | -1.000–1.850–0.150 | 0.021 | <0.001 | - | - |
| Female | 2 | -0.259–1.729 1.211 | 0.730 | 0.009 | 85.3% | |
| Both gender | 3 | 0.435–1.526 2.395 | 0.664 | <0.001 | 99.9% | |
Studies eligible for inclusion in the systematic review and meta-analysis
Findings from meta-analysis of mean TC, HDL-C, LDL-C, TG across different categories of dietary acid load
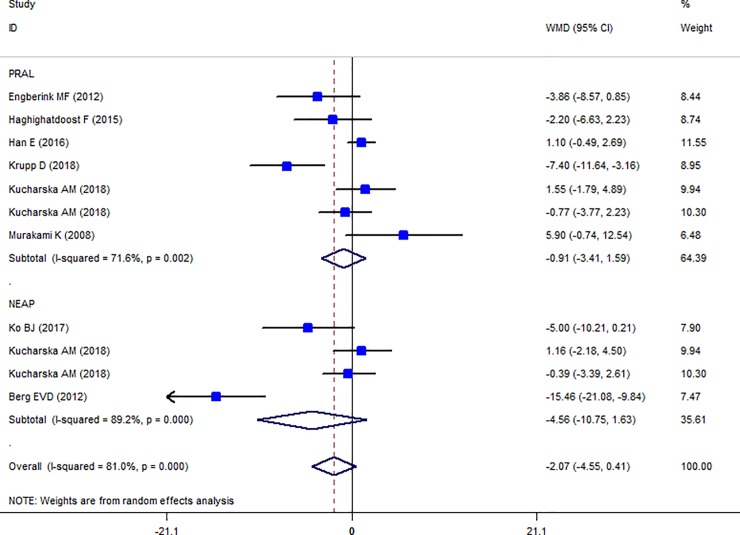
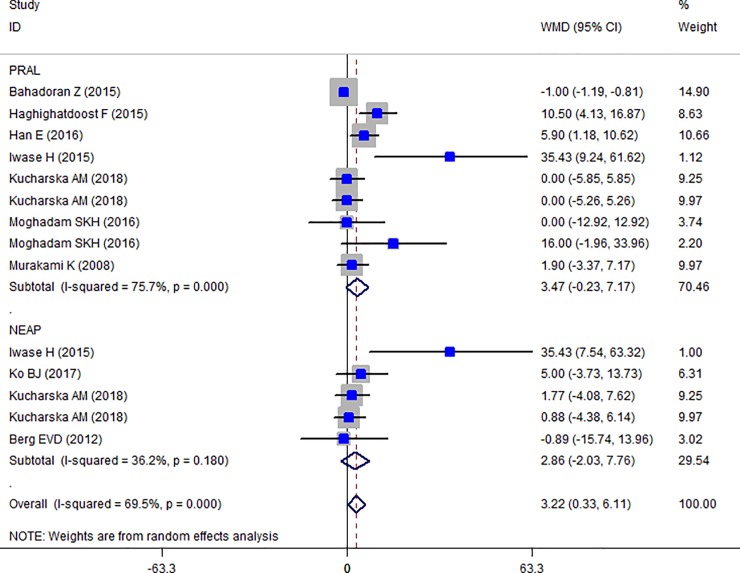
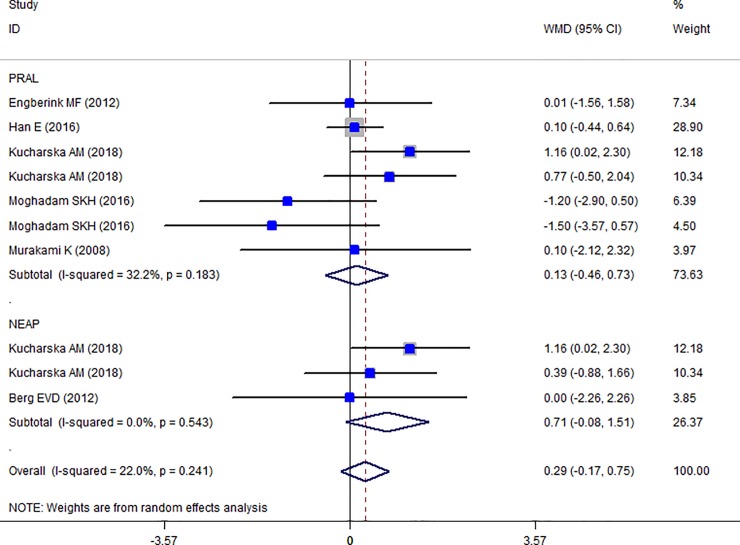
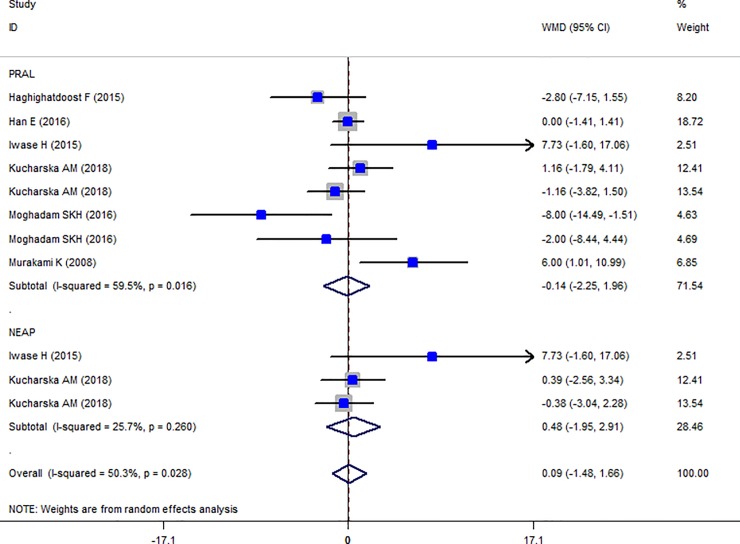
The Forest plot of the effect of dietary acid load on serum TC (Fig 6) shows that no association between PRAL and NEAL with TC is present (PRAL: WMD = -0.911, 95% CI = -3.413, 1.590; P = 0.475; NEAP: WMD = -2.071, 95% CI = -4.549, 0.408; P = 0.149). A great heterogeneity was also observed (PRAL: Heterogeneity chi-squared = 21.16 (d.f. = 6), P = 0.002; I2 = 71.6%; Tau2 = 7.43; NEAP: Heterogeneity chi-squared = 27.81 (d.f. = 3), P <0.001; I2 = 89.2%; Tau2 = 34.92). Country dietary assessment tool and sample size might be the source of heterogeneity (Tables 7 and 8). Sensitivity analysis revealed no change in results. Association between PRAL, NEAP and serum TG is presented in Forest plot Fig 7 and accordingly, high PRAL scores are associated with 3.47 mg/dl increase in serum TG concentrations (WMD: 3.468; CI: -0.231, 7.166, P = 0.04) while no significant association between NEAP and TG was presented (WMD: 2.861; CI: -2.034, 7.756; P = 0.252). A great heterogeneity was also observed (PRAL: Heterogeneity chi-squared = 32.92 (d.f. = 8), P < 0.001; I2 = 75.7%; Tau2 = 17.94; NEAP: Heterogeneity chi-squared = 6.27 (d.f. = 4), P = 0.180; I2 = 36.2%; Tau2 = 10.50). The results of subgroup analysis are presented in Tables 9 and 10. The Forest plot of the association between PRAL, NEAP and serum HDL concentrations are presented in Fig 8. Accordingly, no effects of PRAL, NEAP and HDL was reported with minor heterogeneity (PRAL: WMD = 0.134; CI: -0.46, 0.728; P = 0.658; NEAP: WMD = 0.715, 95% CI = -0.081, 1.51; P = 0.078). The heterogeneity was minor (PRAL: Heterogeneity chi-squared = 8.84 (d.f. = 6), P = 0.183; I2 = 32.2%; Tau2 = 0.194; NEAP: Heterogeneity chi-squared = 1.22 (d.f. = 2), P = 0.543; I2 = 0.0%; Tau2 <0.001). In the case of the PRAL, NEAP and serum LDL concentrations also no association was observed (PRAL: WMD = -0.144; CI: -2.251, 1.96; P = 0.893; NEAP: WMD = 0.480, 95% CI = -1.954, 2.913; P = 0.669). The heterogeneity was meaningful for the PRAL-LDL meta-analysis (PRAL: Heterogeneity chi-squared = 17.29 (d.f. = 7), P = 0.016; I2 = 59.5%; Tau2 = 4.531; NEAP: Heterogeneity chi-squared = 2.69 (d.f. = 2), P = 0.260; I2 = 25.7%; Tau2 = 1.257; Fig 9, Table 11).
Fig 6. Forest plot illustrating weighted mean difference in TC in highest versus lowest PRAL and NEAP.
Table 7. Results of subgroup analyses of the association between mean difference in TC and PRAL according to study and participants’ characteristics.
| Group | No. of studies | WMD (95% CI) | P within group | P between group | P heterogeneity | I2, % |
|---|---|---|---|---|---|---|
| Total | 6 | -0.911, 3.413 1.590 | 0.475 | 0.002 | 71.6 | |
| Country | ||||||
| Netherland | 1 | -3.860–8.566 0.846 | 0.108 | <0.001 | - | - |
| Iran | 1 | -2.200–6.634 2.234 | 0.331 | - | - | |
| Korea | 1 | 1.100–0.486 2.686 | 0.174 | - | - | |
| Germany | 1 | -7.400–11.642–3.158 | 0.001 | - | - | |
| Japan | 1 | 5.900–0.741 12.541 | 0.082 | - | - | |
| Poland | 2 | 0.271–1.990 2.533 | 0.814 | 0.311 | 2.6% | |
| Continent | ||||||
| Europe | 4 | -2.390–6.096 1.315 | 0.206 | 0.021 | 0.008 | 74.5% |
| Asia | 3 | 0.974–2.230 4.178 | 0.551 | 0.128 | 51.3% | |
| Dietary assessment tool | ||||||
| FFQ | 3 | -4.564–7.658–1.470 | 0.004 | <0.001 | 0.235 | 30.9% |
| DHQ | 1 | 5.900–0.741 12.541 | 0.082 | - | - | |
| 24-H-Recall | 3 | 0.821–0.472 2.113 | 0.213 | 0.501 | 0.0% | |
| Sample size | ||||||
| <2000 | 2 | 1.457–6.443 9.358 | 0.718 | 0.066 | 0.047 | 74.7% |
| 2000–10000 | 4 | -2.390–6.096 1.315 | 0.206 | 0.008 | 74.5% | |
| >10000 | 1 | 1.100–0.486 2.686 | 0.174 | - | - | |
| Gender | ||||||
| Male | 1 | 1.550–1.786 4.886 | 0.362 | 0.511 | - | - |
| Female | 2 | 0.361–2.374 3.096 | 0.796 | 0.073 | 68.9% | |
| Both gender | 4 | -0.474–1.823 0.876 | 0.492 | 0.001 | 81.9% | |
Studies eligible for inclusion in the systematic review and meta-analysis
Table 8. Results of subgroup analyses of the association between mean difference in TC and NEAP according to study and participants’ characteristics.
| Group | No. of studies | WMD (95% CI) | P within group | P between group | P heterogeneity | I2, % |
|---|---|---|---|---|---|---|
| Total | 4 | -2.071 4.549, 0.408 | 0.149 | <0.001 | 89.2% | |
| Country | ||||||
| Korea | 1 | -5.000–10.210 0.210 | 0.060 | <0.001 | - | - |
| Denmark | 1 | -15.460–21.076–9.844 | <0.001 | 0.498 | 0.0% | |
| Poland | 2 | 0.303–1.928 2.534 | 0.790 | - | - | |
| Continent | ||||||
| Europe | 3 | -4.520–12.514 3.473 | 0.268 | 0.216 | <0.001 | 92.5% |
| Asia | 1 | -5.000–10.210 0.210 | 0.060 | - | - | |
| Dietary assessment tool | ||||||
| FFQ | 2 | -0.316–0.662 0.030 | 0.073 | <0.001 | 0.003 | 88.3% |
| 24-H-Recall | 2 | 0.008–0.053 0.069 | 0.790 | 0.498 | 0.0% | |
| Sample size | ||||||
| <1500 | 2 | -0.316–0.662 0.030 | 0.073 | <0.001 | 0.003 | 88.3% |
| >1500 | 2 | 0.008–0.053 0.069 | 0.790 | 0.498 | 0.0% | |
| Gender | ||||||
| Male | 1 | 0.032–0.060 0.123 | 0.496 | <0.001 | - | - |
| Female | 1 | -0.011–0.093 0.072 | 0.799 | - | - | |
| Both gender | 2 | -0.316–0.662 0.030 | 0.073 | 0.003 | 88.3% | |
Studies eligible for inclusion in the systematic review and meta-analysis
Fig 7. Forest plot illustrating weighted mean difference in TG in highest versus lowest PRAL and NEAP.
Table 9. Results of subgroup analyses of the association between mean difference in TG and PRAL according to study and participants’ characteristics.
| Group | No. of studies | WMD (95% CI) | P within group | P between group | P heterogeneity | I2, % |
|---|---|---|---|---|---|---|
| Total | 9 | 3.468–0.231, 7.166 | 0.04 | 0.001 | 75.7% | |
| Country | ||||||
| Iran | 4 | 4.990–3.397 13.377 | 0.244 | 0.012 | 0.001 | 81.2% |
| Korea | 1 | 5.900 1.180 10.620 | 0.014 | - | - | |
| Japan | 2 | 16.111–16.365 48.586 | 0.331 | 0.014 | 83.5% | |
| Poland | 2 | 0.000–3.912 3.912 | 1.000 | 1.000 | 0.0% | |
| Dietary assessment tool | ||||||
| FFQ | 4 | 4.990–3.397 13.377 | 0.244 | 0.025 | <0.001 | 81.2% |
| DHQ | 2 | 16.111–16.365 48.586 | 0.331 | 0.014 | 83.5% | |
| 24-H-Recall | 3 | 2.205–1.841 6.251 | 0.286 | 0.169 | 43.8% | |
| Sample size | ||||||
| <1000 | 5 | 8.291 0.495 16.086 | 0.037 | <0.001 | 0.025 | 64.0% |
| 1000–5000 | 2 | 0.000–3.912 3.912 | 1.000 | 1.000 | 0.0% | |
| >5000 | 2 | 2.030–4.681 8.742 | 0.553 | 0.004 | 87.8% | |
| Gender | ||||||
| Male | 1 | 0.000–5.849 5.849 | 1.000 | 0.568 | - | - |
| Female | 2 | 0.949–2.773 4.671 | 0.617 | 0.617 | 0.0% | |
| Both gender | 6 | 6.719 0.035 13.403 | 0.049 | <0.001 | 84.1% | |
Studies eligible for inclusion in the systematic review and meta-analysis
Table 10. Results of subgroup analyses of the association between mean difference in TG and NEAP according to study and participants’ characteristics.
| Group | No. of studies | WMD (95% CI) | P within group | P between group | P heterogeneity | I2, % |
|---|---|---|---|---|---|---|
| Total | 5 | 2.861–2.034, 7.756 | 0.252 | 0.180 | 36.2% | |
| Country | ||||||
| Denmark | 1 | -0.890–15.739 13.959 | 0.906 | 0.107 | - | - |
| Korea | 1 | 5.000–3.734 13.734 | 0.262 | - | - | |
| Japan | 1 | 35.430 7.536 63.324 | 0.013 | - | - | |
| Poland | 2 | 1.278–3.752 6.309 | 0.618 | 0.863 | 0.0% | |
| Dietary assessment tool | ||||||
| FFQ | 2 | 3.486–4.043 11.015 | 0.364 | 0.06 | 0.503 | 0.0% |
| DHQ | 1 | 35.430 7.536 63.324 | 0.013 | - | - | |
| 24-H-Recall | 2 | 1.278–3.752 6.309 | 0.618 | 0.863 | 0.0% | |
| Sample size | ||||||
| <1500 | 3 | 5.655–1.614 12.924 | 0.127 | 0.332 | 0.076 | 61.1% |
| >1500 | 2 | 1.278–3.752 6.309 | 0.618 | 0.863 | 0.0% | |
| Gender | ||||||
| Male | 1 | 1.770–5.751 9.291 | 0.645 | 0.615 | - | - |
| Female | 1 | 0.880–5.887 7.647 | 0.799 | - | - | |
| Both gender | 3 | 8.403–5.925 22.730 | 0.250 | 0.076 | 61.1% | |
Studies eligible for inclusion in the systematic review and meta-analysis
Fig 8. Forest plot illustrating weighted mean difference in HDL in highest versus lowest PRAL and NEAP.
Fig 9. Forest plot illustrating weighted mean difference in LDL in highest versus lowest PRAL and NEAP.
Table 11. Results of subgroup analyses of the association between mean difference in LDL and PRAL according to study and participants’ characteristics.
| Group | No. of studies | WMD (95% CI) | P within group | P between group | P heterogeneity | I2, % |
|---|---|---|---|---|---|---|
| Total | 8 | 0.144–2.251, 1.96 | 0.893 | 0.016 | 59.5 | |
| Country | ||||||
| Iran | 3 | -3.862–7.122–0.601 | 0.020 | 0.003 | 0.348 | 5.3% |
| Korea | 1 | 0.000–1.414 1.414 | 1.000 | - | - | |
| Japan | 2 | 6.385 1.986 10.783 | 0.004 | 0.749 | 0.0% | |
| Poland | 2 | -0.093–2.359 2.173 | 0.936 | 0.252 | 23.8% | |
| Dietary assessment tool | ||||||
| FFQ | 3 | -3.862–7.122–0.601 | 0.020 | <0.001 | 0.348 | 5.3% |
| DHQ | 2 | 6.385 1.986 10.783 | 0.004 | 0.749 | 0.0% | |
| 24-H-Recall | 3 | -0.041–1.191 1.108 | 0.944 | 0.517 | 0.0% | |
| Sample size | ||||||
| <1000 | 4 | -2.080–7.087 2.926 | 0.415 | 0.168 | 0.060 | 59.5% |
| 1000–10000 | 3 | 1.453–2.017 4.924 | 0.412 | 0.043 | 68.3% | |
| >10000 | 1 | 0.000–1.414 1.414 | 1.000 | - | - | |
| Gender | ||||||
| Male | 1 | 1.160–1.792 4.112 | 0.441 | 0.538 | - | - |
| Female | 2 | 2.096–4.892 9.084 | 0.441 | 0.013 | 83.8% | |
| Both gender | 5 | -1.476–4.839 1.887 | 0.390 | 0.042 | 59.5% | |
Studies eligible for inclusion in the systematic review and meta-analysis.
Publication bias
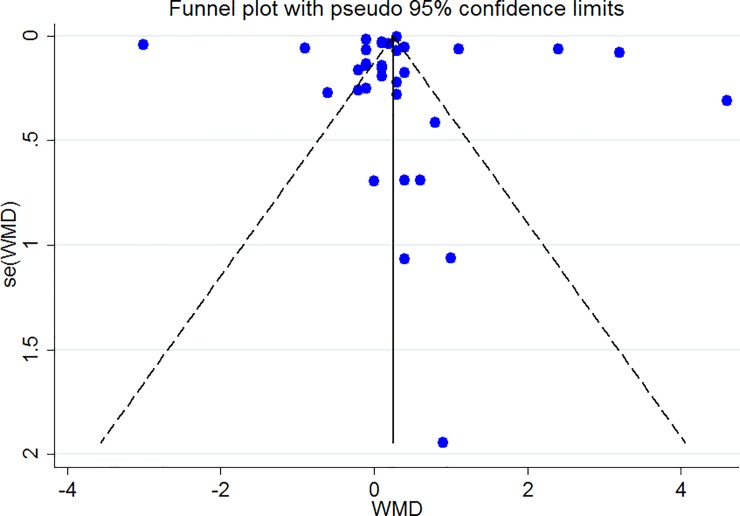
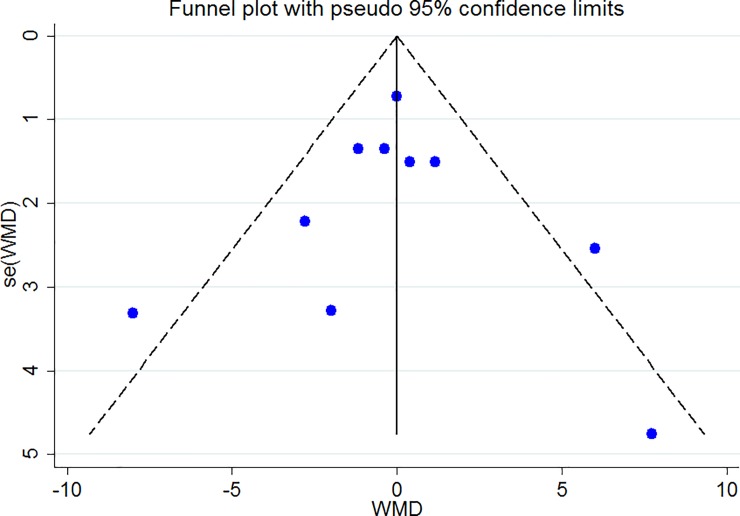
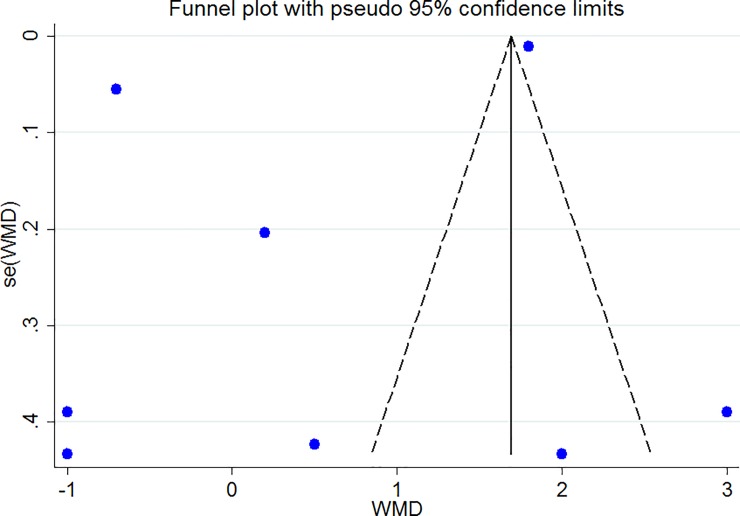
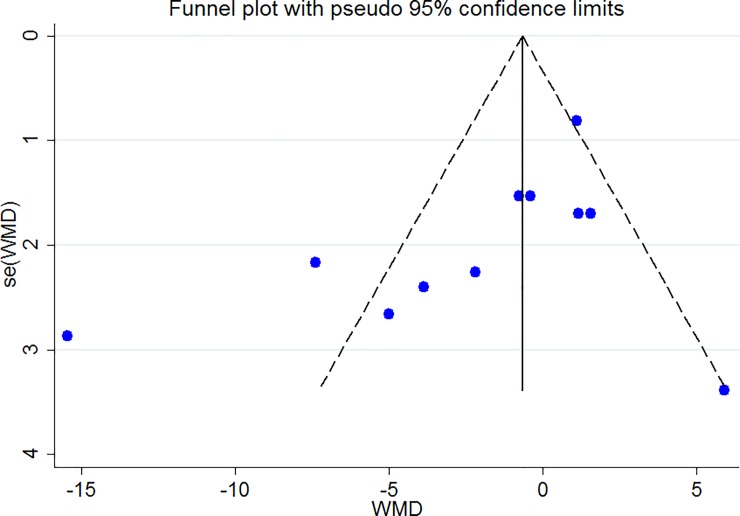
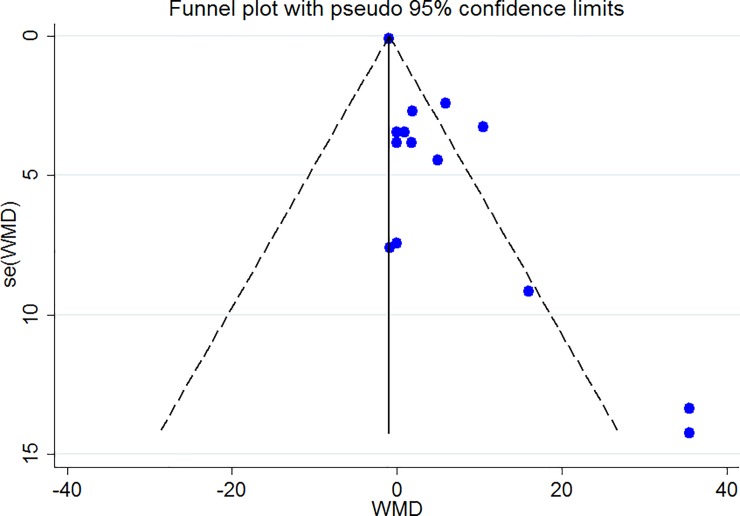
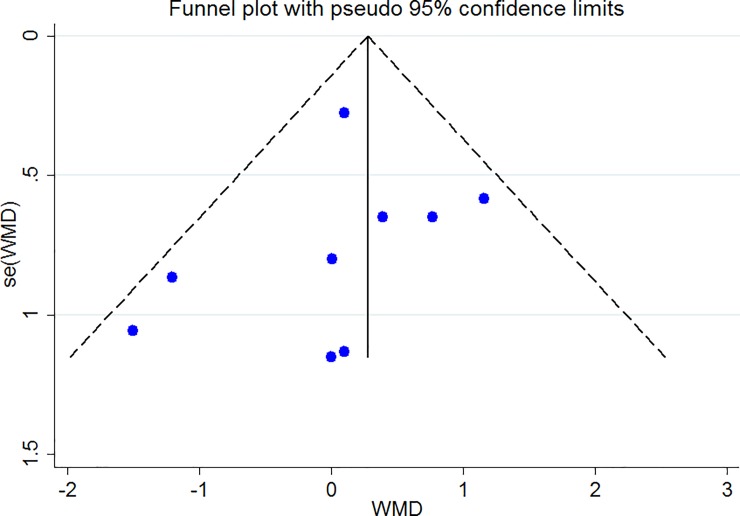
The Funnel plots revealed moderate asymmetry (Figs 10–15). However, the Begg’s and Egger’s tests provided no evidence of substantial publication bias for all of the variables. The provided values are as follows: BMI, Egger’s test (P = 0.771) and Begg’s test (P = 0. 159); WC, Egger’s test (P = 0.246) and Begg’s test (P = 0. 615); TC, Egger’s test (P = 0.083) and Begg’s test (P = 0.10); TG, Egger’s test (P = 0.001) and Begg’s test (P = 0.701); HDL, Egger’s test (P = 0.649) and Begg’s test (P = 0.178); LDL, Egger’s test (P = 0.629) and Begg’s test (P = 0.531).
Fig 10. Begg's funnel plots (with pseudo 95% CIs) of the WMD versus the se (WMD) of the association between BMI, PRAL and NEAP.
Fig 15. Begg's funnel plots (with pseudo 95% CIs) of the WMD versus the se (WMD) of the association between LDL, PRAL and NEAP.
Fig 11. Begg's funnel plots (with pseudo 95% CIs) of the WMD versus the se (WMD) of the association between WC, PRAL and NEAP.
Fig 12. Begg's funnel plots (with pseudo 95% CIs) of the WMD versus the se (WMD) of the the association between TC, PRAL and NEAP.
Fig 13. Begg's funnel plots (with pseudo 95% CIs) of the WMD versus the se (WMD) of the association between TG, PRAL and NEAP.
Fig 14. Begg's funnel plots (with pseudo 95% CIs) of the WMD versus the se (WMD) of the association between HDL, PRAL and NEAP.
Discussion
In the current meta-analysis, we summarized the results of studies reporting the association between PRAL, NEAP and body mass index, waist circumference, lipid profile and the prevalence of obesity. Accordingly, being in the highest category of PRAL scores was associated with higher TG and higher prevalence of obesity compared with lowest category. No association between BMI, WC and other serum lipids with PRAL or NEAP was observed. In subgroup analysis, increased PRAL scores in women and increased NEAP scores in men were associated with higher BMI. Animal foods including meat, fish, egg, chicken, cheese and also cereals are rich in sulfur containing amino acids, phosphorous and chloride are potentially acid formers; while vegetables and fruits high in malate, citrate and glutamate are potentially base formers therefore, animal based-foods and high contents in western diets are potentially considered as most important acid-producer diets and are associated with higher risk of insulin resistance, high blood pressure and diabetes as established in numerous works [10]. Accordingly, western dietary pattern with high dietary acid load content, is a potent inducer of central obesity and metabolic syndrome; several studies had revealed significant relationships between western dietary pattern and the increased risk of MetS, cholesterol and increased waist circumference and BMI. Accordingly, western dietary pattern with high content of red meat, eggs, and refined grains is associated with increased risk of obesity and increased levels of blood sugar, systolic blood pressure, triglycerides, and reduced levels of HDL [45–47]. Higher prevalence of obesity in higher categories of PRAL and NEAP could also be a attributed to the possible adipogenic effects of higher dietary acid load; in the study by Li et al. [48] among 29520 Chinese adults aged 18–70 years and higher prevalence of obesity in higher versus lower quintiles of PRAL was observed. Although we did not observed association between PRAL and NEAP with BMI in total analysis, however, in subgroup analysis of men and women separately, the PRAL-BMI association was significant for women and the NEAP-BMI association was significant for men. These gender-specific results might be due to the difference in the lean body mass; it has been demonstrate that higher dietary acid load reduces lean body mass only among women and not in men and finally leads to higher body fat synthesis [15] and that more alkalinogenic diets are associated with greater skeletal muscle mass among women [40]. Another possible explanation is the difference in sex-hormones affecting acid-base balance [49]. Acidosis leads to loss of muscle mass through reducing protein synthesis and increasing proteolysis and amino acid oxidation, mediated via the ubiquitin proteasome system or via in IGF-1 signaling alterations [50]. This impaired acid-base balance is possibly the reason of reduced calcaneal broadband ultrasound attenuation and bone density in women and not in men [39]. In other word, it will be better to evaluate the association between dietary acid load indices and fat mass or fat free mass as indicators of adiposity instead of BMI to better elucidate the obesity-dietary acid load associations. In the current meta-analysis we also observed a positive association between PRAL and TG. The underlying mechanisms of increased TG concentrations in higher scores of PRAL are not well elucidated; however, several proposed mechanisms might be raised cortisol secretion and reduced insulin sensitivity and secretion and their consequent lipid disorders [35]. As mentioned in the results section, dietary assessment tool and continent could be a source of heterogeneity among observed association. In the current meta-analysis, PRAL and NEAP calculation was based on self-reported data gathered by 24 hours recall method, 24 hours record method and food frequency questionnaire which may be a potential source of bias. Moreover, difference in the items of the FFQ might be a source of heterogeneity; as described previously, the FFQ items ranged from 63 to 168 items and the local foods in the FFQ could also affect the heterogeneity [51], although, almost all of the included studies used valid and reliable FFQs. FFQ covers a wide range of dietary ingredients and is more accurate than 24-hours recall method reflecting usual dietary intake in a short period of time; it has been confirmed that FFQ could be more helpful in evaluating the diet-disease relationships [52]. Another source of heterogeneity, the continent, presents the possible role of geographical distribution, genetic background and cultural factors influencing the association between dietary acid load and metabolic risk factors [53–57]. The current meta-analysis has several limitations and strengths; the current meta-analysis included the results of observational studies with the cross-sectional or cohort design which makes the causal inference impossible; although, the studies were large population-based studies with acceptable quality. Moreover, the PRAL and NEAP were calculated based on self-reported data gathered by 24 hours recall method, food record or food frequency questionnaire which might be potential sources of bias. However, our study, based on our knowledge, is the first meta-analysis evaluating the association between dietary acid load as both PRAL and NEAP scores with a wide range of obesity related parameters including BMI, WC, LDL, HDL, TG, TC and the prevalence of obesity. In conclusion, in the current meta-analysis, we found a positive association between TG and PRAL and a gender-specific associations between PRAL, NEAP and BMI while no association between dietary acid load and other parameters were reported.
Supporting information
(XLSX)
(DOC)
Data Availability
All relevant data are within the manuscript and Supporting Information files.
Funding Statement
The current work has been supported by a grant from Tabriz University of Medical Sciences.
References
- 1.Obesity and overweight 2018 [Available from: https://www.who.int/news-room/fact-sheets/detail/obesity-and-overweight.
- 2.Colditz G. Economic costs of obesity and inactivity. Medicine and Science in Sport and Exercise. 1999; 31 (11): S663–S7. [DOI] [PubMed] [Google Scholar]
- 3.Khaki Khatibi F, Yaghoubi A, Zarghami N, Rahbani M, Babaie H. Evaluation of hs-CRP, antioxidant markers and MDA in patients of coronary artery disease (CAD) containing non-smokers and non-diabetics. J Cardiovasc Thorac Res 2011; 2(4):13–8. [Google Scholar]
- 4.Amodu A, Abramowitz MK. Dietary acid, age, and serum bicarbonate levels among adults in the United States. Clinical Journal of the American Society of Nephrology. 2013;8(12):2034–42. 10.2215/CJN.03600413 [DOI] [PMC free article] [PubMed] [Google Scholar]
- 5.Akter S, Eguchi M, Kurotani K, Kochi T, Pham NM, Ito R, et al. High dietary acid load is associated with increased prevalence of hypertension: the Furukawa Nutrition and Health Study. Nutrition (Burbank, Los Angeles County, Calif). 2015;31(2):298–303. [DOI] [PubMed] [Google Scholar]
- 6.Akter S, Eguchi M, Kuwahara K, Kochi T, Ito R, Kurotani K, et al. High dietary acid load is associated with insulin resistance: The Furukawa Nutrition and Health Study. Clinical Nutrition (Edinburgh, Scotland). 2016;35(2):453–9. [DOI] [PubMed] [Google Scholar]
- 7.Iwase H, Tanaka M, Kobayashi Y, Wada S, Kuwahata M, Kido Y, et al. Lower vegetable protein intake and higher dietary acid load associated with lower carbohydrate intake are risk factors for metabolic syndrome in patients with type 2 diabetes: Post-hoc analysis of a cross-sectional study. Journal of Diabetes Investigation. 2015;6(4):465–72. 10.1111/jdi.12326 [DOI] [PMC free article] [PubMed] [Google Scholar]
- 8.Taylor EN, Curhan GC. Body size and 24-hour urine composition. American journal of kidney diseases: the official journal of the National Kidney Foundation. 2006;48(6):905–15. [DOI] [PubMed] [Google Scholar]
- 9.Berkemeyer S. Acid-base balance and weight gain: are there crucial links via protein and organic acids in understanding obesity? Medical Hypotheses. 2009;73(3):347–56. 10.1016/j.mehy.2008.09.059 [DOI] [PubMed] [Google Scholar]
- 10.Adeva MM, Souto G. Diet-induced metabolic acidosis. Clinical Nutrition ESPEN. 2011;30 (416–21). [DOI] [PubMed] [Google Scholar]
- 11.Han E, Kim G, Hong N, Lee YH. Association between dietary acid load and the risk of cardiovascular disease: nationwide surveys (KNHANES 2008–2011). 2016;15(1):122. [DOI] [PMC free article] [PubMed] [Google Scholar]
- 12.Remer T, Manz F. Estimation of the renal net acid excretion by adults consuming diets containing variable amounts of protein. The American Journal of Clinical Nutrition. 1994;59(6):1356e61. 10.1093/ajcn/59.6.1356 [DOI] [PubMed] [Google Scholar]
- 13.Frassetto LA, Todd KM, Morris RC Jr, Sebastian A. Estimation of net endogenous noncarbonic acid production in humans from diet potassium and protein contents. The American Journal of Clinical Nutrition. 1998;68(3):576e83. 10.1093/ajcn/68.3.576 [DOI] [PubMed] [Google Scholar]
- 14.Fagherazzi G, Vilier A, Bonnet F, Lajous M, Balkau B, Boutron-Ruault MC, et al. Dietary acid load and risk of type 2 diabetes: The E3N-EPIC cohort study. Diabetologia. 2014;57(2):313–20. 10.1007/s00125-013-3100-0 [DOI] [PubMed] [Google Scholar]
- 15.Faure AM, Fischer K, Dawson-Hughes B, Egli A, Bischoff-Ferrari HA. Gender-specific association between dietary acid load and total lean body mass and its dependency on protein intake in seniors. Osteoporosis international: a journal established as result of cooperation between the European Foundation for Osteoporosis and the National Osteoporosis Foundation of the USA. 2017;28(12):3451–62. [DOI] [PubMed] [Google Scholar]
- 16.Gaede J, Nielsen T, Madsen ML, Toft U, Jorgensen T, Overvad K, et al. Population-based studies of relationships between dietary acidity load, insulin resistance and incident diabetes in Danes. Nutrition Journal. 2018;17(1):91 10.1186/s12937-018-0395-1 [DOI] [PMC free article] [PubMed] [Google Scholar]
- 17.Haghighatdoost F, Najafabadi MM, Bellissimo N, Azadbakht L. Association of dietary acid load with cardiovascular disease risk factors in patients with diabetic nephropathy. Nutrition (Burbank, Los Angeles County, Calif). 2015;31(5):697–702. [DOI] [PubMed] [Google Scholar]
- 18.Ikizler HO, Zelnick L, Ruzinski J, Curtin L, Utzschneider KM, Kestenbaum B, et al. Dietary Acid Load is Associated With Serum Bicarbonate but not Insulin Sensitivity in Chronic Kidney Disease. Journal of renal nutrition: the official journal of the Council on Renal Nutrition of the National Kidney Foundation. 2016;26(2):93–102. [DOI] [PMC free article] [PubMed] [Google Scholar]
- 19.Jia T, Byberg L, Lindholm B, Larsson TE, Lind L, Michaëlsson K, et al. Dietary acid load, kidney function, osteoporosis, and risk of fractures in elderly men and women. Osteoporosis International. 2014;26(2):563–70. 10.1007/s00198-014-2888-x [DOI] [PubMed] [Google Scholar]
- 20.Akter S, Kurotani K, Kashino I, Goto A, Mizoue T, Noda M, et al. High Dietary Acid Load Score Is Associated with Increased Risk of Type 2 Diabetes in Japanese Men: The Japan Public Health Center-based Prospective Study. The Journal of Nutrition. 2016;146(5):1076–83. 10.3945/jn.115.225177 [DOI] [PubMed] [Google Scholar]
- 21.van den Berg E, Engberink MF, Brink EJ, van Baak MA, Joosten MM, Gans ROB, et al. Dietary acid load and metabolic acidosis in renal transplant recipients. Clinical Journal of the American Society of Nephrology. 2012;7(11):1811–8. 10.2215/CJN.04590512 [DOI] [PMC free article] [PubMed] [Google Scholar]
- 22.Jayedi A, Shab-Bidar S. Dietary acid load and risk of type 2 diabetes: A systematic review and dose-response meta-analysis of prospective observational studies. Clinical Nutrition ESPEN. 2018;23:10–8. 10.1016/j.clnesp.2017.12.005 [DOI] [PubMed] [Google Scholar]
- 23.Miller SA, Forrest JL. Enhancing your practice through evidence-based decision making: PICO, learning how to ask good questions. J Evidence-Based Dental Pract. 2001. October;1 (2):136–41. 10.1016/S1532-3382(01)70024-3 [DOI] [Google Scholar]
- 24.Higgins JP, Green S, editors. Wiley Online Library. 2008. Cochrane handbook for systematic reviews of interventions. [Google Scholar]
- 25.Stang A. Critical evaluation of the Newcastle-Ottawa scale for the assessment of the quality of nonrandomized studies in meta-analyses. Eur J Epidemiol. 2010;25(9):603–5. 10.1007/s10654-010-9491-z [DOI] [PubMed] [Google Scholar]
- 26.Higgins JP, Thompson SG. Quantifying heterogeneity in a meta-analysis. Stat Med 2002;21:1539–58. 10.1002/sim.1186 [DOI] [PubMed] [Google Scholar]
- 27.Akter S, Nanri A, Mizoue T, Noda M, Sawada N, Sasazuki S, et al. Dietary acid load and mortality among Japanese men and women: the Japan Public Health Center-based Prospective Study. The American Journal of Clinical Nutrition. 2017;106(1):146–54. 10.3945/ajcn.117.152876 [DOI] [PubMed] [Google Scholar]
- 28.Bahadoran Z, Mirmiran P, Khosravi H, Azizi F. Associations between Dietary Acid-Base Load and Cardiometabolic Risk Factors in Adults: The Tehran Lipid and Glucose Study. Endocrinology and Metabolism (Seoul, Korea). 2015;30(2):201–7. [DOI] [PMC free article] [PubMed] [Google Scholar]
- 29.Banerjee T, Tucker K, Griswold M, Wyatt SB, Harman J, Young B, et al. Dietary Potential Renal Acid Load and Risk of Albuminuria and Reduced Kidney Function in the Jackson Heart Study. Journal of Renal Nutrition: the official journal of the Council on Renal Nutrition of the National Kidney Foundation. 2018; 28(4):251–8. [DOI] [PubMed] [Google Scholar]
- 30.Chan R, Leung J, Woo J. Association between estimated net endogenous acid production and subsequent decline in muscle mass over four years in ambulatory older Chinese people in Hong Kong: A prospective cohort study. Journals of Gerontology—Series A Biological Sciences and Medical Sciences. 2014;70(7):905–11. [DOI] [PubMed] [Google Scholar]
- 31.Engberink MF, Bakker SJL, Brink EJ, Van Baak MA, Van Rooij FJA, Hofman A, et al. Dietary acid load and risk of hypertension: The Rotterdam study. American Journal of Clinical Nutrition. 2012;95(6):1438–44. 10.3945/ajcn.111.022343 [DOI] [PubMed] [Google Scholar]
- 32.Kiefte-de Jong JC, Li Y, Chen M, Curhan GC, Mattei J, Malik VS, et al. Diet-dependent acid load and type 2 diabetes: pooled results from three prospective cohort studies. Diabetologia. 2017;60(2):270–9. 10.1007/s00125-016-4153-7 [DOI] [PMC free article] [PubMed] [Google Scholar]
- 33.Ko BJ, Chang Y, Ryu S, Kim EM, Lee MY, Hyun YY, et al. Dietary acid load and chronic kidney disease in elderly adults: Protein and potassium intake. PloS One. 2017;12(9). [DOI] [PMC free article] [PubMed] [Google Scholar]
- 34.Krupp D, Esche J, Mensink GBM, Klenow S, Thamm M, Remer T. Dietary acid load and potassium intake associate with blood pressure and hypertension prevalence in a representative sample of the German adult population. Nutrients. 2018;10(1). [DOI] [PMC free article] [PubMed] [Google Scholar]
- 35.Kucharska AM, Szostak-Wȩgierek DE, Waskiewicz A, Piotrowski W, Stepaniak U, Pajak A, et al. Dietary acid load and cardiometabolic risk in the Polish adult population. Advances in Clinical and Experimental Medicine. 2018;27(10):1347–54. 10.17219/acem/69733 [DOI] [PubMed] [Google Scholar]
- 36.Luis D, Huang X, Riserus U, Sjögren P, Lindholm B, Arnlöv J, et al. Estimated dietary acid load Is not associated with blood pressure or hypertension incidence in men who are approximately 70 years old. Journal of Nutrition. 2015;145(2):315–21. 10.3945/jn.114.197020 [DOI] [PubMed] [Google Scholar]
- 37.Murakami K, Sasaki S, Takahashi Y, Uenishi K, Yamasaki M, Hisatomi Y, et al. Association between dietary acid-base load and cardiometabolic risk factors in young Japanese women. British Journal of Nutrition. 2008;100(3):642–51. 10.1017/S0007114508901288 [DOI] [PubMed] [Google Scholar]
- 38.Rebholz CM, Coresh J, Grams ME, Steffen LM, Anderson CAM, Appel LJ, et al. Dietary Acid Load and Incident Chronic Kidney Disease: Results from the ARIC Study. American Journal of Nephrology. 2015;42(6):427–35. 10.1159/000443746 [DOI] [PMC free article] [PubMed] [Google Scholar]
- 39.Welch AA, Bingham SA, Reeve J, Khaw KT. More acidic dietary acid-base load is associated with reduced calcaneal broadband ultrasound attenuation in women but not in men: results from the EPIC-Norfolk cohort study. The American journal of clinical nutrition. 2007;85(4):1134–41. 10.1093/ajcn/85.4.1134 [DOI] [PubMed] [Google Scholar]
- 40.Welch AA, MacGregor AJ, Skinner J, Spector TD, Moayyeri A, Cassidy A. A higher alkaline dietary load is associated with greater indexes of skeletal muscle mass in women. Osteoporosis international: a journal established as result of cooperation between the European Foundation for Osteoporosis and the National Osteoporosis Foundation of the USA. 2013;24(6):1899–908. [DOI] [PubMed] [Google Scholar]
- 41.Wynn E, Lanham-New SA, Krieg MA, Whittamore DR, Burckhardt P. Low estimates of dietary acid load are positively associated with bone ultrasound in women older than 75 years of age with a lifetime fracture. The Journal of nutrition. 2008;138(7):1349–54. 10.1093/jn/138.7.1349 [DOI] [PubMed] [Google Scholar]
- 42.Xu H, Akesson A, Orsini N, Hakansson N, Wolk A, Carrero JJ. Modest U-Shaped Association between Dietary Acid Load and Risk of All-Cause and Cardiovascular Mortality in Adults. The Journal of nutrition. 2016;146(8):1580–5. 10.3945/jn.116.231019 [DOI] [PubMed] [Google Scholar]
- 43.Xu H, Jia T, Huang X, Riserus U, Cederholm T, Arnlov J, et al. Dietary acid load, insulin sensitivity and risk of type 2 diabetes in community-dwelling older men. Diabetologia. 2014;57(8):1561–8. 10.1007/s00125-014-3275-z [DOI] [PubMed] [Google Scholar]
- 44.Moghadam SK, Bahadoran Z, Mirmiran P, Tohidi M, Azizi F. Association between dietary acid load and insulin resistance: Tehran Lipid and Glucose Study. Preventive nutrition and food science. 2016;21(2):104–9. 10.3746/pnf.2016.21.2.104 [DOI] [PMC free article] [PubMed] [Google Scholar]
- 45.Ambrosini GL, Huang R-C, Mori TA, Hands BP, O’Sullivan TA, de Klerk NH, et al. Dietary patterns and markers for the metabolic syndrome in Australian adolescents. Nutr Metab Cardiovasc Dis. 2010; 20(4):274–83. 10.1016/j.numecd.2009.03.024 [DOI] [PubMed] [Google Scholar]
- 46.McNaughton SA, Ball K, Mishra GD, Crawford DA. Dietary patterns of adolescents and risk of obesity and hypertension. J Nutr. 2008; 138(2):364–70. 10.1093/jn/138.2.364 [DOI] [PubMed] [Google Scholar]
- 47.Shang X, Li Y, Liu A, Zhang Q, Hu X, Du S, et al. Dietary pattern and its association with the prevalence of obesity and related cardiometabolic risk factors among Chinese children. PLoS ONE. 2012;7(8):e43183 10.1371/journal.pone.0043183 [DOI] [PMC free article] [PubMed] [Google Scholar]
- 48.Li Y, He Y, Wang D, Gao X. Association between dietary acid-based load and obesity in Chinese adults. The FASEB Journal. 2012;26(1_supplement):826.4–4. [Google Scholar]
- 49.Orr-Walker BJ, Horne AM, Evans MC, Grey AB, Murray MA, McNeil AR. Hormone replacement therapy causes a respiratory alkalosis in normal postmenopausal women. J Clin Endocrinol Metabol 1999;84:1997e2001. [DOI] [PubMed] [Google Scholar]
- 50.Dawson-Hughes B, Harris SS, Ceglia L. Alkaline diets favor lean tissue mass in older adults. The American journal of clinical nutrition. 2008;87(3):662–5. 10.1093/ajcn/87.3.662 [DOI] [PMC free article] [PubMed] [Google Scholar]
- 51.Mueller M, Hobiger S, Jungbauer A. Anti-inflammatory activity of extracts from fruits, herbs and spices. Food Chemistry. 2010;122 (4):987–96. [Google Scholar]
- 52.Shim JS, Oh K, Kim HC. Dietary assessment methods in epidemiologic studies. Epidemiol Health. 2014;36:1–8. [DOI] [PMC free article] [PubMed] [Google Scholar]
- 53.Slimani N, Fahey M, Welch A, Wirfält E, Stripp C, Bergström E. Diversity of dietary patterns observed in the European Prospective Investigation into Cancer and Nutrition (EPIC) project. Public Health Nutr. 2002; 5:1311–28. 10.1079/PHN2002407 [DOI] [PubMed] [Google Scholar]
- 54.Azizi H, Asadollahi KH, Esmaeili ED, Mirzapoor M. Iranian dietary patterns and risk of colorectal cancer. HPP 2015; 5(1), 72–80 10.15171/hpp.2015.009 [DOI] [PMC free article] [PubMed] [Google Scholar]
- 55.Arefhosseini SR, Ebrahimi-Mameghani M, Naeimi AF, et al. Lifestyle modification through dietary intervention: Health promotion of patients with non-alcoholic fatty liver disease. HPP 2011; 1(2): 147–154. 10.5681/hpp.2011.016 [DOI] [PMC free article] [PubMed] [Google Scholar]
- 56.Pezeshkian M, Darbin A, Rashidi MR, Vatankhah A, Golmohammadi Z, Afrasiabi A, et al. The effect of atherogenic diet with or without enzyme inhibitors on the incidence and progress of atherosclerosis in rabbits. J Cardiovasc Thorac Res 2011; 3 (1):7–10. [Google Scholar]
- 57.Aggarwal A, Aggarwal S, Sharma V. Cardiovascular risk factors in young patients of coronary artery disease: differences over a decade. J Cardiovasc Thorac Res 2014; 6(3): 169–173. 10.15171/jcvtr.2014.006 [DOI] [PMC free article] [PubMed] [Google Scholar]
Associated Data
This section collects any data citations, data availability statements, or supplementary materials included in this article.
Supplementary Materials
(XLSX)
(DOC)
Data Availability Statement
All relevant data are within the manuscript and Supporting Information files.


