

Abstract
Chronic inflammation is postulated to be involved in development of end stage renal disease (ESRD) in diabetes, but which specific circulating inflammatory proteins contribute to this risk remains unknown. To study this we examined 194 circulating inflammatory proteins in subjects from three independent cohorts with Type 1 and Type 2 diabetes. In each cohort we identified an extremely robust Kidney Risk Inflammatory Signature (KRIS) consisting of 17 novel proteins enriched for TNF Receptor Superfamily members that was associated with a 10-year risk of ESRD. All these proteins had a systemic, non-kidney source. Our prospective study findings provide strong evidence that KRIS proteins contribute to the inflammatory process underlying ESRD development in both types of diabetes. These proteins may be used as new therapeutic targets, new prognostic tests for high risk of ESRD and as surrogate outcome measures where changes in KRIS levels during intervention can reflect the tested therapy’s effectiveness.
One Sentence Summary:
Proteomic profiling of circulating proteins in subjects from three independent cohorts with type 1 and type 2 diabetes, identified an extremely robust inflammatory signature, consisting of 17 proteins enriched for TNF Receptor Superfamily members that was associated with a 10-year risk of end-stage renal disease.
Introduction
Diabetic kidney disease (DKD) is responsible for more than half of all new cases of end-stage renal disease (ESRD) in the US1. Over the last two decades, despite improvements in glycemic control and advances in reno-protective therapies, the reduction in ESRD rates among subjects with diabetes has been limited.
Chronic inflammation is implicated in the progression of DKD to ESRD, but mechanisms underlying it are largely unknown. Little consideration has been given to whether this process varies according to type of diabetes or stage of DKD. Previous human studies examining the role of inflammation had major limitations. They were mainly cross-sectional, focused on limited numbers of candidate inflammatory proteins, and did not follow participants to ESRD2,3. Our findings from follow-up studies draw attention to the importance of systemic inflammatory factors as predictors of DKD progression. We showed a strong association between circulating tumor necrosis factor receptors 1 and 2 (TNF-R1 and TNF-R2) and rate of renal decline or time of onset of ESRD4–6. Our findings were replicated in multiple studies7–11. Recently we showed that plasma TNF-R1 itself is a good prognostic marker of progression to ESRD in both types of diabetes12.
Our prior findings, however, do not establish which circulating inflammatory proteins are involved in the etiology of DKD, as prognostic modeling overlooks inflammatory proteins that are weaker or collinear with the strongest drivers of the disease process. Therefore, the prognostic approach limits our ability to identify other critical inflammatory proteins involved in DKD progression, which might be important for identifying new therapeutic targets. Accordingly, the aim of the present study was to identify plasma inflammatory proteins associated with the development of ESRD in the Joslin Kidney Study Type 1 Diabetes (T1D) and Type 2 Diabetes (T2D) cohorts so an etiological model for the putative inflammatory process could be developed. We accomplished this aim by measuring concentrations of 194 inflammatory proteins using a custom-designed SOMAscan platform13,14. This array comprised most of the circulating inflammatory proteins known in the literature and most proteins previously studied in the context of DKD. To replicate the Joslin findings, we conducted an identical proteomics study in an independent cohort of Pima Indians with T2D. In all three cohorts followed for 8–11 years, the outcome measures were time to onset of ESRD and renal function decline measured as GFR slope. The latter assumed that long term progressive renal decline is a constant linear loss of renal function15.
Results
Characteristics of discovery, validation and replication cohorts:
The study comprised two independent cohorts derived from the ongoing Joslin Kidney Study12: a Discovery Joslin Cohort of 219 subjects with T1D and a Validation Joslin Cohort of 144 subjects with T2D. Ninety-six percent of T1D subjects and 82% of T2D subjects were Caucasian. Study subjects had impaired kidney function (average estimated GFR 45±11 ml/min/1.73m2) at baseline and were followed for median 8 years. A replication study was conducted in a cohort of 162 subjects with T2D who participated in the Pima Indians Study16. These subjects were followed for median 11 years. In contrast to the Joslin cohorts, which had impaired renal function (late DKD) at baseline, the Pima Cohort had normal renal function (average GFR=155 ml/min) (very early stage of DKD).
Baseline and follow-up characteristics of the three cohorts are shown in Table 1. The cohorts differed with regard to clinical characteristics except for elevated albuminuria measured as albumin-to-creatinine ratio (ACR) and rate of renal function loss over time estimated as GFR slopes, the latter two were similar among the cohorts. For the present study, in each cohort only cases of ESRD that developed during the first 10 years after study entry were considered. We found the following number of ESRD cases: 108 in discovery, 35 in validation and 38 in replication cohorts.
Table 1:
Characteristics of the three independent Study Cohorts
| DISCOVERY COHORT | VALIDATION COHORT | REPLICATION COHORT | |
|---|---|---|---|
| Characteristics | T1D Joslin | T2D Joslin | T2D Pima |
| (n=219) | (n=144) | (n=162) | |
| At baseline | |||
| Male, n (%) | 52% | 35% | 72% |
| Age (yr) | 45±10 | 60±6 | 45±10 |
| BMI (kg/m2) | 26.6±5.9 | 33.7±7.2 | 35.3±8.1 |
| Systolic BP (mmHg) | 135±20 | 140±20 | 124±14 |
| Duration of diabetes (yr) | 30±9 | 16±9 | 15.1±6.3 |
| HbA1c (%) | 8.8±1.7 | 7.6±1.6 | 9.4±2.4 |
| ACR (µg albumin/mg creatinine in urine) | 1262±1442 | 851±1257 | 709±1772 |
| GFR* | 43.0±10. | 49.1±11. | 155±53 |
| During follow-up | |||
| GFR slope* | −5.6±6.4 | −4.0±4.3 | −6.6±9.0 |
| New Cases of ESRD (n) during 10-year follow-up | 108 | 35 | 38 |
| Person-years of observation | 1274 | 909 | 1415 |
| Rate par 100/ person-yrs (95%CI) | 8.5 (7.0, 10.2) | 3.9 (2.9, 5.5) | 2.7 (1.7, 4.1) |
Legend:
T1D - Type 1 Diabetes, T2D - Type 2 Diabetes, BMI - body mass index, BP - blood pressure, HbA1c - Hemoglobin, ACR – albuminuria expressed as albumin to creatinine ratio, GFR -glomerular filtration rate.
In Joslin Cohorts GFR was estimated using serum creatinine concentrations and was expressed as mL/min/1.73m3 for baseline or mL/min/1.73m3/year for slope. In Pima Cohort GFR was measured directly using urinary clearance of iothalamate and was expressed as mL/min for baseline or mL/min/year for slope.
ESRD - End Stage Renal Disease. Incidence rate of ESRD is accompanied by 95% Confidence Interval.
Mean and standard deviation, median (25th, 75th percentile) or count (proportion) measures are provided as applicable.
Search for Kidney Risk Inflammatory Signature (KRIS) associated with development of ESRD
Baseline plasma specimens from the Joslin Cohorts and baseline serum specimens from the Pima Cohort were subjected to proteomics analysis using a custom-designed SOMAscan platform containing 194 inflammatory proteins. In the T1D Discovery Joslin Cohort, baseline plasma concentrations of 35 proteins were significantly higher in subjects who developed ESRD than in those who did not (-log10p >3.6, nominal p value after Bonferroni correction). Distribution of fold changes according to p values in this cohort is shown as a volcano plot in Figure 1A. In the T2D Validation Joslin Cohort, 17 of the 35 proteins had significantly higher concentrations in subjects who developed ESRD compared to those who did not (-log10p>2). These 17 proteins (indicated as red dots in Figure 1A) are considered in further analyses and are referred to as the Kidney Risk Inflammatory Signature (KRIS). Remarkably, in the T2D Replication Pima Cohort baseline serum concentration of 16 of the KRIS proteins were also significantly higher in subjects who developed ESRD compared with those who did not develop ESRD (at least at p<0.05).
Figure 1. Aptamer-based proteomic discovery of a circulating Kidney Risk Inflammatory Signature (KRIS) associated with long-term risk of development of ESRD in three prospective cohorts. (A) Multivariate screening in the T1D Joslin Cohort (Discovery, n=219) and T2D Joslin Cohort (Validation, n=144) – volcano plot. (B) KRIS proteins and 10-year risk of developing ESRD in Joslin Cohorts (n=363) and in Pima Cohort (Replication, n=162) in the adjusted Cox models. Legend.
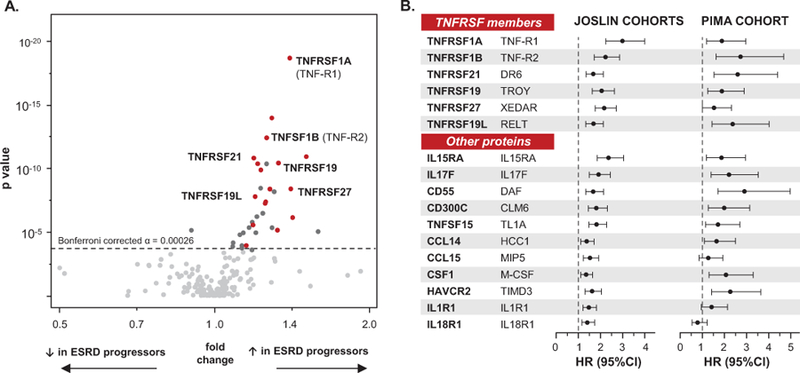
(A) Effect sizes (fold change – x-axis) and strengths of associations (p value – y axis) with ESRD risk are presented in T1D Joslin Discovery Cohort. Fold change is a ratio of mean concentration of a protein in subjects who developed ESRD over mean concentration of the same protein in subjects who did not develop ESRD during follow-up. To test significance two-group comparison in the linear regression model with caseness as an independent variable and protein concentrations transformed to their base 10 logarithms as the respective dependent variable was used (two sided p value). Significant thresholds used: in T1D Cohort: α = 0.00026 (Bonferroni corrected for 194 proteins measured) and in T2D Joslin Validation Cohort: α=0.01. Seventeen significant proteins (KRIS), for which the associations were confirmed in the two Joslin Cohorts, are marked with red dots; proteins significant in T1D Joslin Cohort, but not confirmed in T2D Joslin Cohort are marked with dark grey dots; non-significant proteins are marked with grey dots. Please see also Table 2. HGNC - protein symbol according to the HUGO Gene Nomenclature Committee.
(B) Effect of KRIS proteins on risk of ESRD in the combined T1D and T2D Joslin Cohorts and in Pima Indians Cohort. Cox proportional hazards model analyzed time to onset of ESRD within 10 years. Effect is shown as hazard ratio per one tertile change in circulating concentration of specific KRIS protein. Models are controlled for type of diabetes (Joslin only), age, HbA1c and eGFR (Joslin) or GFR (Pima). Comprehensive models considering a number of adjustments are presented in the Supplementary Table 2.
The list of 17 KRIS proteins and fold changes for each of them in the three cohorts are shown in Table 2. The proteins were grouped to 6 TNFRSF members and 11 other proteins that included 4 receptors and 7 secreted proteins. Despite different types of diabetes, different clinical characteristics and different ethnicity the magnitude of fold changes for these proteins were similar in the three study cohorts. Interestingly the 17 KRIS proteins were significantly enriched in 6 (35%) TNFRSF members. Among all 194 inflammatory proteins examined, these TNFRSF members comprised only 12% (Fisher exact p value p=0.007). We saw no significant enrichment or depletion for other categories of inflammatory proteins (Extended Data 1). Results for the remaining 177 inflammatory proteins examined, which had no impact on the risk of ESRD or had impact in one but not in both Joslin Cohorts, are presented in Supplementary Table 1.
Table 2: List of 17 circulating proteins comprising Kidney Risk Inflammatory Signature (KRIS) associated with development of ESRD in the three study cohorts.
Effect sizes (fold change) and strengths of associations (as logarithmically base 10 transformed p values) with risk of ESRD are presented. Proteins are grouped to TNF Receptors Superfamily (TNFRSF) members and to other inflammatory proteins. Findings for 177 inflammatory proteins (non-KRIS) not associated with ESRD or not replicated in Joslin T1D and T2D cohorts are presented in the Supplementary Table 1.
| DISCOVERY | VALIDATION | REPLICATION | |||||
|---|---|---|---|---|---|---|---|
| T1D Joslin n=219 | T2D Joslin n=144 | T2D Pima n=162 | |||||
| Protein name | Effect size | Significance (− log10 p) | Effect size | Significance (− log10 p) | Effect size | Significance (− log10 p) | |
| HGNC | Alternate | Ratio | Nominal | Ratio | Nominal | Ratio | Nominal |
| TNRSF members | |||||||
| TNFRSF1A | TNF-R1 | 1.40 | 18.7 | 1.39 | 7.3 | 1.28 | −3.8 |
| TNFRSF1B | TNF-R2 | 1.27 | 12.4 | 1.25 | 4.9 | 1.38 | −7.2 |
| TNFRSF21 | DR6 | 1.19 | 10.8 | 1.2 | 3.9 | 1.29 | −4.9 |
| TNFRSF19 | TAJ | 1.33 | 10.4 | 1.33 | 3.7 | 1.30 | −2.7 |
| TNFRSF27 | XEDAR | 1.41 | 8.4 | 1.22 | 3.2 | 1.19 | −2.1 |
| TNFRSF19L | RELT | 1.28 | 8.4 | 1.26 | 3.4 | 1.32 | −3.6 |
| Other proteins | |||||||
| IL15RA | IL15RA | 1.30 | 13.9 | 1.3 | 6.3 | 1.13 | −3.1 |
| IL17F | IL17F | 1.51 | 10.9 | 1.25 | 2.8 | 2.85 | −5.6 |
| CD55 | DAF | 1.22 | 10.4 | 1.22 | 5 | 1.33 | −6.2 |
| CD300C | CLM6 | 1.23 | 9.9 | 1.19 | 3.2 | 1.23 | −3.6 |
| TNFSF15 | TNFSF15 | 1.20 | 7.8 | 1.39 | 5.8 | 1.26 | −3.9 |
| CCL14 | HCC1 | 1.26 | 7.4 | 1.21 | 2.2 | 1.18 | −1.8 |
| CCL15 | MIP5 | 1.26 | 7.2 | 1.27 | 3.4 | 1.19 | −1.3 |
| CSF1 | M-CSF | 1.42 | 6.1 | 1.32 | 3.4 | 1.54 | −5.0 |
| HAVCR2 | TIMD3 | 1.19 | 5.6 | 1.21 | 3 | 1.21 | −2.5 |
| IL1R1 | IL1R1 | 1.33 | 5.1 | 1.36 | 3.2 | 1.19 | −1.9 |
| IL18R1 | IL18R1 | 1.16 | 3.9 | 1.24 | 2.2 | 1.02 | −0.2 |
Legend: HGNC - Protein names according to the HUGO Gene Nomenclature Committee.
Fold change is a ratio of mean concentration of a protein in subjects who developed ESRD over mean concentration of the same protein in subjects who did not develop ESRD during follow-up. Significance was tested in the generalized linear model (two-sided p value).
Significant thresholds used: ¶ in discovery T1D Joslin Cohort -log10p >3.6 (i.e. p<0.05 after Bonferroni correction) † in validation T2D Joslin Cohort -log10p >2.0 (i.e. p <0.01). In replication T2D Pima Cohort 16 proteins were replicated at -log10p >1.3 (i.e. p <0.05).
Effects of KRIS proteins on time of onset of ESRD
Since the Joslin Cohorts had impaired renal function at baseline (advanced stage of DKD) and had almost identical fold change values for each KRIS protein associated with the development of ESRD, the two cohorts were combined for further comparisons with subjects in the Pima Cohort who had normal renal function at baseline. The effects of baseline concentration of KRIS proteins on time of onset of ESRD in the Joslin Cohorts and Pima Cohort were examined using Cox regression analysis. In the Joslin Cohorts, all KRIS proteins were significantly associated with increased risk of development of ESRD in univariable models and in models adjusted for key potential confounders including age, hemoglobin A1c (HbA1c), eGFR and type of diabetes. The results of this multivariable model are shown in Figure 1B. Among TNFRSF members, the highest adjusted hazard ratios (HR) for ESRD were seen for TNF-R1 (HR [95% CI] per one tertile change: 3.0 [2.2, 4.0]; log10 p = −13.0) and TNF-R2 (HR: 2.2 [1.7, 2.8]; log10 p = −9.4). Among the other KRIS proteins, the strongest association was detected for IL15RA (HR: 2.4 [1.9, 3.0]; log10 p = −11.1). Strikingly, a similar pattern to that found in the Joslin Cohorts was identified in Pima Cohort; baseline levels of 14 of the 17 KRIS proteins were significantly associated with the development of ESRD in the model adjusted for key confounders (age, GFR, HbA1c)( Figure 1B).
In models further adjusted for ACR, which we considered an intermediate phenotype, the HRs remained statistically significant for 15 of the 17 KRIS proteins in the Joslin Cohorts, and 12 of the 17 proteins in Pima Cohort. Further adjustment by gender, systolic blood pressure, body mass index (BMI) and diabetes duration did not substantially impact the effects of KRIS proteins in the Joslin Cohort nor in the Pima Cohort (Supplementary Table 2A & B).
KRIS proteins and long term variation of renal function decline
To examine whether KRIS proteins impacted the long-term disease process that leads to ESRD, we evaluated the relationship between concentrations of circulating KRIS proteins at study entry and longitudinal variations in renal function loss expressed as GFR slope. In the Joslin Kidney Study GFR slopes were estimated using serial measurements of serum creatinine, whereas in the Pima Indian Study slopes were estimated using serial measurements of GFR determined directly by iothalamate clearance. All KRIS proteins correlated strongly and inversely with GFR slope in the Joslin Cohorts. Correlations were somewhat weaker in the Pima Indians, but 14 of the KRIS proteins correlated significantly with GFR slope and in a direction concordant with the Joslin Cohorts (Extended Data 2). These findings agree with the results of Cox regression analysis regarding time to onset of ESRD shown in Figure 1B.
Is KRIS protein’s effect on renal function decline independent from albuminuria?
In our study albuminuria is considered as intermediate phenotype i.e. not risk factor but risk indicator of the disease process that leads to onset of ESRD. To evaluate how much the effect of KRIS proteins on rate or renal function decline was mediated through albuminuria, we conducted a mediation analysis. Figure 2A outlines the principles of the mediation analysis for TNF-R1 in the Joslin Cohorts. This protein had significant albuminuria-independent (−9.3 ml/min/1.73 m2/year per 1 log10 of TNF-R1 increase) and albuminuria-mediated (−4.8 ml/min/1.73 m2 /year per 1 log10 of TNF-R1 increase) effects. Total effect of 1 log10 of increase in TNF-R1 on eGFR slope was −14.1 ml/min/1.73 m2/year. The proportion of the albuminuria-independent effect of TNF-R1 was 66%.
Figure 2. Albuminuria-independent and albuminuria-mediated effect of circulating KRIS proteins on progressive renal function decline. (A) Conceptual framework of the mediation model used in the study. (B) Correlation plot of total effects of KRIS proteins between Joslin Cohorts and Pima Cohort. Legend.
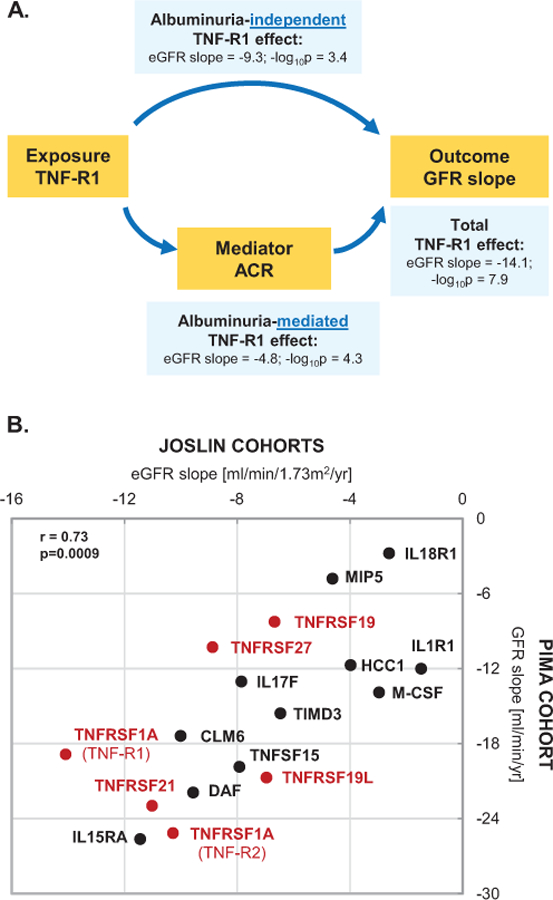
(A) Directed acyclic graph conceptualizing possible etiological relationships. The graph is not exhaustive. Effect of the top KRIS protein, TNF-R1 on the renal slope in the Joslin Cohorts is exercised as an example. eGFR slope estimates represent total and decomposed effects of renal function loss in ml/min/1.73m2/yr per an increase in one unit of a KRIS protein transformed to its base 10 logarithms (β estimates). For example, an increase in one log10unit of TNF-R1 is associated with a rapid eGFR loss of 14ml/min/1.73m2/yr, meaning that a typical Joslin T1D Cohort study subject with proteinuria and CKD3 would develop ESRD in 3 years. Mediation models are described below.
(B) Total effects represent β estimates of eGFR loss in ml/min/1.73m2/yr (Joslin Cohorts, n=363) and of GFR loss in ml/min/yr (Pima Cohort, n=162) per an increase of one unit of a KRIS protein transformed to its base 10 logarithms. Model is adjusted for age, HbA1c, baseline eGFR (Joslin Study) or GFR (Pima Study), whereas ACR is evaluated as a mediator of the effect (two sided p values). Total effect estimates for TNFRSF members are marked with red dots and for other KRIS proteins with black dots. Spearman rank coefficient and corresponding p value (upper right-hand side) represents correlations between total effect estimates between the cohorts. All p values are two sided. Please see the corresponding Supplementary Table 3 for details on effect decompositions.
The detailed results of mediation analysis for all KRIS proteins are shown in Supplementary Table 3. For the majority of KRIS proteins, at least half of their effects on GFR slope were through albuminuria-independent paths (range: 35–79% in Joslin and 55–72% in Pima Cohorts, respectively. Total effect (albuminuria-independent and albuminuria-mediated) estimates were substantial. All KRIS proteins had significant effect on renal function decline in the Joslin Cohorts except for CSF1, IL1R1 and IL18R1, whereas in the Pima Cohort all had significant effect except for XEDAR, CCL15 and IL18R1.
Correlations between total effect estimates for all 17 KRIS proteins in the Joslin Kidney Study and the Pima Indians Study are shown in Figure 2B. Strength of correlations between the cohorts was remarkable (r=0.73). The correlative pattern was preserved for all KRIS proteins. Overall these results indicate a strong similarity in the disease process underlying the development of ESRD among the study groups.
Inter-correlation of KRIS proteins
For etiological considerations, correlated data may point to important underlying mechanisms. We therefore examined in the Joslin Cohorts inter-correlations among baseline concentrations of KRIS proteins using a hierarchical cluster analysis and a non-parametric correlation matrix (Extended Data 3A-C). Both approaches demonstrated that most of the KRIS proteins are markedly correlated, suggesting mutual mechanisms regulating the signature.
Is the Kidney a source of circulating KRIS proteins?
First, we determined whether the increased plasma concentrations of the KRIS proteins could be a consequence of dysfunctional kidney handling resulting in retention of the KRIS proteins in circulation. To answer this question we compared urine excretion of the 17 KRIS proteins in specimens obtained at baseline from subjects who had fast renal decline (cases) vs. those who had no or slow renal decline (controls) during follow-up. From the T1D exploratory panel we selected 29 cases and 31 controls. Similarly, we selected 26 cases and 26 controls from the T2D validation panel. Clinical characteristics are shown in Supplementary Table 4. Baseline urine specimens were analyzed using the custom-designed SOMAscan platform. Fold changes of baseline urinary excretion of KRIS proteins in cases over controls are shown in Extended Data 4. The results of this analysis are similar in T1D and T2D. Subjects at risk of ESRD had increased urinary excretion of KRIS proteins many years before onset of ESRD. Three proteins topped the ranking: TNFRSF21, CCL14 and IL1R1. The excess urine excretion for the other proteins varied from moderate to minimal. None of the proteins showed lower urine excretion at baseline in subjects at risk of ESRD. These findings indicate systemic overproduction as a cause of elevated concentrations of circulating KRIS proteins–not impaired renal handling.
Second, we examined whether the increase in circulating KRIS proteins might be a consequence of over-expression in kidney genes encoding for KRIS proteins17–19. For this analysis we examined the correlation between levels of circulating KRIS proteins and their corresponding genes in kidney biopsies obtained from 56 Pima Indians within ±6 months of the SOMAscan determinations 17,18. We found no correlation between circulating levels of KRIS proteins and tubular expression of their corresponding genes. There was only moderate correlation between circulating levels of TNF-R1 and TNF-R2 and glomerular expressions of these genes; TNF-R1: r= 0.34, TNF-R2, r=0.27, respectively. Concentration of the other KRIS proteins did not show any correlation with glomerular expression of the genes encoding for these proteins (Extended Data 5).
Third, we examined expression of mRNA of genes encoding for the KRIS proteins in kidney specimens from the 1000 Genomes Project (1KGP) (Supplementary Table 5)19, selecting subjects with similar phenotypic characteristics to our T2D Joslin Cohort. Glomerular and tubulointerstitial mRNA expression data were available for 12 KRIS coding genes. In the glomeruli, mRNA levels of CD55 and IL1R1 were positively and strongly correlated with histopathological indices of DKD such as glomerular sclerosis, tubulointerstitial fibrosis, and lymphocyte infiltration. mRNA expression of most other genes had only weak, not-existent or negative correlations. Similar patterns of opposite correlations were found in the dissected tubules (Extended Data 6).
KRIS and severe diabetic retinopathy
To determine whether KRIS is specific to DKD or also plays a role in other diabetic complications, we examined the relationships between circulating KRIS proteins and the prevalence of proliferative diabetic retinopathy (PDR) in a sample of T1D subjects from the Joslin Kidney Study for whom eye and SOMAscan data were available (n=180, Supplementary Table 6). In the logistic regression analysis adjusted for HbA1c, eGFR and ACR, none of the KRIS proteins was associated with prevalent PDR (Extended Data 7). The odds ratios (OR) of PDR per one tertile change of TNF-R1 was OR [95%CI]: 0.82 [0.42, 1.61]; p = 0.564.
Ligands binding to TNFRSF members and development of ESRD
Since KRIS was enriched in members of TNFRSF, we next examined proteins of the entire TNF Receptor Superfamily and their corresponding ligands. TNF Receptor Superfamily consists of 30 members, 23 of which were included in our platform. We constructed a network of the TNF Receptor Superfamily together with the corresponding TNF Ligand Superfamily (Figure 3). Binding patterns between ligands and receptors were curated based on the Kyoto Encyclopedia of Genes and Genomes (KEGG) pathway maps, with support from reports that focused on studying ligand-receptor bindings of this particular family20–22. Although TNF-R1 and TNF-R2 were the most robust predictors of ESRD risk, their corresponding major ligand (TNF) was not associated with ESRD risk. This was also true for other significant TNFRSF members and their corresponding ligands. Some additional TNFRSF members did not fulfill the criteria of significance in the initial screening (fold change analysis), but were still highly significant in the Cox regression analysis (e.g. TNFRSF4 (OX30), TNFRSF9 (4–1BB), log10p value < - 10 for either).
Figure 3. TNF Receptor Superfamily (TNFRSF), their corresponding ligands (TNFSFL) and ESRD risk in the Joslin Cohorts. Legend.
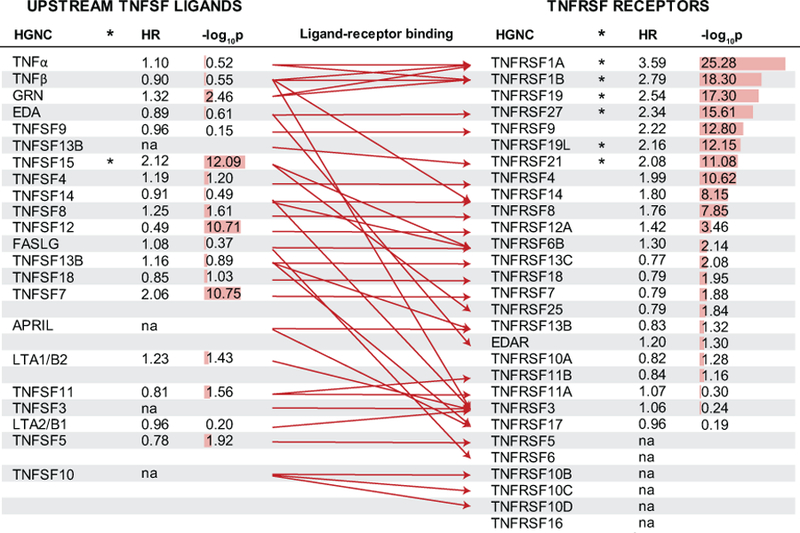
TNFRSF members are ordered according to strength of association with time to onset of ESRD in Cox regression models based on the two Joslin Cohorts (n=363). Effect (hazard ratio) is shown per one tertile change in baseline concentration of relevant protein. Corresponding strength of the association is provided as a numeric two sided p value transformed to its base 10 logarithm and as a red bar. Six TNFRSF members and one TNFSF member marked with an asterisk are part of the KRIS. Literature-curated ligand-receptor binding is presented with a red arrow. Abbreviations: ESRD – End Stage Renal Disease, HR – hazard ratio, HGNC – protein name according to the HUGO Gene Nomenclature Committee. na –not measured.
Treatment of DKD and changes in circulating KRIS protein levels
To examine the effect of renin-angiotensin-system inhibitor (RASi) treatment on circulating KRIS levels we examined levels in 137 of the Pima Indians who were participating in a randomized clinical trial of losartan at the time of SOMAscan measurement23. Sixty-eight patients were in the placebo arm and 62 in the losartan arm and received the study drug for at least 6 months prior to the KRIS measurements. This treatment did not have any effect on KRIS proteins profiles (Figure 4A).
Figure 4. KRIS as a potential biomarker of a response to the treatment. Impact of the interventional treatment in DKD on changes in circulating KRIS protein levels (two independent clinical trials). (A) Losartan (RASi) study. (B) Baricitinib (JAK1/2 inhibitor) study. Legend.
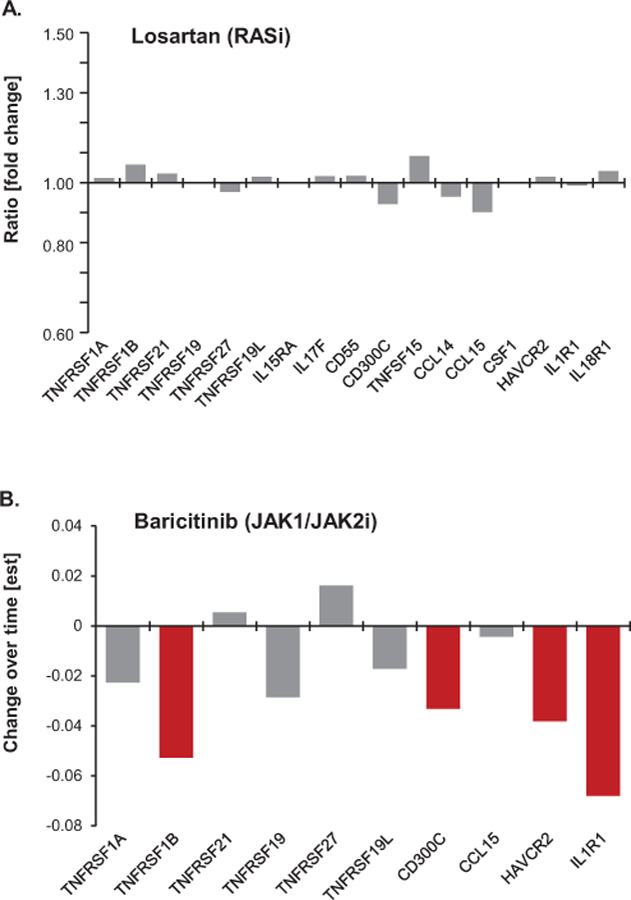
(A) Comparison of plasma KRIS protein levels between treated and placebo groups while on treatment. Ratios of median KRIS levels between the groups are presented on the y axis. Grey bars denote insignificant changes. Protein measurements were performed on the SOMAscan platform.
(B) Differences in circulating KRIS levels between the 4mg dose baricitinib and placebo groups following 24 weeks of treatment. Effect estimate on y axis is based on the longitudinal analysis of response profiles per one unit of a protein change transformed to its base 10 logarithms. Red bars denote proteins for which differences in KRIS protein levels over time were significantly different (p<0.05) in the treated group in comparison with placebo. Grey bars denote insignificant changes. Protein measurements were performed with Olink Inc. technology.
To examine the effect of the JAK1/2 inhibitor, baricitinib, on circulating KRIS protein levels we acquired plasma specimens from a subset of participants with advanced DKD from a Phase 2 clinical trial (ref. 24, see also Supplementary Information). KRIS protein levels were measured at baseline and 24 weeks after initiation of treatment with baricitinib 4mg daily or placebo. Ten KRIS proteins were measured on the OLINK platform (see Supplementary Information). Baricitinib treatment resulted in significantly decreased concentrations of plasma TNFR2, CD300C, HAVCR2 and IL1R1 (repeated measure estimate for a difference in change over time in plasma TNFR2 in the 17 subjects treated with bariticinib group vs the 25 treated with placebo was est±SE: 1.13 ± 1.06, p=0.045). Tendency to decrease plasma protein levels was also observed in the 4 mg dose group vs. placebo for all but 2 of the remaining proteins. Importantly, there were no significant changes in the protein levels in the placebo group over time (Figure 4B).
Other therapies currently being tried for other indications (Supplementary Table 7) may also be effective in slowing renal function decline and postponing onset of ESRD and at the same time lowering plasma levels of KRIS proteins.
KRIS proteins as predictors of time of onset of ESRD
Although our main goal was to develop an etiological model of DKD, we also evaluated the predictive value of the KRIS proteins for 10-year ESRD risk in the combined cohorts (Joslin T1D, Joslin T2D and Pima Indian studies, respectively). Five KRIS proteins (TNF-R1, XEDAR, IL17F, TNFSF15 and CCL15) predicted ESRD (Supplementary Table 8). The addition of TNF-R1 to the clinical model increased the C-statistic from 0.81 to 0.84 (p=0.001). Adding the other four KRIS proteins further improved discrimination (C-statistic: 0.86, p=0.007). Model fit was also improved with TNF-R1 (p<10−21) and the other KRIS proteins (p<10−6).
Discussion
We identified a Kidney Risk Inflammatory Signature (KRIS) comprising 17 circulating inflammatory proteins, which were strongly associated with the development of ESRD but not with proliferative retinopathy. These findings apply to subjects with T1D and T2D, to Caucasians and Pima Indians, and to those with early and advanced stages of DKD. These findings add 15 new proteins to our previous discovery that circulating levels of TNF-R1 or TNF-R2 were robust predictors of early and late renal function decline leading to ESRD in T1D and T2D4,5,7. Our study did not confirm previous reports that implicated various circulating inflammatory proteins, including TNFα, IL6 and MCP1/CCL2, in the development of DKD.
The signature comprising KRIS proteins was enriched in members of the TNF Receptor Superfamily. Six TNFRSF members were robustly associated with renal outcomes: TNF-R1, TNF-R2, TNFRSF19 (TROY), TNFRSF27 (XEDAR) and TNFRSF19L (RELT). TNF-R1 and TNF-R2 were studied previously as predictors of progressive renal decline that leads to ESRD4–11,25. They mediate a broad range of biological activities, including cell survival, proliferation and death together with a variety of inflammatory and immunomodulatory responses linked to kidney diseases26. By contrast, the remaining TNFRSFs were not implicated in the development of DKD and their biology is less known. They were investigated previously in the context of neurological (TNFRSF21 (DR6); TNRSF19 (TROY)), skin (TNFRSF19; TNFRSF27 (XEDAR)) and hematologic disorders (TNFRSF19L (RELT))27–29.
IL15RA was the top non-TNFRSF protein included in the KRIS. IL15RA mediates pleiotropic pro-inflammatory signals involved in several inflammatory disorders. However, neither IL15RA nor its ligand has ever been studied in the context of DKD30. Of the other KRIS proteins, interleukin 17F (IL17F), CD55 (DAF), CSF1 (M-CSF) and receptors 1 for interleukins 1 and 18 (IL1R1, IL18R1) were previously reported in the context of DKD, although mainly in functional or cross-sectional studies2,3,31–33. CC chemokines, mainly CCL2 (MCP1) and CCL5 (RANTES), are postulated to be involved in DKD2,34. Surprisingly, in our study these two were not associated with ESRD. By contrast, CCL14 (HCC1) and CCL15 (MIP5) were part of the KRIS. The latter two chemokines are involved in the immune responses via mediation of monocyte activation3,35,36. In general, TNFRSF members correlated strongly among each other as well as with other selected KRIS proteins: IL15RA, CD55 and HAVCR2. The biological meaning of this clustering pattern needs to be determined.
The source and determinants of KRIS proteins that appear many years before the onset of ESRD are not clear. Urinary proteomic data from the Joslin Cohorts provide compelling evidence that overproduction rather than dysfunctional renal handling is responsible for the increased concentrations of the KRIS proteins in the circulation. However, data from the Pima Indians suggest that overproduction of the KRIS proteins takes place outside the kidneys. Similarly, there were inconsistent relationships between genes expressing KRIS proteins and histopathological indices of DKD in kidney biopsies obtained in the 1KGP project. Interestingly, the vast majority of current research utilizing high throughput technologies concentrates on the kidney as the primary driver of the disease37, our findings highlight the importance of non-kidney factors as important etiological drivers of DKD.
Leukocytes are one plausible non-kidney source of the KRIS. Indeed, prior evidence suggests the involvement of both innate and adaptive immune responses in the development of DKD. Macrophages are the most prevalent infiltrating leukocytes found in diabetic kidneys and are associated with declining renal function. In addition, white blood cells and their fractions correlate with the structural lesions of DKD in Pima Indians and predict renal function loss in Caucasians with type 2 diabetes 2,3,44–50. The KRIS comprised molecules mainly involved in innate immune responses, many of which are expressed by monocytes. However, IL17F is an interleukin involved in adaptive responses mediated by a subset of T cells (Th17)38–41.
The traditional paradigm presumes that TNFRSF members transduce their intracellular signals induced by upstream binding of their cognate ligands, although limited evidence also suggests that TNFRSF proteins may act via ligand-independent mechanisms22. In our study, associations of the TNFSF ligands with renal outcome were negligible. Notably, TNFα was among these unimportant ligands. This is in contrast to previous studies in other populations reporting TNFα involvement in DKD. Those studies, however, focused on associations with albuminuria, and studied subjects with established disease rather than those at risk2,3.
If the KRIS proteins are involved in the etiology of renal function loss, targeting these molecules and the involved inflammatory pathways may help identify new drugs to prevent ESRD. So far only few interventions targeting KRIS-involved pathways have been conducted in DKD. Furthermore, since all KRIS proteins are strongly associated with risk of ESRD, effective therapies that impact the disease process flagged by these proteins should reduce the levels of some or all of the KRIS proteins during intervention.
A phase 2 randomized clinical trial of baricitinib, a JAK-1/2 inhibitor, decreased albuminuria (primary outcome) after 24 weeks of treatment in participants with a comparable baseline renal phenotype to our Joslin study subjects with T2D24. This cohort was used to further evaluate changes in circulating KRIS protein levels due to the JAK-1/2 inhibition. Baricitinib significantly decreased levels of a number of KRIS proteins (including TNFR2) at week 24 with administration of 4 mg baricitinib relative to placebo. Our results confirm and expand already published findings that demonstrated a reduction in plasma TNFR2 following baricitinib treatment24. This interventional study had a relatively small sample size and a short follow-up. It is possible that longer exposure to JAK-1/2 inhibitory treatment may result in more pronounced changes in KRIS proteins.
We found no evidence that losartan reduced the levels of KRIS proteins in the Pima Indians. The effect of SGLT2 inhibitors or GLP-1 agonists on the levels of these proteins has not been assessed, but small studies of CCL2 inhibitors, pentoxifylline and anti-TNF agents found reduced levels of selected KRIS proteins in DKD following treatment 2,42–46. Interestingly, many other biological inhibitors targeting KRIS-involved pathways are currently being tested in clinical trials for other chronic inflammatory disorders, including rheumatoid diseases, inflammatory bowel disease, asthma and others47–51. Some of these compounds were also examined in functional studies of kidney injury. Infliximab (anti-TNF mAb) and etanercept (TNF-R2-Fc), for example, decreased albuminuria in animal models of diabetes 43,44. Blockade of IL17 decreased renal fibrosis in uninephrectomized rats undergoing ischemia reperfusion insult51. Treatment with CCR1 antagonists (CCR1 is a receptor for CCL14, CCL15) decreased kidney fibrosis and interstitial inflammation in animal models of diabetic kidney disease and glomerulonephritis52,53. Further testing of these compounds in DKD may be warranted.
Independently from the role of the KRIS proteins in the etiology of DKD, these proteins may be used for two other purposes: i) to develop a prognostic test to identify individuals at higher risk of progression to ESRD and ii) as a surrogate outcome measure where changes in KRIS levels during intervention may reflect the effectiveness of the tested therapy. Whereas the main aim of our etiological study was to identify inflammatory proteins involved in the disease process leading to ESRD, the goal of a prediction study is to measure the probability of the development of ESRD during follow-up using a combination of the smallest number of biomarkers/clinical characteristics. The biostatistical approaches used to address these two goals are distinct. Etiological studies are inclusive and welcome correlated features, whereas predictive studies favor selection of uncorrelated factors and focus on discriminative metrics. Our etiological modelling led to identification of 17 relevant KRIS proteins, whereas predictive modelling reduced the selection to just 5. The prognostic performance of circulating levels of TNF-R1 was evaluated by us previously12. In this report we found 4 additional proteins that, when measured together with TNFR-1, increased the model’s ability to predict ESRD risk.
Strengths of our study include long-term follow-up observations of multiple cohorts, the use of reliable outcome measures and use of the SOMAscan platform to measure the concentration of proteins in each cohort. Since the study was conducted exclusively in subjects with diabetes, we have no data to evaluate the generalizability of these findings to individuals with other kidney diseases.
STUDY DESIGN AND METHODS:
Overall study design:
To test the hypothesis that a common inflammatory process contributes to the development of ESRD in both types of diabetes, we used follow-up studies of three independent cohorts; Discovery (T1D Joslin Cohort), Validation (T2D Joslin Cohort) and Replication (Pima Cohort). Joslin Kidney Study subjects with T1D were chosen as the Discovery Cohort to identify a signature of circulating inflammatory proteins associated with the development of ESRD because the natural history of DKD in T1D is more homogenous. Since subjects with T2D have DKD that is often confounded by comorbidities, the T2D Joslin Cohort was used to validate findings obtained in T1D. The Replication Cohort of Pima Indians Study subjects with T2D was used to examine the importance of candidate inflammatory proteins found in late DKD in subjects with an early stage of DKD and also of different ethnicity. The latter population has high risk of developing ESRD.
Joslin Kidney Study - selection of discovery and validation cohorts:
The Joslin Diabetes Center Committee on Human Studies approved the informed consent, recruitment and examination procedures for the Joslin Kidney Studies, as well as for the current research.
The Joslin Clinic is a large clinic within Joslin Diabetes Center that provides health care for about 20,000 subjects (85% of Caucasians) of all ages and both types of diabetes who reside mainly in the eastern part of Massachusetts. The majority of patients are referred to the clinic within the first 5 years of diabetes and a large proportion remains under the care of the clinic for long time, frequently for life. Over the last 25 years about 3500 subjects attending the Joslin Clinic were enrolled into a longitudinal study referred to as the Joslin Kidney Study, which aims to identify determinants of the onset and progression of DKD15, 54–56. All enrolled subjects had baseline and follow-up examinations performed with blood and urine specimens collected and stored in −850C for future examinations. Those who had stopped coming to the clinic were examined at their homes. All subjects included in the Joslin Kidney Study are being queried every two years against rosters of the United States Renal Data System (USRDS) and the National Death Index (NDI) to ascertain patients who developed ESRD or died. The last inquiry was conducted in 2015. The USRDS maintains a roster of US patients receiving renal replacement therapy, which includes dates of dialysis and transplantation. The NDI is a comprehensive roster of deaths in the US that includes date and cause of death. Patients were classified to T1D and T2D according to standard clinical criteria, among which treatment with insulin from the onset of diabetes was required to diagnose the earlier and treatment with diet or oral agents to diagnose the latter.
The current study includes a subset of subjects enrolled into the Joslin Kidney Study, who participated in our previous study to determine threshold value of plasma TNF-R1 to predict progression to ESRD12. In contrast to the previous study that included patients with CKD stages 3 and 4, the current study includes patients with CKD 3 for whom baseline samples were available for the proteomics analysis. In total the study comprised 219 subjects with T1D (exploratory cohort), and 144 subjects with T2D (validation cohort) who were enrolled into the Joslin Kidney Studies between 1991 and 2006 and were followed to ascertain renal function changes by estimating eGFR slopes and dates of onset of ESRD and deaths. As of 2015 the duration of follow up was 8 years (median) and 6 and 11 years (25th and 75th percentiles) among subjects who did not developed ESRD. Among those who developed ESRD duration of follow up was 4 years (median) and 2 and 6 years (25th and 75th percentiles). Description of the cohorts, measurements of clinical characteristics, determinations of eGFR slopes and ascertainment of ESRD and deaths were included in the previous publication12 (see also Supplementary Information). Plasma and urine specimens obtained from subjects included in the present study were obtained at enrollment and were stored at −850C until assay on the SOMAscan proteomics platform in 2016.
Pima Indian Study – selection of replication cohort:
The study was approved by the Institutional Review Board of the National Institute of Diabetes and Digestive and Kidney Diseases. Each subject gave informed consent at each renal clearance study.
Pima Indians from the Gila River Indian Community in Arizona have both a very high prevalence of T2D and a high incidence of ESRD due to diabetes57. This population participated in a longitudinal study of the natural history of diabetes and its complications between 1965 and 2007. Informative subsets of individuals from this population were selected beginning in the late 1980’s to undergo more detailed longitudinal studies of DKD, and follow-up of many of these individuals still continues16,57.
For our research we used a cohort of 310 adult subjects enrolled in these Pima Indians kidney studies who had renal function measured longitudinally using urinary clearance of iothalamate and GFR was expressed as ml/min. In contrast in the Joslin Kidney Studies GFR was estimated using serum creatinine concentrations and was expressed as ml/min/1.73m3. More information regarding measurements of clinical characteristics including iothalamate GFR, obtaining specimens at baseline and outcome ascertainment are described in a previous publication16.
For the Pima replication cohort we selected 162 subjects who had normal renal function at the initiation of the study (between 1994 and 2007), had sufficient amount of serum for SOMAscan analysis and subjects who did not developed ESRD during the follow-up had at least 4 years of follow-up (3 or more GFR measurements) so GFR slopes could be determined. As of 2017 the duration of follow up was 11 years (median) and 10 and 13 years (25th and 75th percentailes) among subjects who did not developed ESRD. Among those who developed ESRD duration of follow up was 7 years (median) and 4 and 10 years (25th and 75th percentiles). For the current study we right-censored the length of the follow-up at 10 years. Within this timeframe, 38 study subjects developed ESRD and 124 subjects remained ESRD-free.
Of the 162 subjects included in the replication cohort, 137 also participated in a randomized clinical trial of losartan. From those 137 patients, 68 were in the placebo arm and 62 were in the losartan arm and received the study drug for at least 6 months prior to the KRIS measurements23.
Serum samples obtained from the 162 Pima Indians at initiation (between 1994 and 2008) of follow-up underwent proteomic profiling with the same aptamer-based technology on the SOMAscan platform as plasma samples obtained from the Joslin Kidney Study. Measurements in the Pima Indians were performed in 2017. Baseline serum samples were stored at −80°C prior to assay.
SOMAscan -Aptamer-based proteomic profiling:
Unique single stranded sequences of DNA or RNA, referred to as aptamers, were demonstrated to recognize folded protein epitopes with high affinity and specificity. This property was further advanced by the Slow Off-rate Modified Aptamer (SOMAmer) utilized on the SOMAscan platform to assay concentrations of proteins in our study. This proteomic platform features high throughput capabilities (over 1000 proteins in one sample), together with excellent reproducibility and sensitivity13,14. Applications of the aptamer-based technology in large epidemiological studies have been used in other disease settings58–60.
Our study evaluated assay results for 194 inflammatory proteins present on a SOMAscan array. The protein selection algorithm implemented for the SOMAscan platform incorporated a strong preference toward proteins known to be present in circulating matrices such as plasma or serum. The selection included representatives of major inflammatory classes: interleukins, chemokines, TNF superfamily and the corresponding receptors of the 3 groups, interferons, complement system members and costimulatory molecules. Intracellular mediators of inflammation were not considered in our array as they were unlikely to be detected in circulating matrix.
Plasma (from Joslin Cohorts) and serum (from Pima Cohort) samples were run in batches of 78 samples balanced by prospective case status and masked to the laboratory operators and data processing scientists. Twelve replicate samples were applied across the batches to allow for universal calibration based on intercept and beta estimates from the linear regression model drawn from PROC GLM in SAS. Replicate samples were used to generate coefficients of variations. Overall, assay precision was very good. Median inter-assay coefficient of variation (CV) for all 194 proteins was: 4.3% (25th, 75th percentile: 3.0, 6.4%, respectively). 174 proteins (90%) had CVs below 10% and only 3 proteins were characterized by marked variation (CVs >20%). CVs are listed in Supplementary Table 1.
Plasma samples from 219 Joslin Kidney Study participants with T1D had TNF-R1 and TNF-R2 measurements performed by Quantikine ELISA assays (catalog numbers: DRT100, DRT200, RnD Systems, Minneapolis, MN)12. Spearman correlation coefficient between antibody-based measurements and aptamer-based measurements was r = 0.98 for TNF-R1 and r=0.95 for TNF-R2.
Urine profiles of the KRIS proteins and progression to ESRD:
Urine samples from a nested case-control study of subjects from the T1D and T2D Joslin Cohorts underwent profiling of the proteins of interest using the same aptamer-based SOMAscan technology. The array readout contained the same set of 194 proteins as described above, but only the 17 proteins of interest identified in the plasma samples were analyzed.
T1D cases (n=29) were identified from among T1D subjects of the discovery panel that experienced fast progressive renal decline (eGFR loss > 8 ml/min/year). The majority of the cases developed ESRD in 10 years of observation. T1D controls (n=31) were selected from among subjects with T1D that had no or minimal renal decline (eGFR loss <3.5ml/min/year) within the follow-up period. T2D cases (n=26) and controls (n=26) were drawn from among the T2D subjects of the validation panel following the same eligibility criteria as those with T1D. Comparisons of characteristics of the study groups are shown in Supplemental Table 3. Urine samples were also measured by the aptamer-based technology as described above. Obtained concentrations were normalized to the urine creatinine concentration. Distributions of urine proteins featured departures from normality, therefore effect sizes were reported as fold changes of median values per group, in comparison with serum/plasma proteins where effect size was based on fold changes of mean values per group.
Kidney tissue mRNA expression data of KRIS proteins – Pima Indians Study:
Relationships between transcriptional regulation and quantitative structural damage in early diabetic kidney disease were examined in a subset of the Pima cohort. From the cohort of 162 Pima Indians, 49 underwent protocol kidney biopsies and had sufficient tissue for evaluation of the tissue gene expression within 1–2 years of the serum SOMAscan measurements. Kidney tissue was subjected to compartment-specific gene expression profiling and quantitative histological analysis. Clinical characteristics of this subgroup (n=49) were similar to the characteristics of the entire cohort from which it was drawn, as described earlier10. Profiling of gene expression was performed using a GeneChip Human Genome series U133A and Plus 2.0 Array (Affymetrix, Santa Clara,CA). Image files (Affymetrix, Santa Clara, CA) were processed as described previously17,18.
Kidney tissue mRNA expression data of KRIS proteins – 1,000 Kidney Genomes Project (1KGP):
Tissue expression of mRNA encoding proteins of interest in the present study was derived from the 1KGP collection19. Tubular (n=37) and glomerular (n=23) mRNA expression was derived from subjects with T2D, various ethnic ancestries and overt DKD (for clinical characteristics and histology indices, please refer to Supplementary Table 5. Kidney samples were obtained from routine surgical nephrectomies, stored in RNAlater, and manually micro-dissected under a microscope to separate the glomerular and tubular compartments. RNA quality and quantity were determined using the Laboratory-on-Chip Total RNA PicoKit Agilent BioAnalyzer, and only samples without evidence of degradation were used (RNA integrity number>6). Purified total RNAs were amplified using the Ovation Pico WTA System V2 (NuGEN) and labeled with the Encore Biotin Module (NuGEN) according to the manufacturer’s protocol. Transcript levels were analyzed using Affymetrix U133A arrays, and raw expression levels were summarized using the RMA16 algorithm by the justRMA function of the Affy package. Details on clinical characteristics and histology indices are provided in Supplemental Table 5. Proteinuria was determined with a dipstick score with values from 0 to 5 approximating the following proteinuria ranges: 0-negative, 1 – trace, 2 – 30, 3–100, 4–300, 5>300 mg/100 ml of protein concentration.
An interventional study of baricitinib in DKD:
The study was conducted in accordance with the Declaration of Helsinki, the International Conference on Harmonization, and local laws and regulations. The study protocol and informed consent forms were approved by institutional review boards or ethics review boards for each study site.
This was a randomized, placebo-controlled, double-blind, parallel-group, dose-ranging, Phase 2 trial (ClinicalTrials.gov identifier NCT01683409). The study design included a 24-week treatment with baricitinib accompanied by the respective screening and washout periods. Baricitinib is a selective inhibitor of Janus kinases 1 and 2. Eligibility criteria allowed for recruitment of patients with comparable renal phenotypes to the Joslin T2D cohort (T2D, 25 ≤ eGFR ≤ 70 ml/min/1.73m2 and a history of macroalbuminuria: ACR >300µg/g). The study met its primary endpoint with evidence of significant reduction of albuminuria following the baricitinib treatment. Details of the study design, clinical characteristics of the participants and main results were published elsewhere24. From among 129 study participants, 25 subjects were in the placebo group and 17 subjects were in the highest baricitinib dose (4mg) group. Those who completed treatment and of whom plasma samples at baseline and at 24 weeks of treatment we available were subjected to the targeted proteomic measurements.
Ten out of 17 KRIS proteins were measured with the proximity extension assay (PEA) with the Olink Inc panels61. This antibody-based assay features multiplex capabilities. Pairs of antibodies are linked to oligonucleotides with slight mutual affinities. Detection system relies on the principle of the real-time PCR. The following assays were used: Cardiovascular III Panel, v.6111 (for measurements of plasma proteins: TNFR1, TNFR2, CCL15, IL1R1), Neurology Panel, v. 8011 (TNFRSF21, TNFRSF27, CD300C), Oncology II Panel, v.7002 (TNFRSF19), Development Panel, v.3511 (TNFRSF19L, HAVCR2), respectively; Olink Proteomics Inc. (Uppsala, Sweden). All paired samples were run within a respective single plate. All data points were within the detection limits. Intra-assay coefficient of variation (CV) was below 10% for all the proteins except for TNFRSF19L, for which the CV was 11.5%.
Protein nomenclature:
The HUGO Gene Nomenclature Committee (HGNC) is the worldwide authority that assigns standardized nomenclature to human genes. HGNC symbols were used to describe protein symbols throughout the manuscript, though TNF-R1 and TNF-R2 were also used to describe TNFRSF1A and TNFRSF1B, since these names are familiar to most readers62.
Statistical Analysis:
Descriptive characteristics were provided as mean and standard deviations, median (25th, 75th percentile) or proportions as applicable. Multivariate general linear modeling of the global proteomic profiling data was performed to generate effect sizes as fold changes of means in two groups (ESRD progressors vs non progressors) together with significance at nominal alpha level and adjusted for multiple testing with Bonferroni correction.
Enrichment for TNFRSF members was conducted with two-sided Fisher’s exact tests over a background of 194 inflammatory proteins. The overrepresentations of certain protein classes among the significant proteins were compared to all protein members of the respective class and referenced against proportions of the remaining significant and non-significant proteins measured within the array as described before63.
Please note that our customized array constitutes background already “enriched in the inflammatory molecules”, which may unfairly lower the robustness of the analysis. Significant enrichments in the context of this unfavorable background imply that these enrichments must be particularly strong.
Multivariable Cox proportional-hazards models tested associations of relevant proteins with the primary outcome (time to ESRD censored at 10 years) expressed as hazard ratios per one tertile change of the percent rank marker distribution with corresponding 95% confidence intervals (one degree of freedom). Ties in the failure time were handled with exact conditional probabilities. We examined potential confounding by inspection of ß estimates, and change in ß of 20% or higher was considered non-negligible. Martingale residual plots were examined to test the proportional hazards assumption. Plots showing that the observed curves for a variable were within the distribution of the simulated cumulative Martingale residual curves were indicative of an acceptable fit. In parallel, a significant p-value at the level 0.05 was considered a poor fit. Proportionality assumption was tested for final univariable and adjusted models.
Longitudinal trajectories of GFR measurements over time were constructed using linear regression models. Associations of KRIS proteins with GFR slopes were evaluated based on Spearman rank correlation coefficients. Correlation coefficients and nominal p values are provided.
Mediation analysis advances our knowledge about the mechanisms by which an exposure affects an outcome and it assists in evaluating whether the intervention on the mediator could possibly reduce the effect of exposure. We built our etiological model with renal function decline expressed as GFR slope as our dependent variable. Albuminuria was included as a mediator of KRIS protein effects. In principal, the mediation analysis that assumes no interaction relies on the two regression models: E(M|A=a,C=c)=β0 +β1a+β’2c and E(Y|A =a,M = m,C = c) = θ0 +θ1a+θ2m+θ’4c, where M - mediator, A - exposure, C - confounding variables, Y - outcome. Natural direct effect (NDE) can be expressed as NDE = θ1(a−a∗) and natural indirect effect (NIE) as NIE = θ2β1(a−a∗). NDE quantifies the impact of the exposure on the outcome if the path between the exposure and the mediator was disabled. NIE determines the effect of exposure on the outcome operated by modulating the mediator levels. Mediation analysis was conducted in a counterfactual framework. For causal interpretations, one needs to assume that the model was correctly specified and controlled for exposure-mediator, mediator-outcome and exposure-outcome confounding, that none of the mediator-outcome confounders were themselves affected by the exposure and that the temporal relationships were preserved. We did not have sufficient power to perform mediation analysis using time to ESRD as our outcome. PROC CAUSALMED in SAS software was used64.
Orthogonal relationships among proteins of interest were evaluated with the tools of hierarchical cluster analysis (Ward method) and matrices of non-parametric rank correlation coefficients. Spearman rank correlation coefficients were calculated to examine the correlation between gene expression and CKD traits (glomerular sclerosis, tubulointerstitial fibrosis and interstitial lymphocytic infiltrate) in 1KGP study and between gene expressions and corresponding circulating protein levels (Pima Indian Study). Cross-sectional associations between plasma KRIS proteins and retinopathy were evaluated with a logistic regression analysis per one tertile change of the percent rank marker distribution with corresponding 95% confidence intervals (one degree of freedom).
We evaluated prediction performance in a Cox proportional hazards model applying forward variable selection (entry criterion, p=0.1) to the dataset comprising the three cohorts. Considerations were inclusive for all potentially relevant clinical variables (age, gender, diabetes duration, HbA1c, GFR or eGFR, ACR (transformed to its base 10 logarithm), systolic blood pressure, BMI, cohort indicator; and for all 17 KRIS proteins. The model resulted in the selection of 5 KRIS proteins including TNF-R1 and selected clinical covariates (model no. 3). We compared model no. 3 to the model containing the same clinical covariates and TNF-R1 (model no. 2). The simplest model (model no. 1) contained clinical covariates only. Prediction discrimination was measured with metrics suitable for right-censored data. Harrell’s C-statistics was calculated as proportions of pairs for subjects whose observed and predicted outcomes were concordant, where pairs incomparable due to censoring were discarded. Uno’s method yielded similar values of C-statistics. Fit of the consecutive nested models was tested with likelihood ratio tests with the appropriate degrees of freedom and an assumption of chi square distribution and by changes in the Akaike Information Criteria (AIC) values.
Longitudinal changes of KRIS proteins as a result of the interventional studies were evaluated with the analyses of response profiles (PROC MIXED with REPEATED statement) that account for within-individual variation. Models evaluated changes in proteins transformed to their base 10 logarithms and included treatment arm, visit and treatment arm *visit interaction with the restricted maximum likelihood (REML) as the method estimation. Unstructured covariance structure was used.
We evaluated our models in the testing framework of a two-sided alpha error = 0.05 unless otherwise noted. Analyses were performed in SAS v.9.4.
Pathway analysis
Binding pattern between TNF Superfamily of ligands and receptors were curated based on the KEGG pathway maps and additional reports focusing on studying ligand - receptor bindings of this family20,21.
Literature search on therapeutic targets
A non-systematic literature search on the utility of the potential therapeutic targets relied on a number of resources: i) ClinicalTrials.gov website: main search terms: “Diabetic Kidney Disease” AND (Phase 2 OR Phase 3) AND interventional study; names of 17 proteins one at a time AND (Phase 2 OR Phase 3) AND interventional study; ii) prominent reviews on therapeutics for diabetic and/or chronic kidney disease; iii) prominent reviews on therapeutics targeting proteins of interest in non-diabetic or chronic kidney diseases; iv) other selected articles focusing on proteins of interest, conducted with NCBI PubMed individual searches.
Supplementary Material
Acknowledgements:
This study was supported by grants from the NIH to ASK (DK41526 and DP3DK112177), to KS (DK 087635 and DK108220), and to the Joslin Diabetes Research Center (P30 DK036836); from the Novo Nordisk Foundation to ASK (NNF OC0013659); and from the JDRF to MAN (5-CDA-2015-89-A-B). The study was also supported by the Intramural Research Program of the National Institute of Diabetes and Digestive and Kidney Diseases. P.F. is supported by Romeo ed Enrica Invernizzi Foundation.
We would like to acknowledge Evan Mills and Narges Rashidi from Olink Proteomics Inc. for their assistance with protein measurements.
The findings and conclusions in this report are those of the authors.
Footnotes
Competing Interest Statement:
ASK and MAN are co-inventors of the TNF-R1 and TNF-R2 patent for predicting risk of ESRD. This patent was licensed by the Joslin Diabetes Center to EKF Diagnostics.
The other authors of this report declare no competing conflicts of interest.
Data availability
Global proteomic profiling coming from the prospective study followed for ESRD risk are provided in the Supplementary information of this article. The datasets that support the findings of this study are available from the corresponding authors upon request in a de-identified manner.
REFERENCES
- 1.Gregg EW, et al. Changes in diabetes-related complications in the United States, 1990–2010. N Engl J Med 370, 1514–1523 (2014). [DOI] [PubMed] [Google Scholar]
- 2.Macisaac RJ, Ekinci EI & Jerums G Markers of and risk factors for the development and progression of diabetic kidney disease. Am J Kidney Dis 63, S39–62 (2014). [DOI] [PubMed] [Google Scholar]
- 3.Pichler R, Afkarian M, Dieter BP & Tuttle KR Immunity and inflammation in diabetic kidney disease: translating mechanisms to biomarkers and treatment targets. Am J Physiol Renal Physiol 312, F716–F731 (2017). [DOI] [PMC free article] [PubMed] [Google Scholar]
- 4.Niewczas MA, et al. Circulating TNF receptors 1 and 2 predict ESRD in type 2 diabetes. J Am Soc Nephrol 23, 507–515 (2012). [DOI] [PMC free article] [PubMed] [Google Scholar]
- 5.Skupien J, et al. Synergism between circulating tumor necrosis factor receptor 2 and HbA(1c) in determining renal decline during 5–18 years of follow-up in patients with type 1 diabetes and proteinuria. Diabetes Care 37, 2601–2608 (2014). [DOI] [PMC free article] [PubMed] [Google Scholar]
- 6.Gohda T, et al. Circulating TNF receptors 1 and 2 predict stage 3 CKD in type 1 diabetes. J Am Soc Nephrol 23, 516–524 (2012). [DOI] [PMC free article] [PubMed] [Google Scholar]
- 7.Pavkov ME, et al. Elevation of circulating TNF receptors 1 and 2 increases the risk of end-stage renal disease in American Indians with type 2 diabetes. Kidney Int 87, 812–819 (2015). [DOI] [PMC free article] [PubMed] [Google Scholar]
- 8.Forsblom C, et al. Added value of soluble tumor necrosis factor-alpha receptor 1 as a biomarker of ESRD risk in patients with type 1 diabetes. Diabetes Care 37, 2334–2342 (2014). [DOI] [PubMed] [Google Scholar]
- 9.Saulnier PJ, et al. Association of serum concentration of TNFR1 with all-cause mortality in patients with type 2 diabetes and chronic kidney disease: follow-up of the SURDIAGENE Cohort. Diabetes Care 37, 1425–1431 (2014). [DOI] [PubMed] [Google Scholar]
- 10.Coca SG, et al. Plasma Biomarkers and Kidney Function Decline in Early and Established Diabetic Kidney Disease. J Am Soc Nephrol 28, 2786–2793 (2017). [DOI] [PMC free article] [PubMed] [Google Scholar]
- 11.Barr ELM, et al. High Baseline Levels of Tumor Necrosis Factor Receptor 1 Are Associated With Progression of Kidney Disease in Indigenous Australians With Diabetes: The eGFR Follow-up Study. Diabetes Care 41, 739–747 (2018). [DOI] [PubMed] [Google Scholar]
- 12.Yamanouchi M, et al. Improved clinical trial enrollment criterion to identify patients with diabetes at risk of end-stage renal disease. Kidney Int 92, 258–266 (2017). [DOI] [PMC free article] [PubMed] [Google Scholar]
- 13.Gold L, et al. Aptamer-based multiplexed proteomic technology for biomarker discovery. PLoS One, e15004 (2010). [DOI] [PMC free article] [PubMed]
- 14.Tuerk C & Gold L Systematic evolution of ligands by exponential enrichment: RNA ligands to bacteriophage T4 DNA polymerase. Science 249, 505–510 (1990). [DOI] [PubMed] [Google Scholar]
- 15.Krolewski AS Progressive renal decline: the new paradigm of diabetic nephropathy in type 1 diabetes. Diabetes Care 38, 954–962 (2015) [DOI] [PMC free article] [PubMed] [Google Scholar]
- 16.Nelson RG, et al. Development and progression of renal disease in Pima Indians with non-insulin-dependent diabetes mellitus. Diabetic Renal Disease Study Group. N Engl J Med 335, 1636–1642 (1996) [DOI] [PubMed] [Google Scholar]
- 17.Nair V, et al. A molecular morphometric approach to diabetic kidney disease can link structure to function and outcome. Kidney Int 93, 439–449 (2018). [DOI] [PMC free article] [PubMed] [Google Scholar]
- 18.Saito R, et al. Systems biology analysis reveals role of MDM2 in diabetic nephropathy. JCI Insight 1, e87877 (2016). [DOI] [PMC free article] [PubMed] [Google Scholar]
- 19.Beckerman P, et al. Human Kidney Tubule-Specific Gene Expression Based Dissection of Chronic Kidney Disease Traits. EBioMedicine 24, 267–276 (2017). [DOI] [PMC free article] [PubMed] [Google Scholar]
- 20.Bossen C, et al. Interactions of tumor necrosis factor (TNF) and TNF receptor family members in the mouse and human. J Biol Chem 281, 13964–13971 (2006). [DOI] [PubMed] [Google Scholar]
- 21.Kanehisa M, et al. Data, information, knowledge and principle: back to metabolism in KEGG. Nucleic Acids Res 42, D199–D205 (2014). [DOI] [PMC free article] [PubMed] [Google Scholar]
- 22.Locksley RM, Killeen N & Lenardo MJ The TNF and TNF receptor superfamilies: integrating mammalian biology. Cell 104, 487–501 (2001). [DOI] [PubMed] [Google Scholar]
- 23.Tanamas SK, et al. Long-term Effect of Losartan on Kidney Disease in American Indians With Type 2 Diabetes: A Follow-up Analysis of a Randomized Clinical Trial. Diabetes Care 39, 2004–2010 (2016). [DOI] [PMC free article] [PubMed] [Google Scholar]
- 24.Tuttle KR, et al. JAK1/JAK2 inhibition by baricitinib in diabetic kidney disease: results from a Phase 2 randomized controlled clinical trial. Nephrol Dial Transplant 33, 1950–1959 (2018). [DOI] [PMC free article] [PubMed] [Google Scholar]
- 25.Gohda T, et al. Clinical predictive biomarkers for normoalbuminuric diabetic kidney disease. Diabetes Res Clin Pract 141, 62–68 (2018). [DOI] [PubMed] [Google Scholar]
- 26.Al-Lamki RS & Mayadas TN TNF receptors: signaling pathways and contribution to renal dysfunction. Kidney Int 87, 281–296 (2015). [DOI] [PubMed] [Google Scholar]
- 27.Cui CY & Schlessinger D EDA signaling and skin appendage development. Cell Cycle 5, 2477–2483 (2006). [DOI] [PMC free article] [PubMed] [Google Scholar]
- 28.Sica GL, et al. RELT, a new member of the tumor necrosis factor receptor superfamily, is selectively expressed in hematopoietic tissues and activates transcription factor NF-kappaB. Blood 97, 2702–2707 (2001). [DOI] [PubMed] [Google Scholar]
- 29.Tam SJ, et al. Death receptors DR6 and TROY regulate brain vascular development. Developmental Cell 22, 403–417 (2012). [DOI] [PubMed] [Google Scholar]
- 30.McInnes IB & Gracie JA Interleukin-15: a new cytokine target for the treatment of inflammatory diseases. Curr Opin Pharmacol 4, 392–397 (2004). [DOI] [PubMed] [Google Scholar]
- 31.Araki S, et al. Predictive impact of elevated serum level of IL-18 for early renal dysfunction in type 2 diabetes: an observational follow-up study. Diabetologia 50, 867–873 (2007). [DOI] [PubMed] [Google Scholar]
- 32.Cortvrindt C, Speeckaert R, Moerman A, Delanghe JR & Speeckaert MM The role of interleukin-17A in the pathogenesis of kidney diseases. Pathology 49, 247–258 (2017). [DOI] [PubMed] [Google Scholar]
- 33.Kitching AR & Holdsworth SR The emergence of TH17 cells as effectors of renal injury. J Am Soc Nephrol, 22, 235–238 (2011). [DOI] [PubMed] [Google Scholar]
- 34.Tesch GH MCP-1/CCL2: a new diagnostic marker and therapeutic target for progressive renal injury in diabetic nephropathy. Am J Physiol Renal Physiol 294, F697–701 (2008). [DOI] [PubMed] [Google Scholar]
- 35.Forssmann U, Magert HJ, Adermann K, Escher SE & Forssmann WG Hemofiltrate CC chemokines with unique biochemical properties: HCC-1/CCL14a and HCC-2/CCL15. J Leukoc Biol 70, 357–366 (2001). [PubMed] [Google Scholar]
- 36.Schulz-Knappe P, et al. HCC-1, a novel chemokine from human plasma. J Exp Med 183, 295–299 (1996). [DOI] [PMC free article] [PubMed] [Google Scholar]
- 37.Sharma K, Susztak K & Pennathur S Introduction: Systems Biology of Kidney Disease. Semin Nephrol 38, 99–100 (2018). [DOI] [PMC free article] [PubMed] [Google Scholar]
- 38.Bohle A, et al. The pathogenesis of chronic renal failure in diabetic nephropathy. Investigation of 488 cases of diabetic glomerulosclerosis. Pathol Res Pract 187, 251–259 (1991). [DOI] [PubMed] [Google Scholar]
- 39.Kojima H, Kim J & Chan L Emerging roles of hematopoietic cells in the pathobiology of diabetic complications. Trends Endocrinol Metab 25, 178–187 (2014). [DOI] [PMC free article] [PubMed] [Google Scholar]
- 40.Chow F, Ozols E, Nikolic-Paterson DJ, Atkins RC & Tesch GH Macrophages in mouse type 2 diabetic nephropathy: correlation with diabetic state and progressive renal injury. Kidney Int 65, 116–128 (2004). [DOI] [PubMed] [Google Scholar]
- 41.Wheelock KM, et al. White blood cell fractions correlate with lesions of diabetic kidney disease and predict loss of kidney function in Type 2 diabetes. Nephrol Dial Transplant (2017). [DOI] [PubMed]
- 42.Navarro-Gonzalez JF, et al. Effect of pentoxifylline on renal function and urinary albumin excretion in patients with diabetic kidney disease: the PREDIAN trial. J Am Soc Nephrol 26, 220–229 (2015). [DOI] [PMC free article] [PubMed] [Google Scholar]
- 43.Moriwaki Y, et al. Effect of TNF-alpha inhibition on urinary albumin excretion in experimental diabetic rats. Acta Diabetologica 44, 215–218 (2007). [DOI] [PubMed] [Google Scholar]
- 44.Omote K, et al. Role of the TNF pathway in the progression of diabetic nephropathy in KK-A(y) mice. American Journal of Physiology. Renal Physiology 306, F1335–1347 (2014). [DOI] [PubMed] [Google Scholar]
- 45.Navarro JF, et al. Tumor necrosis factor-alpha gene expression in diabetic nephropathy: relationship with urinary albumin excretion and effect of angiotensin-converting enzyme inhibition. Kidney Int Suppl, S98–102 (2005). [DOI] [PubMed]
- 46.Menne J, et al. C-C motif-ligand 2 inhibition with emapticap pegol (NOX-E36) in type 2 diabetic patients with albuminuria. Nephrol Dial Transplant 32, 307–315 (2017). [DOI] [PMC free article] [PubMed] [Google Scholar]
- 47.Croft M, Benedict CA & Ware CF Clinical targeting of the TNF and TNFR superfamilies. Nat Rev Drug Discov 12, 147–168 (2013). [DOI] [PMC free article] [PubMed] [Google Scholar]
- 48.Croft M & Siegel RM Beyond TNF: TNF superfamily cytokines as targets for the treatment of rheumatic diseases. Nat Rev Rheumatol 13, 217–233 (2017). [DOI] [PMC free article] [PubMed] [Google Scholar]
- 49.O’Shea JJ, Kanno Y & Chan AC In search of magic bullets: the golden age of immunotherapeutics. Cell 157, 227–240 (2014). [DOI] [PMC free article] [PubMed] [Google Scholar]
- 50.Ridker PM, et al. Antiinflammatory Therapy with Canakinumab for Atherosclerotic Disease. N Eng J Med 377, 1119–1131 (2017). [DOI] [PubMed] [Google Scholar]
- 51.Mehrotra P, et al. IL-17 mediates neutrophil infiltration and renal fibrosis following recovery from ischemia reperfusion: compensatory role of natural killer cells in athymic rats. Am J Physiol Renal Physiol 312, F385–F397 (2017). [DOI] [PMC free article] [PubMed] [Google Scholar]
- 52.Anders HJ, et al. A chemokine receptor CCR-1 antagonist reduces renal fibrosis after unilateral ureter ligation. J Clin Invest 109, 251–259 (2002). [DOI] [PMC free article] [PubMed] [Google Scholar]
- 53.Vielhauer V, et al. CCR1 blockade reduces interstitial inflammation and fibrosis in mice with glomerulosclerosis and nephrotic syndrome. Kidney Int 66, 2264–2278 (2004) [DOI] [PubMed] [Google Scholar]
- 54.Krolewski AS, Skupien J, Rossing P & Warram JH Fast renal decline to end-stage renal disease: an unrecognized feature of nephropathy in diabetes. Kidney Int 91, 1300–1311 (2017). [DOI] [PMC free article] [PubMed] [Google Scholar]
- 55.Krolewski AS, et al. Early progressive renal decline precedes the onset of microalbuminuria and its progression to macroalbuminuria. Diabetes Care 37, 226–234 (2014). [DOI] [PMC free article] [PubMed] [Google Scholar]
- 56.Nowak N, et al. Markers of early progressive renal decline in type 2 diabetes suggest different implications for etiological studies and prognostic tests development. Kidney Int 93, 1198–1206 (2018). [DOI] [PMC free article] [PubMed] [Google Scholar]
- 57.Nelson RG, et al. Incidence of end-stage renal disease in type 2 (non-insulin-dependent) diabetes mellitus in Pima Indians. Diabetologia 31, 730–736 (1988). [DOI] [PubMed] [Google Scholar]
- 58.Ganz P, et al. Development and Validation of a Protein-Based Risk Score for Cardiovascular Outcomes Among Patients With Stable Coronary Heart Disease. JAMA 315, 2532–2541 (2016). [DOI] [PubMed] [Google Scholar]
- 59.Ngo D, et al. Aptamer-Based Proteomic Profiling Reveals Novel Candidate Biomarkers and Pathways in Cardiovascular Disease. Circulation 134, 270–285 (2016). [DOI] [PMC free article] [PubMed] [Google Scholar]
- 60.Williams SA, et al. Improving Assessment of Drug Safety Through Proteomics: Early Detection and Mechanistic Characterization of the Unforeseen Harmful Effects of Torcetrapib. Circulation 137, 999–1010 (2018). [DOI] [PMC free article] [PubMed] [Google Scholar]
- 61.Assarsson E, et al. Homogenous 96-plex PEA immunoassay exhibiting high sensitivity, specificity, and excellent scalability. PLoS One 9, e95192 (2014). [DOI] [PMC free article] [PubMed] [Google Scholar]
- 62.Gray KA, Yates B, Seal RL, Wright MW & Bruford EA Genenames.org: the HGNC resources in 2015. Nucleic Acids Res 43, D1079–1085 (2015). [DOI] [PMC free article] [PubMed] [Google Scholar]
- 63.Afshinnia F, et al. Lipidomic Signature of Progression of Chronic Kidney Disease in the Chronic Renal Insufficiency Cohort. Kidney Int Rep 1, 256–268 (2016). [DOI] [PMC free article] [PubMed] [Google Scholar]
- 64.Valeri L & Vanderweele TJ Mediation analysis allowing for exposure-mediator interactions and causal interpretation: theoretical assumptions and implementation with SAS and SPSS macros. Psychol Methods 18, 137–150 (2013). [DOI] [PMC free article] [PubMed] [Google Scholar]
Associated Data
This section collects any data citations, data availability statements, or supplementary materials included in this article.