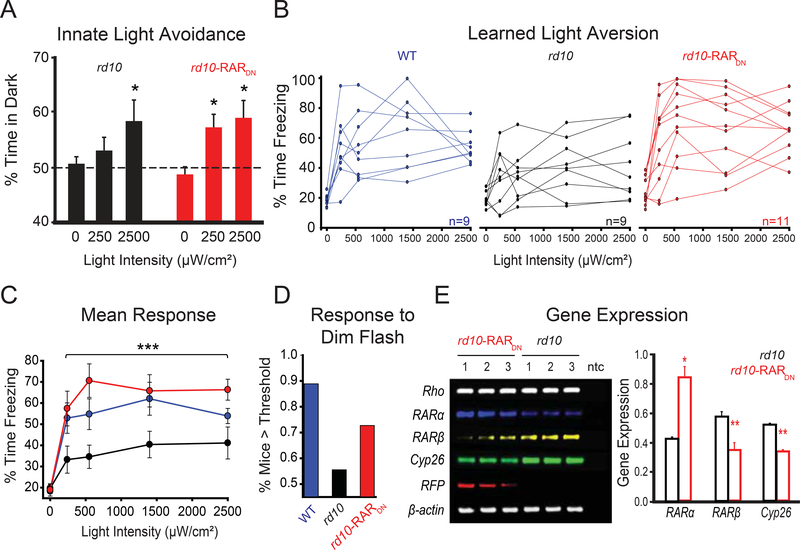
Figure 7. In vivo blockade of RAR increases innate and learned visual responses.
(A) Quantification of innate aversion to light in naive rd10 mice (black bars) as compared to rd10 mice injected at P2–3 with RARDN (red bars). All mice were tested at P37–38. The graph shows the % of time spent by the mouse in the dark side of the chamber as a function of light intensity (darkness, ~250 μW/cm2, 2500 μW/cm2). Values are mean ± SEM, *p<0.05, X2-test.
(B) Individual traces for light responses (% time spent freezing) to darkness (0) and four different intensities of light (240, 550, 1400 and 2500 μW/cm2), using the learned light aversion behavioral paradigm. Untreated WT (blue traces) and rd10 mice (black traces) were compared to rd10 mice injected at P2–3 with RARDN (red traces). All mice were tested at P33–35.
(C) Quantification of B. The graph shows % of time spent freezing as a function of light intensity. Values are mean ± SEM, ***p<0.001, t-test (WT and rd10-RARDN vs rd10).
(D) Probability of mouse displaying a response above threshold for the first light flash using the dimmest intensity (~240 μW/cm2), in each strain, including WT (blue bar), rd10 (black bar) and rd10-RARDN (red bar). For each individual trace in B, the slope of the response was measured, and threshold was set as a slope that is ≥+0.05.
(E) Gel electrophoresis (left) and quantification (right) of semi-quantitative reverse-transcription PCR assay carried out on RNA extracted from retinas of rd10-RARDN and naive rd10 mice. All mice were P40 at the day of dissection and RNA purification. ntc - non-template control; Rho - rhodopsin; RARα - retinoic acid receptor alpha; RARβ - retinoic acid receptor beta; Cyp26 - cytochrome P450 26A1; RFP - red fluorescent protein (mStrawberry). β-Actin was used as a housekeeping gene. Quantification of relative transcript levels for gene expression was normalized to β-actin. rd10 is shown in black and rd10-RARDN in red. Values are mean ± SEM, *p<0.05, **p<0.001, t-test. (A-C, E) For full dataset, see Table S1.

