

Abstract
Reading disabilities (RD) and attention‐deficit/hyperactivity disorder (ADHD) are two of the most common developmental disorders. RD and ADHD frequently co‐occur, which raises questions about how the disorders interact and to what extent they can be differentiated. To date, the underlying neural mechanisms leading to RD–ADHD comorbidity (COM) are not understood. In this study, structural and functional magnetic resonance imaging (fMRI) were combined with comprehensive behavioral testing in order to characterize the behavior, brain structure, and neural correlates of executive function, phonological processing and reading fluency in 60 children with clinical diagnoses of RD, ADHD, or COM, and controls. Whole‐brain analyses of variance were performed on cortical thickness values and on the data of the three fMRI tasks to investigate overall group differences. To validate these findings, a region of interest analysis was performed in regions that have previously been shown to exhibit group differences in children with RD or ADHD using the same paradigms. The neuroimaging results demonstrated structural and functional atypicalities for COM in regions that are frequently associated with deficits in children with isolated ADHD or RD. A combination of shared and distinctive brain alterations between the clinical groups was identified, supporting the multiple deficit model for ADHD, RD, and its comorbidity.
Keywords: ADHD, comorbidity, cortical thickness, fMRI, reading disability
1. INTRODUCTION
Reading disabilities (RD) and attention‐deficit/hyperactivity disorder (ADHD) are two of the most common developmental disorders of childhood, each occurring in approximately 5–10% of the population (Peterson & Pennington, 2015; Polanczyk, de Lima, Horta, Biederman, & Rohde, 2007; von Aster & Shalev, 2007). Children with RD have difficulty in learning to read despite adequate perceptual and general cognitive abilities (Galaburda, LoTurco, Ramus, Fitch, & Rosen, 2006; Peterson & Pennington, 2012). Individuals with ADHD exhibit maladaptive levels of inattention, hyperactivity‐impulsivity or both (combined type), which affect cognitive, emotional, and motor processes (American Psychiatric Association, 2004; Cortese, 2012). Several studies have shown that RD and ADHD frequently co‐occur at greater‐than‐chance levels, with 15–50% of children with ADHD also meeting criteria for RD diagnosis and vice versa (e.g., Gayan et al., 2005; Langberg, Vaughn, Brinkman, Froehlich, & Epstein, 2010; Willcutt et al., 2013). Numerous studies have shown that RD, ADHD, and their comorbid manifestation have a severe long‐lasting clinical, psychological and social impact (Birnbaum et al., 2005; Quinn, Rutherford, & Leone, 2001; Sexton, Gelhorn, Bell, & Classi, 2012). Their co‐occurrence raises questions as to how the disorders interact and to what extent they can be differentiated, yet the causal pathways and underlying mechanisms leading to comorbidity of RD and ADHD are not understood.
Researchers agree that their coexistence is not an artifact caused by biased (clinical) sampling procedures because similar rates of comorbidity between RD and ADHD have also been found in community samples (Levy, Hay, Bennett, & McStephen, 2005; McGrath et al., 2011). Furthermore, RD and ADHD do not share diagnostic criteria and each is evaluated by different methods: RD is primarily assessed by a comprehensive battery of reading assessments and related constructs, such as phonological awareness or rapid automatized naming (Snowling, 2004), whereas the diagnosis of ADHD involves gathering information from several sources, including schools, caregivers, and parents (e.g., interviews and ADHD‐focused parent and teacher rating scales), which are occasionally supported by using standardized cognitive assessments of ability and achievement (Faraone et al., 2015).
Several models have been proposed to account for the comorbidity of RD and ADHD (Germano, Gagliano, & Curatolo, 2010; Willcutt, 2018; Willcutt, Pennington, Olson, Chhabildas, & Hulslander, 2005). Here we only summarize the main theories for comorbidity of RD and ADHD. For example, it has been hypothesized that children with comorbid RD–ADHD (COM) actually suffer from either RD or ADHD alone and only demonstrate symptoms of the second condition as a result of their primary disorder (e.g., frustration due to reading problems makes the child with RD appear inattentive and behavioral problems associated with ADHD disrupt learning to read); this is known as the phenocopy hypothesis (Hinshaw, 1992; Pennington, Groisser, & Welsh, 1993). Although a first paper provided some support for the phenocopy hypothesis (Pennington et al., 1993), a number of subsequent studies based on much larger samples have yielded insufficient support for this model (Kibby & Cohen, 2008; Martinussen & Tannock, 2006; Willcutt et al., 2010). Similarly, the direct causation model (see Willcutt, 2018) proposes that one clinical condition causes the underlying pathophysiological symptoms of the second disorder. For instance, severe ADHD symptoms impede a child's attention during a lesson on phonological processing skills that underlie the development of reading. In this case, the attentional problems could directly provoke deficits in reading development in the absence of genetic or environmental risk factors for RD in isolation. Conversely, the common etiology model (see Willcutt, 2018) hypothesizes that the comorbidity occurs as a result of shared genetic and/or environmental influences that increase the likelihood for both disorders. At the same time, the model assumes that the disorders are differentiated by other etiological factors that are distinct to each disorder.
The three independent disorders model or cognitive subtype hypothesis reconceptualizes comorbid RD–ADHD as a unique third disorder distinct from either condition in isolation that is due at least in part to etiological factors that are different from those that increase susceptibility to ADHD or RD separately (Katz, Brown, Roth, & Beers, 2011; Rucklidge & Tannock, 2002). Therefore, this hypothesis predicts that the comorbid group will demonstrate a different pattern of neurocognitive deficits than would be expected based on the additive combination of the deficits of each disorder when they occur individually, which has been a source of debate (e.g., Bental & Tirosh, 2007; Shanahan et al., 2006; Van De Voorde, Roeyers, Verte, & Wiersema, 2010). Willcutt et al. (2010) found some support for the three independent disorders model by showing that those in the comorbid group additionally experienced unique problems in working memory, rapid naming, and processing speed when compared to either the pure ADHD or RD groups.
To date, these competing explanations have largely been evaluated by comparing the groups' cognitive and genetic profiles (Willcutt et al., 2001, 2005). Family studies have demonstrated that shared familial influences (genetic and/or family environment) play a key role in comorbidity between RD and ADHD (Light, Pennington, Gilger, & DeFries, 1995; Willcutt et al., 2010, 2014). Comparisons between monozygotic and dizygotic twins indicate that 60–70% of the risk for RD and 75–80% of the risk for ADHD is due to genetic factors, whereas shared environmental influences account for an additional 10–15% of the variance in reading, but play a minimal role in ADHD (Mascheretti et al., 2017; Wadsworth, DeFries, Willcutt, Pennington, & Olson, 2015; Willcutt et al., 2014). Moreover, the large discrepancy between the prevalence in the general population (5%) and their co‐occurrence (~30%) implies that RD and ADHD are genetically not independent (Pennington, 2006; van Bergen, van der Leij, & de Jong, 2014; Willcutt et al., 2010, 2012). Other studies at a genetic level have reported a genetic correlation up to 0.7 among different types of developmental disorders, indicating the extent to which the same genes are involved in different conditions, known as pleiotropy (Butterworth & Kovas, 2013). However, molecular genetic studies suggest that rather than specific genes having large effects on RD and ADHD, there might be a complex multifactorial common genetic etiology with numerous genetic and environmental risk factors involved (Gayan et al., 2005; Gialluisi et al., 2014; Neale et al., 2008).
Similar to the primary enthusiasm for identifying a specific genetic locus for RD or ADHD, behavioral research has been dominated for a long time by the search for the single cognitive deficit that is necessary and sufficient to cause all behavioral characteristics of RD or ADHD. However, several studies have shown that for RD and ADHD, no single cognitive deficit can explain all behavioral symptoms (Pennington, 2006; van Bergen et al., 2014; Willcutt et al., 2012). Moreover, a single deficit model cannot readily explain the phenomenon of comorbidity, specifically due to increasing evidence for more cognitive deficits underlying RD and ADHD. This calls into question a complete dissociation of the core deficits of the two disorders, leading to the assumption that single deficit models are untenable and must give way to multiple (cognitive) deficit models for understanding these developmental disorders (McGrath et al., 2011; Pennington, 2006; Ring & Black, 2018; van Bergen et al., 2014; Willcutt, 2018; Willcutt et al., 2012).
In summary, comorbid RD–ADHD appear to be explained mainly by shared genetic and environmental risk factors, which operate probabilistically by increasing the likelihood of a disorder, whereas protective factors reduce the chance of developing a disorder (Willcutt, 2018). The multiple deficit model provides a plausible mechanism to explain a partial overlap of symptoms between RD and ADHD (McGrath et al., 2011; Pennington, 2006; van Bergen et al., 2014). Therefore, for example, comorbid RD‐ADHD represents the interaction of multiple etiological factors, which affect the development of relevant neural structures (and subsequent function) that lead to weakness in multiple cognitive domains (van Bergen et al., 2014; Willcutt, 2018). However, the neurological underpinnings of the comorbid brain are as yet unknown.
Research on brain function and development in children with isolated RD and isolated ADHD is more abundant. Imaging studies in individuals with ADHD have suggested structural and functional deficits in the supplementary motor area, the anterior cingulate cortex and right inferior frontal cortex (Cortese, 2012; Hart, Radua, Nakao, Mataix‐Cols, & Rubia, 2013; Kasparek, Theiner, & Filova, 2013), as well as the cerebellar‐frontostriatal circuitry (Emond, Joyal, & Poissant, 2009; Spencer, Biederman, & Mick, 2007). These deficits are associated with diminished executive functioning and inhibition processes in the brain (for reviews, see Christakou et al., 2013; Emond et al., 2009; Spencer et al., 2007).
For individuals with RD, meta‐analyses of neuroanatomical and functional imaging studies have revealed brain alterations in distinct left‐hemispheric posterior and anterior systems (Linkersdorfer, Lonnemann, Lindberg, Hasselhorn, & Fiebach, 2012; Martin, Schurz, Kronbichler, & Richlan, 2015; Richlan, Kronbichler, & Wimmer, 2009, 2011, 2013), causing cognitive difficulties including speech perception, the accurate representation, and manipulation of speech sounds, and problems with language memory, rapid automatized naming or letter‐sound knowledge.
To date, only a few studies (Barry, Clarke, McCarthy, & Selikowitz, 2009; Clarke, Barry, McCarthy, & Selikowitz, 2002; Goradia et al., 2016; Huttunen‐Scott, Kaartinen, Tolvanen, & Lyytinen, 2008; Kibby, Kroese, Krebbs, Hill, & Hynd, 2009; Kibby, Pavawalla, Fancher, Naillon, & Hynd, 2009; Mohl et al., 2015; Van De Voorde, Roeyers, & Wiersema, 2010) have examined whether children with comorbid RD–ADHD show brain characteristics similar to those of children with an isolated diagnosis or whether the behavioral deficits seem to stem from unique functional and structural brain patterns. However, investigating more than one disorder simultaneously is essential to understanding comorbidity. By doing so, one can uncover shared and distinct risk factors at the cognitive and neuronal levels. This might help the understanding, not only of the etiology of the comorbidity, but also of the developmental paths leading to each of the disorders. By complementing functional with structural imaging, we expect to better understand the underlying mechanisms of the deficits observed in our participant groups. Since it has been shown that the underlying anatomical structure shapes and determines brain activation (Deco, Senden, & Jirsa, 2012; Messe, Rudrauf, Benali, & Marrelec, 2014; Saygin et al., 2016), it is essential to examine both structural and functional brain imaging data. Potential group differences in brain activation could be the result of underlying anatomical differences.
Thus, the present study paired comprehensive behavioral testing with structural as well as functional magnetic resonance imaging (fMRI) to characterize the behavior, brain structure, and neural correlates of executive functioning, phonological processing, and sentence reading in four groups of children: children with an isolated diagnosis of RD, children with an isolated diagnosis of ADHD, children with a comorbid diagnosis of RD–ADHD, and typically developing children (TYP). The rationale for the three functional imaging tasks is to investigate brain activation in three functional tasks on which RD and ADHD subjects have previously exhibited low performance. The go/no‐go task measures response inhibition, which is a primary deficit in children with ADHD (Barkley, Fischer, Smallish, & Fletcher, 2002; Wodka et al., 2007). Furthermore, phonological processing has been shown to be a key deficit in children with RD (Vellutino, Fletcher, Snowling, & Scanlon, 2004) and one of the best predictors of reading outcomes in young children (Peterson & Pennington, 2012; Scarborough, 1998). The employed task has been used successfully in previous studies (Powers, Wang, Beach, Sideridis, & Gaab, 2016; Raschle, Stering, Meissner, & Gaab, 2014; Raschle, Zuk, & Gaab, 2012; Yu et al., 2018; Zuk et al., 2018). Reading fluency deficits are an important symptom in older children with developmental dyslexia. The employed reading fluency task has shown robust effects in differentiating children with and without RD (Langer, Benjamin, Minas, & Gaab, 2013). By using these tasks with our participants, we can examine the specificity and/or overlap of brain activation in the different clinical groups for three key skills. For further information about the fMRI task, please refer to Section 2.4.
According to the common etiology model, one should expect to find shared structural and functional atypicalities of RD, ADHD, and their comorbid manifestations compared to TYP. Thus, if the comorbid children share a common neural deficit with children who have a single diagnosis of RD or ADHD, decreased brain activation in brain regions that are required for executive functioning‐ or reading‐related tasks should be observed. If the three independent disorders model is correct, the three groups should exhibit distinctive neural alterations.
2. MATERIALS AND METHODS
2.1. Subjects
Of the 60 right‐handed children included, 15 were clinically diagnosed with RD (mean age: 9.8 ± 1.6 years, 8 females), 15 were diagnosed with ADHD (mean age: 9.8 ± 1.1 years, 4 females), 15 had a clinical comorbid diagnosis of RD and ADHD (COM; mean age: 9.8 ± 1.1 years, 6 females), and 15 were typically developing (TYP; mean age: 10.5 ± 1.3 years, 7 females). None of the children had any additional clinical or neurological conditions. All participants in the patient groups were diagnosed by qualified clinicians following typical clinical guidelines that involved standardized tests as well as questionnaires (teacher/parents). Only children with the persistent inattention subtype of ADHD were included to avoid potential confounds and to obtain a more homogeneous ADHD sample. Moreover, twin studies indicate that the genetic influences are stronger for reading and inattention symptoms than for reading and hyperactivity–impulsivity symptoms (Willcutt et al., 2010, 2014; Willcutt, Pennington, Olson, & DeFries, 2007). Children who were taking medications for ADHD went on a 48‐hour “medication vacation” prior to the testing session (Bledsoe, Semrud‐Clikeman, & Pliszka, 2013; Lim et al., 2013).
The groups were matched for gender, age, and nonverbal IQ (all p > 0.15). All children were native English speakers and completed the study with normal/corrected‐to‐normal vision. Due to movement artifacts, lack of cooperation and/or time restrictions, the total number of subjects included in each analysis varied slightly, as follows: behavioral analysis: n = 55 (13 TYP, 15 RD, 14 ADHD, and 13 COM); cortical thickness: n = 57 (15 TYP, 14 RD, 14 ADHD, and 14 COM); go/no‐go fMRI task: n = 51 (14 TYP, 13 RD, 12 ADHD, and 12 COM); phonological processing task: n = 55 (14 TYP, 14 RD, 14 ADHD, and 13 COM); reading fluency task: n = 53 (14 TYP, 13 RD, 13 ADHD, and 13 COM). In total, 13 TYP, 13 RD, 12 ADHD, and 12 COM had usable data on all measurements. The study protocol was approved by the Institutional Review Board at Boston Children's Hospital and was conducted in accordance with the latest version of the Declaration of Helsinki. All children and a parent or other caregiver provided written informed consent.
2.2. Procedure
Each child underwent two experimental testing sessions, one for psychometric testing and the other for MRI/fMRI. Prior to the MRI session, each child underwent training using a mock MRI scanner (Raschle et al., 2009, 2012). A structural MRI was obtained for each child. During functional imaging, each child performed three fMRI tasks. The first task was an adaptive go/no‐go task (Donders, 1969): This task has shown robust effects in previous studies in children with compared to without ADHD (Vaidya et al., 2005) and several studies have suggested that response inhibition is the primary deficit in ADHD (Barkley et al., 2002; Wodka et al., 2007). The second fMRI paradigm was an auditory phonological processing task: This task has been employed previously (Powers et al., 2016; Raschle et al., 2012, 2014; Yu, Raney, et al., 2018; Zuk et al., 2018) to differentiate children with and without a familial risk of reading disabilities; furthermore, phonological processing has been shown to be one of the key deficits in children with RD (Vellutino et al., 2004) and is one of the best predictors for reading outcome in young children (Peterson & Pennington, 2012; Scarborough, 1998). The third task was a reading fluency task: This task has shown robust effects in differentiating children with and without RD, and reading fluency is one of the key symptoms in developmental dyslexia (Langer et al., 2013; see below for further details). The order of the task presentation was counterbalanced.
2.3. Behavioral assessment
Subjects were tested using a comprehensive testing battery, which included standardized assessments for nonverbal IQ, executive functioning, single word reading, text reading, and various reading‐related skills (see Table 1 for the exact tests and their descriptions). For statistical analyses of the psychometric measurements and in‐scanner performance, RD, ADHD, COM, and TYP were compared with a one‐way analysis of variance (ANOVA), and post hoc between groups t tests for independent samples were calculated for each measure. The statistical thresholds were set to p < 0.05 and post hoc t tests were Bonferroni–Holm corrected for all possible group comparisons (Bonferroni adjusted alpha level of 0.008 [0.05/6]) (Holm, 1979; Shaffer, 1995).
Table 1.
All behavioral measures are listed as standard scores
| Dimension | Test | Description | TYP | RD | ADHD | COM | ANOVA | Post hoc t tests | |
|---|---|---|---|---|---|---|---|---|---|
| Mean ± SD | p value | p value | Corrected for multiple comparisons | ||||||
| Reading related measures | RAN numbers | Automized naming of numbers | 114.2 ± 10.4 | 91.4 ± 26.4 | 99.7 ± 8.8 | 86.3 ± 29.5 | 3.5 | 0.022 | TYP > RD, ADHD, COM; ADHD > COM |
| RAN letters | Automized naming of letters | 112.7 ± 10.8 | 82.2 ± 24.2 | 97.2 ± 9.7 | 85.0 ± 26.6 | 5.7 | 0.002 | TYP > RD, ADHD, COM; ADHD > RD, COM | |
| CTOPP elision | Comprehensive test of phonological processing | 11.9 ± 2.0 | 8.4 ± 3.5 | 9.9 ± 3.5 | 9.6 ± 1.8 | 3.4 | 0.026 | TYP > RD, ADHD, COM | |
| CTOPP memory for digits | Repetition of numbers | 11.0 ± 1.2 | 8.6 ± 2.2 | 10.8 ± 2.42 | 8.2 ± 1.2 | 4.1 | 0.011 | TYP, ADHD > RD, COM | |
| TOSWRF | Word reading fluency | 109.2 ± 19.4 | 92.9 ± 12.6 | 100.0 ± 13.4 | 91.9 ± 8.4 | 3.9 | 0.014 | TYP > RD, COM; ADHD > COM | |
| TOWRE sight word efficiency | Sight word reading efficiency | 115.1 ± 10.1 | 87.9 ± 14.2 | 104.6 ± 15.8 | 94.9 ± 13.7 | 10.4 | <0.001 | TYP > RD, COM; ADHD > RD | |
| TOWRE phonemic decoding E. | Non‐word reading efficiency | 110.0 ± 10.9 | 89.9 ± 10.5 | 102.3 ± 18.0 | 95.6 ± 14.4 | 4.2 | 0.011 | TYP > RD, COM; ADHD > RD | |
| WRMT‐R | Passage reading comprehension | 111.2 ± 6.5 | 95.6 ± 10.1 | 99.4 ± 18.3 | 96.8 ± 7.8 | 4.4 | 0.008 | TYP > RD, ADHD, COM | |
| Executive function tasks | TM letter sequencing | Visual search, sequencing and flexibility | 12.6 ± 2.2 | 8.5 ± 3.2 | 9.6 ± 3.2 | 10.9 ± 2.5 | 4.3 | 0.012 | TYP > RD, ADHD |
| TM number letter sequencing | Visual‐motor sequencing task and flexibility | 13.0 ± 1.5 | 9.1 ± 3.0 | 8.9 ± 4.5 | 9.4 ± 4.6 | 3.4 | 0.028 | TYP > RD, ADHD, COM | |
| VM category switching | Ability to fluently generate words of two categories | 12.5 ± 3.1 | 9.2 ± 3.6 | 9.8 ± 1.8 | 8.4 ± 3.8 | 3.6 | 0.021 | TYP > RD, ADHD, COM | |
| CWI color naming | Measure of basic naming | 12.8 ± 2.2 | 8.6 ± 2.8 | 9.2 ± 3.9 | 10.1 ± 3.4 | 4.1 | 0.01 | TYP > RD, ADHD, COM | |
| CWI word naming | Measure of basic reading | 12.9 ± 1.4 | 8.6 ± 3.0 | 9.3 ± 2.6 | 9.7 ± 1.9 | 7.4 | <0.001 | TYP > RD, ADHD, COM | |
| CWI interference | Verbal inhibition (traditional Stroop task) | 13.4 ± 1.5 | 7.7 ± 3.2 | 9.4 ± 3.6 | 9.2 ± 4.5 | 6.1 | 0.001 | TYP > RD, ADHD, COM | |
| CWI inhibition/switching | Measure of inhibition and cognitive flexibility | 12.2 ± 1.8 | 8.4 ± 2.1 | 9.5 ± 2.3 | 8.7 ± 3.4 | 4.6 | <0.001 | TYP > RD, ADHD, COM | |
| IQ | KBIT‐2 matrices | Non‐verbal IQ test | 113.1 ± 11.1 | 104.9 ± 9.8 | 106.1 ± 19.7 | 101.6 ± 14.8 | 1.4 | 0.264 | n.a. |
| Gender | (females/total) | 7/15 | 8/15 | 4/15 | 2/5 | Chi‐Square test | n.a. | ||
| χ2 = 2.4 | p = 0.493 | ||||||||
In each child, we examined nonverbal IQ with a common IQ test for children (Kaufman Brief Intelligence Test, 2nd Edition [KBIT‐2]). Reading and reading‐related skills were examined through rapid automatized naming (RAN/RAS numbers and letters; Wolf & Denckla, 2005), phonological processing (Comprehensive Test of Phonological Processing [CTOPP], elision and memory for digits; Wagner, Torgesen, & Rashotte, 1999); silent word reading fluency (Test of Silent Word Reading Fluency [TOSWRF]; Mather, Hammill, Allen, & Roberts, 2004); speeded single word and nonword reading (Test of Word Reading Efficiency [TOWRE], sight word efficiency and phonemic decoding efficiency; Torgesen, Wagner, & Rashotte, 1999); and reading comprehension (Woodcock Reading Mastery Test‐Revised [WRMT‐R], passage comprehension). To examine key components of executive function, we used the Delis–Kaplan Executive Function System [D‐KEFS] (Stephens, 2014), which is a standardized battery of tests often used to study children with ADHD (Stern & Morris, 2013; Wodka et al., 2008; Wodka et al., 2008). In line with Stern and Morris (2013), who studied the discrimination of ADHD and RD in college‐level adults, we focused the psychometric analysis on three subtests: trail making (TM), which measures flexibility of task execution; verbal fluency (VF), which assesses fluent productivity; and color‐word interference (CWI), which assesses verbal inhibition. For each group, the mean, standard deviation and all corresponding statistical values (F and p values) are displayed.
2.4. Experimental tasks and imaging data analyses
2.4.1. Artifact detection
All MRI scans were acquired on a SIEMENS 3.0 T Trio MR whole body scanner. In‐depth artifact detection was performed for all structural and functional images. For the fMRI images, the Artifact Detection Tools (ART) toolbox (http://www.nitrc.org/projects/artifact_detect/) was used to identify artifactual time points using a movement threshold of 2 mm and a rotation threshold of 0.02 radians, and images with artifacts and voxel‐wise spikes were subsequently regressed out. Subjects were only included in the analyses if more than 80% of their images were artifact‐free (thus, four subjects were excluded from go/no‐go [2 COM, 1 ADHD, and 1 TYP], two from phonological processing [1 COM and 1 ADHD], and two from reading fluency [1 ADHD and 1 RD]). The artifact detection was conducted for each fMRI task (go/no‐go, phonological processing, and reading fluency) independently.
To ensure that the results were not biased by differences in motion across the groups, composite movement scores (mean of linear motion parameters [X, Y, Z] in mm as a function of time) provided by the ART toolbox were calculated. An ANOVA and independent t tests were used to compare the composite motion scores between the groups. The significance level was set to p < 0.05 uncorrected for multiple comparisons. The analysis of the motion outliers revealed no significant differences between the groups (all p > 0.27). Nevertheless, motion parameters were entered as regressors for all fMRI analyses. To ensure good data quality, quality control was performed on all structural images by checking successful linear transformations and reconstructions. Corrections were made if edits of the pial surface and/or white matter surface were necessary (n = 3). FreeSurfer software guidelines were used for editing purposes (http://surfer.nmr.mgh.harvard.edu/).
2.4.2. Cortical thickness analysis
T1‐weighted MPRAGE MRI sequences were acquired with a sagittal orientation and the following specifications: 128 slices, repetition time (TR) of 2000 ms; inversion time (TI) of 900 ms; field of view (FOV) 256 × 256 mm; voxel size = 1.3 × 1.0 × 1.3 mm (resampled to isotropic voxel size of 1.0 × 1.0 × 1.0 mm); flip angle = 9°; and echo time (TE) = 3.39 ms. The FreeSurfer 5.1 image analysis suite was used for cortical reconstruction (http://surfer.nmr.mgh.harvard.edu/) and cortical thickness was measured at each vertex using FreeSurfer. This method is based on high‐resolution three‐dimensional MRI scans, registered into a common surface‐based space, and is designed to detect significant regional differences in cortical thickness with submillimeter precision. The technical details of these procedures are described in prior publications (Dale, Fischl, & Sereno, 1999; Fischl, Salat, et al., 2004; Fischl, van der Kouwe, et al., 2004; Fischl & Dale, 2000). In short, the structural high‐resolution T1‐weighted MRI scan was used to construct models of each participant's cortical surface in order to measure cortical thickness. This automated procedure contained segmentation of the cortical and subcortical white matter (Dale et al., 1999), tessellation of the gray matter/white matter boundary, inflation of the folded surface tessellation patterns (Fischl, Sereno, & Dale, 1999; Fischl, Sereno, Tootell, & Dale, 1999), and automatic correction of topological defects in the resulting manifold (Fischl & Dale, 2000). The FsAverage template was used because previous work has found FsAverage to be adequate in the age range of the present sample.1 The procedures for measuring cortical thickness have been validated against manual measurements (Kuperberg et al., 2003; Salat et al., 2004) and histological analysis (Rosas et al., 2002). For each participant, cortical thickness was computed on a uniform grid (comprised of vertices) with about 1 mm spacing across both cortical hemispheres, with the thickness being defined by the shortest distance between the gray/white and pial surface models. Data were re‐sampled for all subjects and rendered onto a common spherical coordinate system (Fischl et al., 1999). Then surface‐based, vertex‐wise cortical thickness was computed for each participant. For the whole‐brain vertex‐wise analysis, the data were smoothed on the surface tessellation using an iterative nearest‐neighbor averaging procedure corresponding to a two‐dimensional surface‐based diffusion‐smoothing kernel with a full width at half maximum of about 15 mm. This cortical thickness was then subjected to statistical analyses (see below).
2.4.3. Striatal volumetric analysis
Previous ADHD literature reported diminished brain activation and structural atypicalities in striatal regions in children and adults with ADHD compared to matched controls (Cubillo, Halari, Smith, Taylor, & Rubia, 2012; Durston, 2003; Durston et al., 2003). Therefore, we used the FreeSurfer image analysis suite (see above) to examine the volume of the striatum, which comprises the caudate nucleus and putamen. The subcortical segmentation procedure provides the volumes of subcortical structures and is described in more detail elsewhere (Fischl et al., 2002; Walhovd et al., 2005). First, the caudate nucleus and putamen were segmented individually for the right and left hemispheres. Next, the volume of the striatum was calculated for each hemisphere by adding the volume of the caudate nucleus and putamen.
2.4.4. Go/no‐go task and analysis
To evaluate sustained attention and response inhibition, a nonverbal inhibition task (go/no‐go paradigm) was employed. A recent meta‐analysis has shown reliable and robust neural deficits for inhibition tasks in children with ADHD compared to controls (Hart et al., 2013). A slightly modified version of a previously described go/no‐go task (Suskauer, Simmonds, Caffo, et al., 2008; Suskauer, Simmonds, Fotedar, et al., 2008) was used. Subjects were presented with images of cartoon crabs and told to press the button as quickly as possible when a green, yellow or blue crab appeared (go), but to refrain from pressing the button if the crab was red (no‐go). The go/no‐go task was programmed in an event‐related fashion using Presentation software (Version 0.70, http://www.neurobs.com/). The entire experiment consisted of two runs, each lasting approximately 7 min. There were 220 trials in each run with 165 (75%) “go” 55 (25%) “no‐go” trials. During each trial, an image signaling the “go” or “no‐go” action was first presented for 200 ms, followed by a fixation cross with a jittered duration ranging from 1.3 to 10 s before the next trial started (see also Supporting Information Figure S1). Participants were instructed to press the button in response to a “go” image within the fixation period while restraining from any action in response to a “no‐go” image.
Each child completed nine practice trials before scanning to ensure that they understood the task. Before the start of the first run, additional functional images were obtained and later discarded to allow for T1 equilibration effects. The stimuli were pseudorandomized with the following constraints: go images always appeared three or more times in a row; no‐go cues never appeared more than twice in a row; and a no‐go image did not appear as the first trial in a run. Each run comprised different images sequences to mitigate a learning effect. Between images and during rest phases, subjects were continuously shown a central fixation marker, on which they had been instructed to focus. The rest phases allowed recovery of the hemodynamic response associated with the steady and rapid stream of go/no‐go trials.
In each run, 202 whole‐brain images were acquired with a 32‐slice functional echo‐planar acquisition (interleaved ascending acquisition) using a TR = 2000 ms; FOV = 192 × 192 mm (full brain coverage); voxel size = 3 × 3 × 4 mm; flip angle = 90°; and TE = 30 ms. FSL 4.1.9 (http://www.fmrib.ox.ac.uk/fsl) was used to preprocess the data. Whole‐brain analysis was performed in three stages. First, the preprocessing included motion correction (MC FLIRT), slice‐timing correction, brain extraction (BET), spatial smoothing (4 mm FWHM kernel), high pass filtering (50 s) and linear registration (12 degrees of freedom) to the MNI 152 T1 template (FLIRT). Second, a first‐level model was conducted for each session. Regressors were modeled for the (1) inter‐trial crosshair; (2) go stimuli pressed; (3) go stimuli omitted; (4) no‐go stimuli pressed; (5) no‐go stimuli omitted; and (6) all responses. In addition, motion parameters were defined as confounding extraneous variables (EVs). The two runs of each subject were combined in a fixed‐effects model. Subsequently, the data were entered into a group random‐effects analysis (FLAME 1). As a contrast, the successfully inhibited no‐go stimuli were used and contrasted with the implicit task baseline (crosshair). This approach is widely used to analyze imaging data of a go/no‐go task (Blasi et al., 2006; Garavan, Ross, Murphy, Roche, & Stein, 2002; Liddle, Kiehl, & Smith, 2001; Mostofsky et al., 2003; Suskauer, Simmonds, Caffo, et al., 2008; Suskauer, Simmonds, Fotedar, et al., 2008). In‐scanner performance was analyzed by computing the sensitivity index dPrime (d′), measured as Z(hit rate) – Z(false alarm rate).
2.4.5. Phonological processing task and analysis
In order to assess whether COM children show the hypoactivation characteristically seen in children with RD within the posterior reading network (for meta‐analyses, see Martin et al., 2015; Richlan et al., 2009, 2011, 2013; Temple, 2002), we employed a traditional phonological processing task. The identical stimuli, task and procedure as previously described by Powers et al. (2016); Raschle, Zuk, & Gaab, (2012); Yu, Raney, et al. (2018) were used. Briefly, this phonological processing task involved listening to two common‐object words spoken sequentially in a female or male voice while images of the objects simultaneously appeared on the screen. In the experimental condition, children determined whether or not the two words started with the same first sound, indicating their responses via a button press. In the control condition, participants instead determined whether or not the two words were spoken by someone of the same sex or different sexes. This control task accounts for basic auditory and speech processing. Each child performed two consecutive fMRI runs, one with the experimental task and one with the control task, to avoid confusion in our participants. This is of great importance since the experimental and control tasks contain exactly the same stimuli and only the task instructions differed. For children with learning disabilities and especially ADHD, as well as young children, this presents a major challenge. The experimental task was comprised of seven blocks of four trials each (24 s). A single trial is illustrated in the Supporting Information Figure S1. Following the same structure, a separate experimental run was constructed as a control condition using the same stimuli, during which participants were required to decide whether the names were spoken by the same sex or not. In experimental and control tasks, 50% of all items matched regarding their first sound and 50% of the words were spoken in a male/female voice. The task order was counterbalanced across participants. The whole task lasted approximately 6 min. For each run, 56 functional whole‐brain images were acquired with a 32‐slice EPI echo‐planar acquisition (interleaved ascending) with the following specifications: TR = 6,000 ms; FOV = 256 × 256 mm; voxel size = 3 × 3 × 4 mm; flip angle = 90°; TE = 30 ms. A behavioral interleaved gradient imaging design (BIG) allowed the auditory stimuli to be presented without scanner background‐noise interference. Before the start of the first run, additional functional images were obtained and later discarded to allow for T1 equilibration effects. Image preprocessing and analyses were implemented in FSL 4.1.9 (http://www.fmrib.ox.ac.uk/fsl) with the same protocol explained above for go/no‐go. The following regressors were modeled for the first‐level analysis: (1) inter‐trial crosshair; (2–3) first word and second word; (4–5) experimental and control condition; (6) question mark stimulus presented; (7) responses. In addition, motion parameters were defined as confounding extraneous variables (EVs). Subsequently, the data were entered into a group random‐effects analysis (FLAME 1). Contrast images for experimental > control condition (first‐sound matching > voice matching) were calculated. The number of correct responses was calculated for in‐scanner performance. For a comprehensive description of the task, please refer to Raschle, Zuk & Gaab (2012).
2.4.6. Reading fluency task and analysis
The task and MRI procedure were identical to Langer et al. (2013), which is a child‐adapted version of Benjamin & Gaab (2011). The exact structure of the task is illustrated and described in Benjamin & Gaab (2011). In brief, prior to entering the MRI scanner, each child's comfortable reading speed was individually determined. An accelerated (“fast”) word reading speed was determined as 35% faster than the comfortable rate. In the scanner, children read sentences, which were presented at their comfortable and accelerated reading speeds. For a detailed analysis of the construction of the sentences, including reference to sentence length, word frequency, familiarity, concreteness, imageability, and number of phonemes, please refer to Langer et al. (2013). Identical to Langer et al. (2013), a control condition comprised of word‐like groups of the letter n matched to sentence stimuli was implemented (see Supporting Information Figure S1). In the control condition, subjects were asked to read through the letters and identify the one differing letter (f, p, or x). The study design for the reading fluency task was comprised of two experimental runs, each lasting approximately 9 min. In each run, 21 task trials were mixed with 21 control trials in an event‐related fashion. Importantly, the event‐related fMRI design allows different event durations in order to accommodate sentences presented at individually determined reading speeds. As we deliberately matched the duration of the experimental and control conditions, the canonical hemodynamic response function modeled the actual response for each subject identically. Each trial started with a cue image (500 ms) indicating the presentation rate of the following sentence. After a blank screen of 200 ms, each of the four words (constituting a sentence for the task condition) or letter strings (consisting of the letter n and one oddball letter of either f, p or x in the control condition) appeared from left to right at the determined speed for each subject. The stimuli were then replaced by another blank screen (200 ms) followed by a comprehension question, during which the participants were required to select one of the three pictures best representing the preceding sentence (the task condition) or the oddball letter (the control condition) within 3,000 ms. A fixation cross was finally presented with a jittered duration (up to 2,000 ms) before the next trial started (see also Supporting Information Figure S1). Over both runs, 56 sentences (28 word sentences, 28 control condition sentences) were presented at normal (14 word/control condition sentences) or accelerated (14 word/control condition sentences) speed. All the conditions were pseudorandomized.
All subjects underwent two fMRI runs and 271 whole‐brain images were acquired with a 32‐slice functional echo‐planar acquisition (interleaved ascending) using a TR = 2,000 ms; FOV = 192 × 192 mm; voxel size = 3 × 3 × 4 mm; flip angle = 90°; TE = 30 ms. For preprocessing and data analysis, we used the same protocol described above for the go/no‐go and phonological processing tasks. A first‐level model was again conducted for each session. Data were prewhitened and regressors were modeled for the (1) speed cue; (2–3) comfortable and accelerated fluent sentence reading; (4–5) comfortable and accelerated letter reading; (6–7) sentence and control comprehension stimuli; and (8) inter‐trial fixation. In addition, motion parameters were defined as confounding extraneous variables (EVs). The four words of each sentence were entered as a single event with the total duration of all four words together. The two runs of each subject were combined in a fixed‐effects model. Subsequently, the data were entered into a group random‐effects analysis (FLAME 1). Contrasts were assessed between fast sentence reading and rest (fixation cross) regressors because our previous study (Langer et al., 2013) showed that differences between RD and TYP were most prominent in this contrast.
2.5. Statistical group analyses
2.5.1. Whole‐brain analysis
To detect local differences in cortical thickness between the clinical groups and typically developing children, we computed vertex‐wise analyses using a general linear model (total intracranial volume was entered as a covariate in the model) with an uncorrected threshold of p < 0.005, and performed multiple‐comparison correction with the cluster‐level false discovery rate (FDR) at p < 0.05 (Genovese, Lazar, & Nichols, 2002). Beforehand, smoothing was applied to each subject's three‐dimensional cortical surface map for gray matter thickness (kernel radius 15 mm full width half maximum). Post hoc t tests were run on the significant clusters to determine the direction of the effects (Bonferroni adjusted alpha level of 0.008 [0.05/6]) (Holm, 1979; Shaffer, 1995). The same statistical approach was also used for the striatal volume. The fMRI data were analyzed with two independent methods: one‐way whole‐brain ANOVA and an independent ROI analysis, with predefined regions of interest (see Section 2.5.2.). Effects were initially evaluated at the whole‐brain level with a significance threshold utilized in previous publications that employed the identical fMRI tasks (Langer et al., 2013; Raschle et al., 2014; Raschle, Zuk, & Gaab, 2012; Suskauer, Simmonds, Caffo, et al., 2008), at an uncorrected voxel‐level threshold of p < 0.005 and an extended threshold of k > 10 voxels. For the significant clusters, post hoc t tests were performed with a significance level of p = 0.008 [0.05/6], Bonferroni adjusted for all possible group comparisons. Adjusted p values are reported in parentheses. These initial analyses aimed to identify activation differences in brain regions between the investigated groups. However, to further examine results with correction for multiple comparisons, an independent ROI analysis, with predefined regions of interest, was employed (see Section 2.5.2.).
A one‐way ANOVA was performed, rather than a 2 × 2 design, because the latter implicitly assumes that the COM brain activation pattern is the sum of the single‐disorder factors. Such an analysis would bias the results, as a specific aim of the present study was to test whether comorbidity of RD–ADHD is a unique disorder or simply the addition of the two individual clinical conditions. Thus, the one‐way ANOVA is an appropriate analysis approach here because it is blind to any direction of possible group differences.
2.5.2. ANOVA with predefined ROIs for fMRI paradigms
To replicate results from previous studies and validate the results of the whole‐brain fMRI analyses, an additional one‐way ANOVA was implemented using predefined regions of interest (ROIs) based on strong a priori hypotheses from previous results employing the same paradigms (Langer et al., 2013; Raschle, Zuk, & Gaab, 2012; Suskauer, Simmonds, Caffo, et al., 2008; Suskauer, Simmonds, Fotedar, et al., 2008).
Go/no‐go task
The validation analysis of the whole‐brain one‐way ANOVA for the go/no‐go task was restricted to one ROI and only the contrast no‐go versus rest was examined (representing the ability to inhibit a response as it is widely used in previous go/no‐go publications) (Blasi et al., 2006; Garavan et al., 2002; Liddle et al., 2001; Mostofsky et al., 2003; Suskauer, Simmonds, Caffo, et al., 2008; Suskauer, Simmonds, Fotedar, et al., 2008). The ROI was based on previous studies with an equivalent paradigm (Suskauer, Simmonds, Caffo, et al., 2008; Suskauer, Simmonds, Fotedar, et al., 2008) that found decreased activation in children and adults with ADHD compared to TYP in the junction between the supplementary motor area and the anterior cingulate gyrus during no‐go response inhibition. Moreover, a recent meta‐analysis found that the commonly reported right inferior frontal cortex or insula and thalamus deficits are only deficient in adults with ADHD, whereas the supplementary motor area (SMA) and anterior cingulate cortex (ACC) deficits were observed in children with ADHD (Hart et al., 2013). Therefore, the SMA/ACC region was selected as a ROI. A 5‐mm sphere was drawn around the peak coordinate (x = 8, y = 16, z = 8; see Supporting Information Figure S2), which was chosen based on the main finding in Suskauer, Simmonds, Caffo, et al. (2008). A one‐way ANOVA (p < 0.05) and subsequent t tests (Bonferroni adjusted alpha level of 0.008 [0.05/6]) were performed. Adjusted p values are reported in parentheses.
Phonological processing task
The ROI analysis for the phonological processing task was calculated with the following left‐hemispheric regions of interest: the superior temporal gyrus (x = −50, y = −28, z = 14), an occipital–temporal area (x = −48, y = −56, z = 6), and the fusiform gyrus (x = −16, y = −86, z = −10; see Supporting Information Figure S2). A 5‐mm sphere was drawn around the peak coordinates. The coordinates of the ROIs were selected based on previously published results using the same task and contrast, which revealed greater activation in these left hemispheric brain regions in typically developing individuals compared to children at risk for developmental dyslexia (Raschle, Chang, & Gaab, 2011; Raschle, Zuk, & Gaab, 2012). A variety of additional studies have found hypoactivations in these regions in children and adults with a diagnosis of dyslexia (Peterson & Pennington, 2015; Richlan et al., 2011; Snowling, 2004). Group differences were established with a one‐way ANOVA (Bonferroni adjusted alpha level of 0.017 [0.05/3]) and subsequent post hoc t tests (Bonferroni adjusted alpha level of 0.008 [0.05/6]). Adjusted p values are reported in parentheses.
Reading fluency task
For the reading fluency task, the validation analysis was restricted to one ROI and the contrast fast sentence reading > rest was examined based on previous results with the same task (see Langer et al., 2013). A 5‐mm sphere was drawn around the peak coordinate (x = −34, y = −72, z = −20) to define the left fusiform gyrus (see Supporting Information Figure S2). The coordinates were derived from the previous study by Langer et al. (2013), which demonstrated reliable differences for this contrast in this region for RD compared to TYP children. Moreover, several studies have identified the importance of the left fusiform gyrus in fluent reading (Kronbichler et al., 2004; Kronbichler et al., 2006; Maurer et al., 2007; Pugh et al., 2001; Richlan et al., 2011; Schulz et al., 2009). The contrast fast sentence reading > rest was compared between all groups with a one‐way ANOVA (p < 0.05) and subsequent post hoc t tests (Bonferroni adjusted alpha level of 0.008 (0.05/6)). Adjusted p values are reported in parentheses.
3. RESULTS
3.1. Behavioral results
3.1.1. Reading‐related tasks
Compared to typically developing children (TYP), children with a comorbid diagnosis (COM), and those with a reading disability (RD) demonstrated significantly decreased performance on all reading and language measures (Figure 1a and Table 1). Children with ADHD also showed decreased performance on most of the reading‐related tasks compared to TYP; no differences were found compared to RD or COM children. The mean and standard deviation of each group's standard score, an overview of the statistical values and a description of each task are depicted in Table 1. Furthermore, an extensive description of the behavioral results of the reading‐related tasks is presented in the Supporting Information section.
Figure 1.
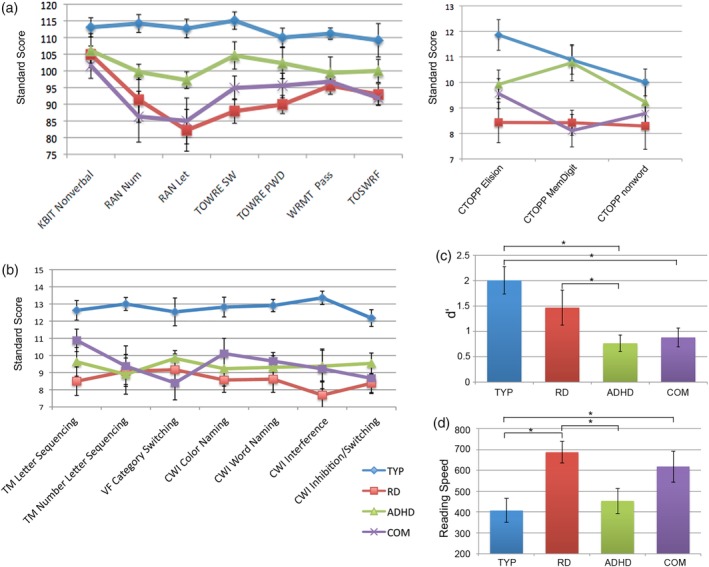
The psychometric and in‐scanner performance results are summarized. The means and the standard errors are presented for all groups: (a) the reading‐related tasks and the nonverbal IQ measure (KBIT); (b) the executive functioning tasks (selected D‐KEFS categories); (c) the in‐scanner performances of the go/no‐go task (d′ = dPrime measure); and (d) the reading fluency task (reading speed in ms). The exact mean values, standard errors, and statistical parameters are reported in Table 1 [Color figure can be viewed at http://wileyonlinelibrary.com]
3.1.2. Executive functioning tasks
On the executive functioning tasks, the TYP group displayed enhanced performance compared to all three clinical groups (Figure 1b). A summary of the standard scores for each group and the statistical values are reported in Table 1. The univariate analysis revealed significant effects for several subtests of the D‐KEFS. The post hoc t tests revealed an enhanced performance of TYP compared to RD, ADHD, and COM for all tests. No significant differences were found between the three clinical groups. Only effects that survived multiple comparisons are reported in Table 1. An extensive depiction of the behavioral results of the executive functioning tasks is described in the Supporting Information section.
3.2. Structural MRI results
3.2.1. Whole‐brain cortical thickness results
A one‐way ANOVA showed that cortical thickness differed significantly across the COM, RD, ADHD, and typically developing children in various regions of the left hemispheric reading network (Figure 2). In particular, the left fusiform gyrus, planum temporale, middle temporal gyrus, inferior frontal gyrus (Broca's area), middle occipital gyrus, and superior frontal gyrus showed increased cortical thickness in TYP compared to RD. For the anterior cingulate cortex, TYP showed greater cortical thickness compared to all other clinical groups. Additionally, COM showed reduced cortical thickness in the middle temporal gyrus compared to all other groups. In the inferior frontal gyrus and the planum temporale, COM displayed decreased cortical thickness compared to typically developing children. All clusters are summarized in Table 2 and Figure 4.
Figure 2.
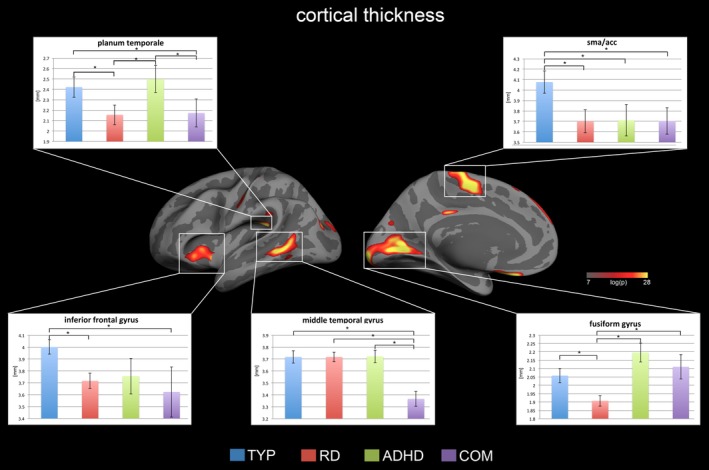
Displayed are the cortical thickness results for the whole‐brain one‐way ANOVA with p values below <0.05 FDR corrected for multiple comparisons. There were significant group effects only in the left hemisphere, particularly in the reading network and the intersection between the SMA and ACC. Representative bar plots reveal the mean and standard error for each group in key regions. The complete list of results can be found in Figure 4 and Table 2 [Color figure can be viewed at http://wileyonlinelibrary.com]
Table 2.
The results of the whole‐brain ANOVA for the cortical thickness analysis are listed
| Max (log(p)) | Size (mm2) | x | y | z | Label | Post hoc t tests corrected for multiple comparisons |
|---|---|---|---|---|---|---|
| 19.27 | 491.76 | −10.2 | 16.8 | −13.5 | Left frontal orbital cortex | n.s. |
| 14.89 | 2,484.68 | −16.1 | −94.8 | 1.3 | Left fusiform gyrus | TYP, ADHD, COM > RD |
| 14.69 | 633.88 | −8.3 | −8.3 | 52.1 | Left SMA/ACC | TYP > RD, ADHD, COM |
| 13.92 | 663.43 | −41.7 | −22.1 | 53.4 | Left central sulcus | TYP, ADHD > RD |
| 13.85 | 295.59 | −39.1 | −23.3 | 23.1 | Left planum temporale | TYP, ADHD > RD, COM |
| 11.21 | 789.84 | −62 | −47.7 | 3.2 | Left middle temporal gyrus | TYP, ADHD, RD > COM |
| 8.85 | 90.66 | −5.8 | −27.3 | 32.8 | Left posterior cingulate gyrus | n.s. |
| 8.78 | 62.51 | −5 | −6.9 | 26 | Left sulcus pericallosal | n.s. |
| 8.56 | 493.17 | −32.8 | 9 | −5.3 | Left inferior frontal gyrus | TYP > RD, COM |
| 8.40 | 230.28 | −36.5 | −83.2 | 22.3 | Left middle occipital gyrus | TYP > RD |
| 5.31 | 170.41 | −16.5 | −89.4 | 22.2 | Left superior occipital gyrus | n.s. |
| 5.29 | 170.64 | −8.2 | 57.9 | 24.8 | Left superior frontal gyrus | TYP > RD |
| 5.06 | 70.64 | −49.9 | −35.5 | 31.8 | Left supramarginal gyrus | n.s. |
| 3.80 | 80.3 | −53.3 | −56.2 | −4.2 | Left middle temporal gyrus | TYP > ADHD, COM |
The table displays the clusters with the max log[p] value, the size of the cluster, the MNI coordinates and the annotation. In addition, the post hoc t tests demonstrate the specific group differences only for the comparisons that survive correction for multiple comparisons. n.s. = not significant.
Figure 4.
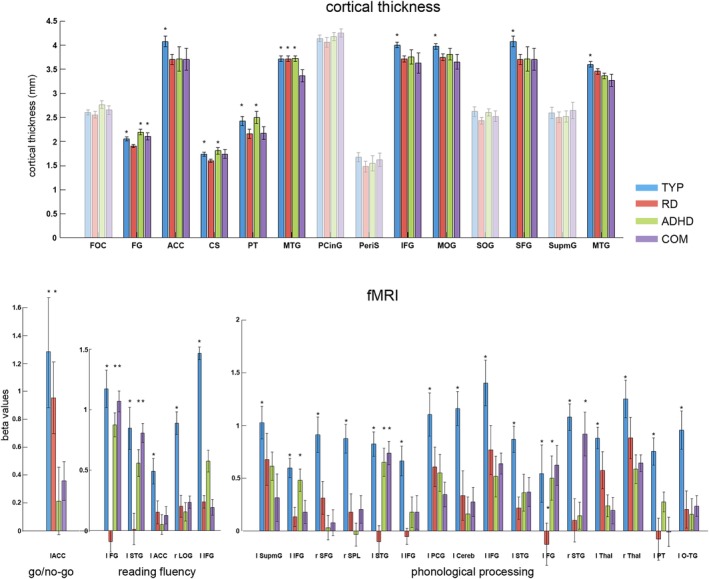
The post hoc analysis for the whole‐brain ANOVA is illustrated for each imaging task, and bar plots are displayed for all significant clusters. The transparent bar plots did not survive correction for multiple comparisons in the post hoc t test analysis. The mean and standard error of the beta values of each group and all significant clusters are displayed. The asterisk indicates increased cortical thickness or brain activation for this group. The exact comparisons can be found in Tables 2, 3, 4, 5. Abbreviations: FOC = frontal orbital cortex; FG = fusiform gyrus; ACC = anterior cingulate cortex; CS = central sulcus; PT = planum temporale; MTG = middle temporal gyrus; PCinG = posterior cingulate gyrus; PeriS = sulcus pericallosal; IFG = inferior frontal gyrus; MOG = middle occipital gyrus; SOG = superior occipital gyrus; SFG = superior frontal gyrus; SupmG = supramarginal gyrus; STG = superior temporal gyrus; LOG = lateral occipital gyrus; SPL = superior parietal lobe; PCG = postcentral gyrus; Cereb = cerebellum; Thal = thalamus; O‐TG = occipital‐temporal gyrus [Color figure can be viewed at http://wileyonlinelibrary.com]
3.2.2. Striatal volume results
The volumetric analysis of the striatum revealed a significant group effect in the right striatum (F = 3.38, p = 0.02). The post hoc t test analysis showed an increased striatal volume for the TYP group compared to the ADHD group (t = 3.01, p = 0.006, corrected for multiple comparisons: adjusted p = 0.036). No post hoc significant group differences were found between the three clinical groups, nor in the comparison between the TYP group and the RD or COM group. No group effects were found for the left striatal volume.
3.3. Whole‐brain functional MRI results
3.3.1. Go/no‐go results
The one‐way ANOVA for the in‐scanner performance revealed a significant effect for the d′ measure (F = 4.92, p = 0.006; Figure 1c). Post hoc t tests showed significantly decreased performance for children with ADHD and COM compared to TYP children (TYP vs. ADHD: t = 3.85, p = 0.001, corrected for multiple comparisons: adjusted p = 0.006; TYP vs. COM: t = 3.32, p = 0.002 [adjusted p = 0.012]). In addition, RD performed significantly better compared to the ADHD group (t = 3.01, p = 0.006 [adjusted p = 0.036]) and a trend was observed for the comparison between RD and COM. There were no significant differences between the ADHD and COM group.
The ANOVA for the go/no‐go task revealed a significant group effect only in the left anterior cingulate cortex (Figure 3; F = 5.40, p = 0.002). The post hoc t test analysis exhibited increased brain activation for the TYP group compared to the ADHD and COM groups (TYP vs. ADHD: t = 3.53, p = 0.002 [adjusted p = 0.012]; TYP vs. COM: t = 3.17, p = 0.004 [adjusted p = 0.024]). In addition, the RD group displayed stronger activation compared to the ADHD and COM group (RD vs. ADHD: t = 3.06, p = 0.005 [adjusted p = 0.03]; RD vs. COM: t = 2.88, p = 0.007 [adjusted p = 0.042]) (Table 3, Supporting Information Figure S1). There were no differences between the ADHD and COM groups, nor the TYP and RD groups.
Figure 3.
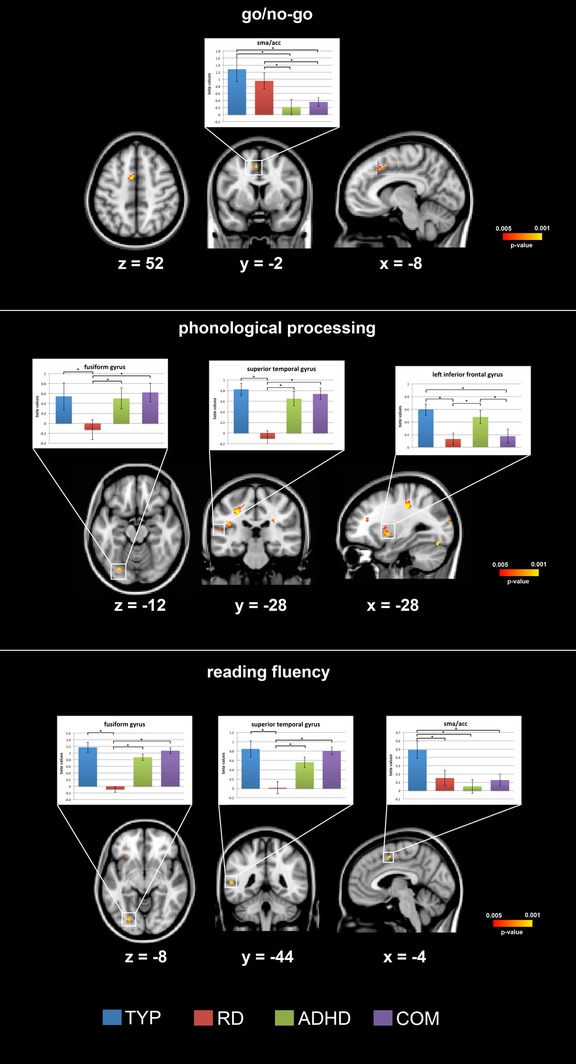
The results for the whole‐brain one‐way ANOVA for each fMRI task, with p values below p < 0.005 uncorrected for multiple comparisons, are plotted. Representative bar plots demonstrate the mean and standard error of the beta values for each group in key regions of the reading and executive function networks. MNI coordinates are presented for the respective brain slice. The complete list of results can be found in Figure 4 and Tables 3, 4, 5 [Color figure can be viewed at http://wileyonlinelibrary.com]
Table 3.
The results of the whole‐brain ANOVA analysis for the go/no‐go task are listed
| Voxels | p value | x (mm) | y (mm) | z (mm) | Label | Post hoc t tests corrected for multiple comparisons |
|---|---|---|---|---|---|---|
| 26 | 0.00236 | −8 | −2 | 52 | Left anterior cingulate cortex | TYP, RD > ADHD, COM |
The table displays the clusters with the p value, the number of voxels, the MNI coordinates, and the annotation. In addition, the post hoc t tests demonstrate the specific group differences only for the comparisons that survive correction for multiple comparisons.
3.3.2. Phonological processing results
Although the TYP group displayed higher accuracy on the phonological processing task, the one‐way ANOVA for in‐scanner performance revealed no significant effect (F = 1.66, p = 0.18).
The one‐way whole‐brain ANOVA for the phonological processing task revealed significant differences in the left superior temporal gyrus (F = 8.32, p = 0.00002). Post hoc t tests revealed stronger activation in the TYP compared to RD group (TYP vs. RD: t = 3.46, p = 0.002 corrected for multiple comparisons: adjusted p = 0.012) while the COM exhibited increased activity compared to the RD (COM vs. RD: t = 3.23, p = 0.003 [adjusted p = 0.018]), as did ADHD compared to the RD group (ADHD vs. RD: t = 3.17, p = 0.004 [adjusted p = 0.024]). The whole‐brain ANOVA further identified significant differences in the left fusiform gyrus (F = 7.64, p = 0.0002): the TYP, ADHD, and COM groups displayed increased brain activity compared to the RD group (TYP vs. RD: t = 2.97, p = 0.006 [adjusted p = 0.036]; ADHD vs. RD: t = 2.89, p = 0.007 [adjusted p = 0.042]; COM vs. RD: t = 3.09, p = 0.004 [adjusted p = 0.024]). The one‐way whole‐brain ANOVA further revealed a significant effect in the left inferior frontal gyrus (F = 7.91, p = 0.002). The post hoc t tests found increased activity in the TYP and ADHD compared to RD and COM groups (TYP vs. RD: t = 3.31, p = 0.003 [adjusted p = 0.018]; TYP vs. COM: t = 3.09, p = 0.005 [adjusted p = 0.03], ADHD vs. RD: t = 3.14, p = 0.004 [adjusted p = 0.023], ADHD vs. COM: t = 2.89, p = 0.007 [adjusted p = 0.043]). The whole‐brain ANOVA uncovered significant differences in various additional components of the reading network, including the left supramarginal gyrus, left inferior frontal gyrus (Broca's area), left planum temporale, left occipitotemporal gyrus, and subcortical regions, such as the bihemispheric thalamus and the left cerebellum (Table 4, Figure 3). In each of these regions, TYP showed increased brain activation compared to RD, ADHD, and COM. The complete overview of these results can be found in Table 4 and Figure 4.
Table 4.
The results of the whole‐brain ANOVA analysis for the phonological processing task are listed
| Voxels | p value | x (mm) | y (mm) | z (mm) | Label | Post hoc t tests corrected for multiple comparisons |
|---|---|---|---|---|---|---|
| 201 | 0.00011 | −36 | −28 | 38 | Left supramarginal gyrus | TYP > COM |
| 186 | 0.00022 | −36 | 30 | 22 | Left inferior frontal gyrus (BA 45) | TYP, ADHD > RD, COM |
| 166 | 0.00026 | 20 | 12 | 44 | Right superior frontal gyrus | TYP > RD, ADHD, COM |
| 98 | 0.00020 | 6 | −42 | 46 | Right superior parietal lobe | TYP > ADHD |
| 89 | 0.00002 | −60 | −12 | 16 | Left superior temporal gyrus | TYP, COM > RD, ADHD |
| 86 | 0.00044 | −34 | 6 | 2 | Left inferior frontal gyrus (BA 44) | TYP > RD |
| 77 | 0.00074 | −38 | −12 | 42 | Left postcentral gyrus | TYP > COM |
| 67 | 0.00093 | −42 | −62 | −40 | Left cerebellum | TYP > RD, ADHD, COM |
| 57 | 0.00035 | 50 | 22 | 22 | Right inferior frontal gyrus | TYP > ADHD, COM |
| 48 | 0.00148 | −36 | −6 | 18 | Left superior temporal gyrus | TYP > RD |
| 40 | 0.00025 | −26 | −76 | −18 | Left fusiform gyrus | TYP, ADHD, COM > RD |
| 35 | 0.00085 | 42 | −28 | 22 | Right superior temporal gyrus | TYP, COM, RD > ADHD |
| 30 | 0.00060 | −18 | −10 | 12 | Left thalamus | TYP > ADHD, COM |
| 26 | 0.00097 | 24 | −24 | 10 | Right thalamus | TYP > ADHD, COM |
| 21 | 0.00149 | −58 | 0 | 6 | Left planum temporale | TYP > RD, ADHD, COM |
| 20 | 0.00146 | −20 | −62 | 10 | Left occipitotemporal gyrus | TYP > RD, ADHD, COM |
The table displays the clusters with the p value, the number of voxels, the MNI coordinates and the annotation. In addition, the post hoc t tests demonstrate the specific group differences only for the comparisons that survive correction of multiple comparisons.
3.3.3. Reading fluency results
The one‐way ANOVA revealed a significant effect for comfortable reading speed (F = 4.04, p = 0.01). Post hoc t tests revealed an increased comfortable reading speed in TYP compared to the RD and COM groups (TYP vs. RD: t = −4.35, p = 0.0003 corrected for multiple comparisons: adjusted p = 0.0019; TYP vs. COM: t = −3.74, p = 0.0009 [adjusted p = 0.005]; see Figure 1c). In addition, the ADHD group exhibited faster reading speed compared to RD (t = −3.32, p = 0.003 [adjusted p = 0.017]). No significant group differences were observed for in‐scanner comprehension accuracy.
The whole‐brain analysis for the reading fluency task revealed significant group differences in the left fusiform gyrus (F = 8.73, p = 0.00007), left superior temporal gyrus (F = 6.22, p = 0.0009), left anterior cingulate cortex (F = 7.67, p = 0.0002), right lateral occipital cortex (F = 5.11, p = 0.003), and left inferior frontal gyrus (Broca's area; F = 4.89, p = 0.004; Table 5, Figure 3). The subsequent t test demonstrated significantly increased brain activity in the left fusiform gyrus for TYP compared to the RD group (TYP vs. RD: t = 5.59, p < 0.0001 [adjusted p = 0.0005]). Moreover, the COM and ADHD groups displayed stronger activation compared to the RD group (COM vs. RD: t = 5.23, p = 0.0002 [adjusted p = 0.001]; ADHD vs. RD: t = 4.92, p = 0.0003 [adjusted p = 0.002]). Similar post hoc results were observed for the left superior temporal gyrus. The TYP group showed increased activation compared to the RD group (t = 3.55, p = 0.001 [adjusted p = 0.006]), and the COM and ADHD groups displayed stronger activity compared to the RD group (COM vs. RD: t = 3.41, p = 0.002 [adjusted p = 0.011]; ADHD vs. RD: t = 3.03, p = 0.005 [adjusted p = 0.031]). Additionally, the TYP group demonstrated increased activity in the anterior cingulate cortex compared to all clinical groups (TYP vs. RD: t = 3.01, p = 0.003 [adjusted p = 0.018]; TYP vs. ADHD: t = 3.28, p = 0.003 [adjusted p = 0.017]; TYP vs. COM: t = 3.11, p = 0.005 [adjusted p = 0.031]). The post hoc analysis for the right lateral occipital cortex revealed enhanced activation for the TYP compared to all clinical groups. All results are summarized in Table 5 and Figure 4.
Table 5.
The results of the whole‐brain ANOVA analysis for the reading fluency tasks are listed
| Voxels | p value | x (mm) | y (mm) | z (mm) | Label | Post hoc t tests corrected for multiple comparisons |
|---|---|---|---|---|---|---|
| 74 | 0.00007 | −24 | −78 | −6 | Left fusiform gyrus | TYP, ADHD, COM > RD |
| 52 | 0.00091 | −58 | −28 | 10 | Left superior temporal gyrus | TYP, ADHD, COM > RD |
| 36 | 0.00023 | −6 | 4 | 50 | Left SMA/anterior cingulate cortex | TYP > RD, ADHD, COM |
| 16 | 0.00338 | 30 | −74 | 20 | Right lateral occipital cortex | TYP > RD, ADHD, COM |
| 11 | 0.00424 | −58 | −44 | −4 | Left inferior frontal gyrus | TYP > RD, COM |
The table displays the clusters with the p value, the number of voxels, the MNI coordinates and the annotation. In addition, the post hoc t tests demonstrate the specific group differences only for the comparisons that survive correction for multiple comparisons.
3.4. ANOVA results with predefined ROIs for fMRI paradigms
3.4.1. Go/no‐go results
The one‐way ANOVA for the ROI, which was placed at the intersection of the supplementary motor area and the anterior cingulate cortex, revealed a significant effect (F = 4.43, p = 0.007). Post hoc t tests revealed increased brain activity in TYP compared to ADHD (t = 3.07, p = 0.006, corrected for multiple comparisons: adjusted p = 0.035) and COM (t = 3.05, p = 0.007 [adjusted p = 0.042]; Supporting Information Figure S2). A trend towards increased activity in RD compared to ADHD and COM was observed. No other between‐group effects were observed.
3.4.2. Phonological processing results
The one‐way ANOVA for the ROIs revealed significant results for left fusiform (F = 3.76, p = 0.01, corrected for multiple comparisons: adjusted p = 0.03) and left occipitotemporal areas (F = 3.47, p = 0.01 [adjusted p = 0.03]; Supporting Information Figure S2). The post hoc t test revealed decreased activation in the left fusiform gyrus for the RD group compared to the TYP group (t = 3.51, p = 0.002 [adjusted p = 0.011]), COM group (t = 3.23, p = 0.003 [adjusted p = 0.018]) and ADHD group (t = 3.18, p = 0.004, [adjusted p = 0.023]). In the left occipitotemporal ROI, RD exhibited decreased activity compared to TYP and COM (TYP > RD: t = 2.98, p = 0.006 [adjusted p = 0.037]; COM > RD: t = 2.87, p = 0.007 [adjusted p = 0.041]).
3.4.3. Reading fluency results
The one‐way ANOVA for the left fusiform gyrus ROI revealed a significant group effect (F = 3.87, p = 0.01; Supporting Information Figure S2). Post hoc t tests demonstrated significantly increased activation in TYP, ADHD, and COM compared to RD (TYP vs. RD: t = 2.93, p = 0.007, corrected for multiple comparisons: adjusted p = 0.042; ADHD vs. RD: t = 2.87, p = 0.007 [adjusted p = 0.043]; COM vs. RD: t = 3.19, p = 0.003 [adjusted p = 0.019]).
4. DISCUSSION
For the first time, structural and functional MRI were combined with comprehensive behavioral testing to characterize behavior, brain structure and neural correlates of executive functioning, phonological processing, and reading fluency in children with comorbid RD–ADHD (COM) and three control groups. COM performed lower than TYP on reading‐related and executive functioning behavioral measures. However, all three clinical groups had comparably decreased performance (Figure 1) compared to the typically developing group; no specific cognitive profile differentiated a COM diagnosis. Our analyses of the neuroimaging data unveiled neural patterns for COM in regions that are frequently associated with isolated RD or ADHD (Christakou et al., 2013; Cortese, 2012; Hart et al., 2013; Peterson & Pennington, 2012; Richlan et al., 2009; Snowling, 2004; Suskauer, Simmonds, Fotedar, et al., 2008). Interestingly, we also observed shared functional and structural brain atypicalities between isolated RD and ADHD and some regions exhibited distinct brain characteristics for the comorbid RD‐ADHD group, as well as the isolated conditions. Hence, the present results support the multiple deficit hypothesis and the common etiology model for comorbidity of RD and ADHD. In the following, we will first discuss the present results and then integrate them into previous studies and current models describing the comorbidity of RD and ADHD. Subsequently, we will focus on the results of the comorbid group.
4.1. Behavioral findings
The ADHD group primarily displayed decreased executive functioning skills, although they also performed lower than TYP on most reading measures while scoring higher than COM and RD. These findings substantiate previous studies demonstrating lower performance of ADHD compared to TYP in reading comprehension (Miller et al., 2013; Miranda, Mercader, Fernández, & Colomer, 2017; Stern & Morris, 2013), rapid naming (De Jong, Licht, Sergeant, & Oosterlaan, 2013; Ryan et al., 2017), sound discrimination (Smith, Taylor, Rogers, Newman, & Rubia, 2002; Toplak, Rucklidge, Hetherington, John, & Tannock, 2003), and phonological and orthographic processing (Pennington et al., 1993; Purvis & Tannock, 2000; Willcutt et al., 2005).
Compared to TYP, RD revealed decreased performance in reading‐related tasks and on executive functioning tasks that required verbal in/output, whereas no differences were observed for nonverbal executive functioning tasks (e.g., go/no‐go). In a study by De Jong et al. (2013), both ADHD and RD were associated with impaired inhibition and lexical decision. However, the link between RD and impaired inhibition remains unclear. Although some studies report decreased inhibition among RD children (De Weerdt, Desoete, & Roeyers, 2013; Willcutt et al., 2001), others do not observe such deficits (Semrud‐Clikeman et al., 1996). However, numerous newer studies have shown that children with RD show deficits in executive functioning tasks, while children with ADHD display deficits in reading‐related tasks (de Groot, van den Bos, van der Meulen, & Minnaert, 2015; Duff & Sulla, 2015; Moura et al., 2017; Stern & Morris, 2013; Stubenrauch et al., 2014). The present results indicate that RD children experience inhibition deficits for tasks with verbal demands (e.g., verbal working memory), but not for nonverbal tasks, whereas COM children exhibit impaired inhibition regardless of verbal demand. This aligns with studies showing that inhibition is primarily impaired in ADHD and COM (Pennington et al., 1993; Willcutt et al., 2001), while verbal working memory is also deficient in RD (Willcutt et al., 2001, 2005). In general, the performance score in most neuropsychological tests requires multiple cognitive components, which could further explain why RD and ADHD and COM are similarly impeded in various neuropsychological tests. Thus, similar deficits in verbal executive functioning tasks could result from either poor interference control (i.e., in ADHD), impaired phonological representations/memory (i.e., in RD) or both (i.e., in COM), which lead to similar phenotypic deficits, known as equifinality.
4.2. Neuroanatomical findings
The analyses of the brain anatomy revealed group differences within the left‐hemispheric reading network and areas involved in executive functioning (anterior cingulate cortex, supplementary motor area, and prefrontal cortex). Compared to TYP and ADHD, RD and COM demonstrated decreased cortical thickness in left inferior frontal gyrus and the left planum temporale, indicating anatomical atypicalities, which are specifically shared between RD and COM. The RD group especially showed decreased cortical thickness throughout the left‐hemispheric reading network, including the left fusiform gyrus, which aligns with previous studies reporting structural atypicalities in these regions for children with or at risk for RD (Ozernov‐Palchik, Yu, Wang, & Gaab, 2016; Raschle et al., 2011; Richlan et al., 2013; Williams, Juranek, Cirino, & Fletcher, 2018).
Interestingly, COM exclusively displayed decreased cortical thickness in the middle temporal gyrus (MTG), suggesting a specific deficit within this region. The MTG has previously been associated with accessing word meaning during reading (Acheson & Hagoort, 2013; Richlan et al., 2011; Schulz et al., 2009) and MTG hypoactivation has been observed during phonological processing in children with a familial risk for RD (Raschle, Zuk, & Gaab, 2012). Furthermore, ADHD studies have revealed overall decreased functional connectivity in MTG (Wang et al., 2009), decreased MTG activation during inhibition tasks (Schneider et al., 2010), and correlations between decreased MTG activation and ADHD symptom severity (Congdon et al., 2014). Thus, the MTG appears to play a crucial role in reading and executive functioning, but future studies need to further investigate the uniqueness of the neuroanatomical deficits of COM in the MTG.
Anatomical group differences were further identified in the ACC, with decreased cortical thickness in ADHD, RD, and COM compared to TYP. Several studies have previously shown neuroanatomical deficits for ADHD children in the ACC (Amico, Stauber, Koutsouleris, & Frodl, 2011; Bledsoe et al., 2013; Zhan, Liu, Wu, Gao, & Li, 2017). The ACC is implicated in working memory, error monitoring, and modulation of attention, which is why this region is regarded as part of a distributed attentional network (Bush, Luu, & Posner, 2000). These cognitive processes are also required in high‐level cognitive functions, such as successful reading, which has been shown previously (Hancock, Richlan, & Hoeft, 2017; Houde, Rossi, Lubin, & Joliot, 2010) and is further discussed in the next section. Moreover, a prior study has also found decreased gray matter morphology in the ACC in RD compared to TYP children (Hoeft et al., 2007). The fact that in the present study the ACC shows reduced cortical thickness in all clinical groups could be an indicator for a shared common neuroanatomical risk factor, favoring a common etiology model as well as the multiple deficit hypothesis. Multiple deficit hypotheses models, as suggested by McGrath et al. (2011); Pennington, (2006) and van Bergen et al. (2014) propose that a particular (developmental) disorder is shaped by a combination of specific and shared deficits, with shared deficits accounting for comorbidity. This partial overlap of risk factors produces a greater‐than‐expected co‐occurrence of RD and ADHD. The ACC impairment could be such a common underlying neural risk factor.
In summary, the anatomical results demonstrate that the isolated clinical disorders (RD and ADHD) display structural brain alterations in the region specifically important for either reading or executive functioning, whereas COM exhibits additional alterations in brain regions relevant for both reading and executive functioning.
4.3. Functional neuroimaging findings
Functional neuroimaging was performed during executive functioning, phonological processing, and reading fluency tasks. The executive functioning (go/no‐go) fMRI task revealed comparable activation in the SMA and ACC for ADHD and COM, with both displaying decreased activation compared to TYP and RD. This aligns with previous meta‐analyses showing similar hypoactivations in ADHD children during executive functioning tasks, including response inhibition (Dickstein, Bannon, Castellanos, & Milham, 2006; Hart et al., 2013; Kasparek et al., 2013). Evidence from functional/structural meta‐analyses suggests that the SMA is integral to motor response inhibition, while the ACC, which displays hypoactivations in ADHD during go/no‐go tasks, is crucial for conflict inhibition (Hart et al., 2013; Kasparek et al., 2013; Nakao, Radua, Rubia, & Mataix‐Cols, 2011). Interestingly, reduced brain activation in the SMA/ACC was observed in all clinical groups during the reading fluency tasks. In the context of reading the sentences during the reading fluency task, the ACC might be involved in error monitoring during the reading process, which may be less effective in children with reading disabilities (Hancock et al., 2017). In a meta‐analysis (Houde et al., 2010), the SMA and ACC were activated during both reading and executive functioning tasks, suggesting strong recruitment of attention and executive functioning networks during reading, as supported by behavioral results (Cutting, Materek, Cole, Levine, & Mahone, 2009; Locascio, Mahone, Eason, & Cutting, 2010; Sesma, Mahone, Levine, Eason, & Cutting, 2009). Thus, the functional neuroimaging results substantiate the anatomical interpretation that the SMA/ACC brain region might reflect a shared risk factor and account for the high prevalence of comorbid RD–ADHD.
The results of the phonological processing and reading fluency tasks further revealed that compared to all other groups, the RD group consistently displayed decreased activation patterns in the posterior reading network. Specifically, between‐group differences were discovered in fusiform gyrus and occipitotemporal regions, which aligns with previous meta‐analyses showing hypoactivation in these regions for RD during phonological processing and reading (Linkersdorfer et al., 2012; Martin et al., 2015; Richlan et al., 2009; Temple, 2002). Although the left occipitotemporal region is crucial for grapheme‐phoneme integration (Peterson & Pennington, 2012), the left fusiform gyrus or ventral occipitotemporal circuit—often termed the “visual word form area”—is involved in word processing in typical children/adults (Dehaene & Cohen, 2011; Price & Devlin, 2011; Pugh et al., 2001; Schlaggar & McCandliss, 2007) and appears to be integral in developing visual tuning for print (Maurer et al., 2007). Interestingly, the COM group showed activation patterns comparable to those of TYP and significantly enhanced compared to RD in isolation in these two regions, which is further discussed in the next section.
4.4. The comorbid brain
To date, only three studies have compared children with comorbid RD and ADHD with TYP using structural MRI. Kibby, Kroese, et al. (2009) examined the length of the pars triangularis while Kibby, Pavawalla, et al. (2009) manually investigated the total cerebral volume. However, neither of these two studies observed any anatomical differences between children with RD, ADHD, or its comorbid manifestation. However, Goradia et al. (2016) observed striatal dysmorphologies between ADHD and COM compared to TYP children, but did not include a RD group. Several studies have examined the brain functions of comorbid RD and ADHD children. During a word‐rhyming task, a functional neuroimaging study found hypoactivation in left hemispheric, reading‐related brain areas in children with COM, but not ADHD, compared with controls (Mohl et al., 2015). In the same study, attention areas showed alterations in the COM and ADHD groups relative to controls. These findings are replicated by our fMRI results during the phonological processing task. Furthermore, a few magnetoencephalographic and electrophysiological studies revealed inconclusive results, either supporting a distinct neural profile for COM (Clarke et al., 2002; Huttunen‐Scott et al., 2008) or suggesting that COM deficits are additive (Barry et al., 2009; Serrallach et al., 2016; Van De Voorde, Roeyers, Verte, & Wiersema, 2010). The goal of the present study was to combine comprehensive behavioral testing with functional and anatomical neuroimaging to investigate whether brain characteristics of COM are similar to those of children with an isolated diagnosis or if the behavioral deficits seem to stem from unique functional and structural brain patterns.
In the comorbid group, the present neuroanatomical analysis identified decreased cortical thickness in brain regions that are crucial for executive functioning (SMA/ACC) and reading (planum temporale and inferior frontal gyrus). These results support the common etiology model for comorbid RD and ADHD and speak rather against the phenocopy model or direct causation model because COM displays ADHD symptoms not just as a result of the development of RD (and vice versa), but instead exhibits underlying structural deficits in both cognitive domains. Thus, the present results do not support the phenocopy theory, which would hypothesize neuroanatomical atypicalities in brain regions involved in either executive functioning or reading, but not in both. In the current analysis, post hoc descriptive analyses further revealed that most of the COM children displayed concurrent lower cortical thickness in both brain networks. These analyses exclude the possibility that some COM children exhibit isolated anatomical brain atypicalities in reading‐related brain areas whereas other COM children exhibit atypicalities in executive functioning‐related brain areas, which could result in an averaging bias supporting the phenocopy model. In addition, the MRI analyses revealed structural and functional atypicalities in SMA/ACC in all clinical groups across several task paradigms. Our results suggest that atypicalities of the ACC may be an indicator of a shared neuronal risk that could increase a child's risk of developing RD or ADHD or, in some circumstances, facilitate the development of comorbidity between RD and ADHD.
Furthermore, the anatomical and reading‐related functional neuroimaging paradigms exhibited atypicalities in the anterior reading network (left inferior frontal gyrus) both in RD and COM, which suggests a shared neuronal risk factor for RD and COM, distinct from ADHD. Interestingly, for the reading‐related tasks only, COM displayed no hyper‐ or hypoactivation in the posterior reading network (left superior temporal gyrus and fusiform gyrus) when compared to the TYP group, whereas the previously reported hypoactivations were observed in RD. This can be explained in at least two ways: (a) the reading deficit observed in COM children is primarily a result of atypicalities in the anterior reading network as well as the SMA/ACC, which would support the three independent disorders model, or (b) the COM children studied here show a slightly better reading performance than RD. Children with COM may have developed compensatory mechanisms that are unique to COM. However, future longitudinal studies are needed to characterize the development of possible compensatory mechanisms, as previously described for RD (Peterson & Pennington, 2012; Pugh et al., 2001; Richlan et al., 2011; Yu, Zuk, & Gaab, 2018).
4.5. Limitations
The small number of participants in each group is a major limitation of this study. In the future, larger studies are required to confirm these results before the findings can be generalized beyond the context of this study. However, the results are in line with previous (larger) studies which compared single disorders (dyslexia or ADHD) with typical children (Langer et al., 2013; Raschle, Zuk, & Gaab, 2012; Suskauer, Simmonds, Fotedar, et al., 2008).
Another limitation pertains to the corresponding threshold of the whole‐brain functional MRI results reported. Although independent ROI‐analyses with correction for multiple comparisons substantiated the main findings of the whole‐brain analyses, effects (decreased activation in the SMA during reading‐related tasks) reported were established based on uncorrected thresholds and should therefore be interpreted with great caution. We decided to report these results because (as discussed above) the reported activations closely align with a substantial body of evidence that has shown brain alterations in these regions among children with RD or ADHD in isolation (Hancock et al., 2017; Houde et al., 2010). Moreover, previous studies, which utilized the same thresholds, have reported activations in these regions for the identical task (Langer et al., 2013; Raschle, Zuk, & Gaab, 2012; Suskauer, Simmonds, Caffo, et al., 2008). Furthermore, it is important to note that pediatric populations often show lower signal‐to‐noise ratios and greater interindividual variance (Thomason, Burrows, Gabrieli, & Glover, 2005). Children with RD, ADHD, and comorbid RD and ADHD are hard to recruit and pediatric imaging in children with learning disabilities and especially ADHD is very challenging. We, therefore, think that despite the uncorrected thresholds for some of the functional analyses, these results are of great importance to the fields of developmental cognitive neuroscience and learning disabilities.
5. CONCLUSION
For the first time, the present study combines structural and functional MRI with comprehensive behavioral testing to address the neurological bases for the co‐occurrence of RD and ADHD. The results demonstrated that, behaviorally, all clinical groups displayed (similar) reduced performance in reading‐related and executive functioning measures compared to TYP. The neuroimaging results are comparable to genetic findings showing that some risk genes are shared between RD and ADHD and others are distinctive, supporting the multiple deficit model of developmental disorders. Both structural and functional neuroimaging revealed a combination of shared brain alterations between the clinical groups, supporting the common etiology model for comorbidity of RD and ADHD. However, unique patterns for COM were also observed, especially for the anatomical properties of the middle temporal gyrus and in the posterior reading network during reading‐related tasks, but further studies are needed to substantiate this finding before one could interpret the result as support for the three independent disorders model. If future studies suggest that COM shows unique anatomical and behavioral neural characteristics (e.g., replication of distinct features in the middle temporal gyrus and posterior reading network in COM), the current clinical treatment of COM should be reconsidered. Current intervention strategies for COM combine approaches developed for each disorder individually (Sexton et al., 2012). ADHD is frequently treated with pharmaceuticals, such as methylphenidate, which targets the dopaminergic neurotransmitter systems underlying frontal lobe and striatal functions. Although no pharmacokinetic systems have been identified for RD (and may never be), these children usually receive interventions that target specific reading components or promote multidimensional reading strategies (Peterson & Pennington, 2012). The three independent disorders model would imply that treating children with interventions developed for the single disorders may be suboptimal, which could explain why COM children do not benefit from single‐disorder therapies as much as their peers who suffer from RD or ADHD alone (Bental & Tirosh, 2008; Pritchard, Nigro, Jacobson, & Mahone, 2012; Rabiner, Malone, & Conduct Problems Prevention Research Group, 2004; Sexton et al., 2012). For a comprehensive review about clinical interventions for COM, see Gray and Climie (2016).
Supporting information
Figure S1 Example stimuli for all fMRI tasks.
Figure S2 The results for the fMRI ROI validation analysis for each fMRI task are illustrated. The mean and standard deviations of the normalized beta values for all groups are displayed. The ANOVA for the phonological processing task revealed significant effects for the left fusiform gyrus and the left occipitotemporal area. Typically developing children (blue) and COM children (purple) exhibit increased brain activation compared to the RD (red) and ADHD (green) groups. For the go/no‐go task, the TYP revealed increased activation in SMA/ACC compared to COM and ADHD children. The ANOVA for the reading fluency task revealed a significant effect, which was mainly due to increased activation in the TYP, ADHD and COM groups compared to the RD group.
ACKNOWLEDGMENTS
We want to express our greatest gratitude to all the families for their participation in this longitudinal study and acknowledge the effort of Dana Sury Barot and Xi Yu for assistance with manuscript revision. This study has been funded partially by NICHD (RO1 HD067312 and RO1 HD065762).
Langer N, Benjamin C, Becker BLC, Gaab N. Comorbidity of reading disabilities and ADHD: Structural and functional brain characteristics. Hum Brain Mapp. 2019;40:2677–2698. 10.1002/hbm.24552
Funding information NICHD, Grant/Award Numbers: RO1 HD065762, RO1 HD067312
Footnotes
REFERENCES
- Acheson, D. J. , & Hagoort, P. (2013). Stimulating the brain's language network: Syntactic ambiguity resolution after TMS to the inferior frontal gyrus and middle temporal gyrus. Journal of Cognitive Neuroscience, 25(10), 1664–1677. 10.1162/jocn_a_00430 [DOI] [PubMed] [Google Scholar]
- Amico, F. , Stauber, J. , Koutsouleris, N. , & Frodl, T. (2011). Anterior cingulate cortex gray matter abnormalities in adults with attention deficit hyperactivity disorder: A voxel‐based morphometry study. Psychiatry Research, 191(1), 31–35. 10.1016/j.pscychresns.2010.08.011 [DOI] [PubMed] [Google Scholar]
- American Psychiatric Association . (2004). Diagnostic and statistical manual of mental disorders (DSM‐IV). Washington, DC: American Psychiatric Association. [Google Scholar]
- Barkley, R. A. , Fischer, M. , Smallish, L. , & Fletcher, K. (2002). The persistence of attention‐deficit/hyperactivity disorder into young adulthood as a function of reporting source and definition of disorder. Journal of Abnormal Psychology, 111, 279–289. 10.1037/0021-843X.111.2.279 [DOI] [PubMed] [Google Scholar]
- Barry, R. J. , Clarke, A. R. , McCarthy, R. , & Selikowitz, M. (2009). EEG coherence in children with attention‐deficit/hyperactivity disorder and comorbid reading disabilities. International Journal of Psychophysiology, 71(3), 205–210. 10.1016/j.ijpsycho.2008.09.003 [DOI] [PubMed] [Google Scholar]
- Benjamin, C. F. , & Gaab, N. (2011). What's the story? The tale of reading fluency told at speed. Human Brain Mapping, 33(11), 2572–2585. 10.1002/hbm.21384 [DOI] [PMC free article] [PubMed] [Google Scholar]
- Bental, B. , & Tirosh, E. (2007). The relationship between attention, executive functions and reading domain abilities in attention deficit hyperactivity disorder and reading disorder: A comparative study. Journal of Child Psychology and Psychiatry, 48(5), 455–463. doi: JCPP1710 [pii]. 10.1111/j.1469-7610.2006.01710.x [DOI] [PubMed] [Google Scholar]
- Bental, B. , & Tirosh, E. (2008). The effects of methylphenidate on word decoding accuracy in boys with attention‐deficit/hyperactivity disorder. Journal of Clinical Psychopharmacology, 28(1), 89–92. 10.1097/Jcp.0b013e3181603f0e [DOI] [PubMed] [Google Scholar]
- Birnbaum, H. G. , Kessler, R. C. , Lowe, S. W. , Secnik, K. , Greenberg, P. E. , Leong, S. A. , & Swensen, A. R. (2005). Costs of attention deficit–hyperactivity disorder (ADHD) in the US: Excess costs of persons with ADHD and their family members in 2000. Current Medical Research and Opinion, 21, 195–205. 10.1185/030079904X20303 [DOI] [PubMed] [Google Scholar]
- Blasi, G. , Goldberg, T. E. , Weickert, T. , Das, S. , Kohn, P. , Zoltick, B. , … Mattay, V. S. (2006). Brain regions underlying response inhibition and interference monitoring and suppression. The European Journal of Neuroscience, 23(6), 1658–1664. 10.1111/j.1460-9568.2006.04680.x [DOI] [PubMed] [Google Scholar]
- Bledsoe, J. C. , Semrud‐Clikeman, M. , & Pliszka, S. R. (2013). Anterior cingulate cortex and symptom severity in attention‐deficit/hyperactivity disorder. Journal of Abnormal Psychology, 122(2), 558–565. 10.1037/a0032390 [DOI] [PubMed] [Google Scholar]
- Bush, G. , Luu, P. , & Posner, M. I. (2000). Cognitive and emotional influences in anterior cingulate cortex. Trends in Cognitive Sciences, 4, 215–222. [DOI] [PubMed] [Google Scholar]
- Butterworth, B. , & Kovas, Y. (2013). Understanding neurocognitive developmental disorders can improve education for all. Scandinavian Journal of Statistics, 340, 300–306. [DOI] [PubMed] [Google Scholar]
- Christakou, A. , Murphy, C. M. , Chantiluke, K. , Cubillo, A. I. , Smith, A. B. , Giampietro, V. , … Rubia, K. (2013). Disorder‐specific functional abnormalities during sustained attention in youth with attention deficit hyperactivity disorder (ADHD) and with autism. Molecular Psychiatry, 18(2), 236–244. 10.1038/mp.2011.185 [DOI] [PMC free article] [PubMed] [Google Scholar]
- Clarke, A. R. , Barry, R. J. , McCarthy, R. , & Selikowitz, M. (2002). EEG analysis of children with attention‐deficit/hyperactivity disorder and comorbid Reading disabilities. Journal of Learning Disabilities, 35(3), 276–285. [DOI] [PubMed] [Google Scholar]
- Congdon, E. , Altshuler, L. L. , Mumford, J. A. , Karlsgodt, K. H. , Sabb, F. W. , Ventura, J. , … Poldrack, R. A. (2014). Neural activation during response inhibition in adult attention‐deficit/hyperactivity disorder: Preliminary findings on the effects of medication and symptom severity. Psychiatry Research, 222(1–2), 17–28. 10.1016/j.pscychresns.2014.02.002 [DOI] [PMC free article] [PubMed] [Google Scholar]
- Cortese, S. (2012). The neurobiology and genetics of attention‐deficit/hyperactivity disorder (ADHD): What every clinician should know. European Journal of Paediatric Neurology, 16(5), 422–433. 10.1016/j.ejpn.2012.01.009 [DOI] [PubMed] [Google Scholar]
- Cubillo, A. , Halari, R. , Smith, A. , Taylor, E. , & Rubia, K. (2012). A review of fronto‐striatal and fronto‐cortical brain abnormalities in children and adults with attention deficit hyperactivity disorder (ADHD) and new evidence for dysfunction in adults with ADHD during motivation and attention. Cortex, 48(2), 194–215. 10.1016/j.cortex.2011.04.007 [DOI] [PubMed] [Google Scholar]
- Cutting, L. E. , Materek, A. , Cole, C. A. , Levine, T. M. , & Mahone, E. M. (2009). Effects of fluency, oral language, and executive function on reading comprehension performance. Annals of Dyslexia, 59(1), 34–54. 10.1007/s11881-009-0022-0 [DOI] [PMC free article] [PubMed] [Google Scholar]
- Dale, A. M. , Fischl, B. , & Sereno, M. I. (1999). Cortical surface‐based analysis. I. Segmentation and surface reconstruction. NeuroImage, 9(2), 179–194. 10.1006/nimg.1998.0395 [DOI] [PubMed] [Google Scholar]
- de Groot, B. J. A. , van den Bos, K. P. , van der Meulen, B. F. , & Minnaert, A. E. M. G. (2015). The attentional blink in typically developing and reading‐disabled children. Journal of Experimental Child Psychology, 139, 51–70. 10.1016/j.jecp.2015.05.003 [DOI] [PubMed] [Google Scholar]
- De Jong, C. G. W. , Licht, R. , Sergeant, J. A. , & Oosterlaan, J. (2013). RD, ADHD, and their comorbidity from a dual route perspective. Child Neuropsychology, 18, 467–486. [DOI] [PubMed] [Google Scholar]
- De Weerdt, F. , Desoete, A. , & Roeyers, H. (2013). Behavioral inhibition in children with learning disabilities. Research in Developmental Disabilities, 34, 1998–2007. 10.1016/j.ridd.2013.02.020 [DOI] [PubMed] [Google Scholar]
- Deco, G. , Senden, M. , & Jirsa, V. (2012). How anatomy shapes dynamics: A semi‐analytical study of the brain at rest by a simple spin model. Frontiers in Computational Neuroscience, 6, 68 10.3389/fncom.2012.00068 [DOI] [PMC free article] [PubMed] [Google Scholar]
- Dehaene, S. , & Cohen, L. (2011). The unique role of the visual word form area in reading. Trends in Cognitive Sciences, 15(6), 254–262. 10.1016/j.tics.2011.04.003 [DOI] [PubMed] [Google Scholar]
- Dickstein, S. G. , Bannon, K. , Castellanos, F. X. , & Milham, M. P. (2006). The neural correlates of attention deficit hyperactivity disorder: An ALE meta‐analysis. Journal of Child Psychology and Psychiatry, 47(10), 1051–1062. 10.1111/j.1469-7610.2006.01671.x [DOI] [PubMed] [Google Scholar]
- Donders, F. C. (1969). On the speed of mental processes. Acta Psychologica, 30, 412–431. [DOI] [PubMed] [Google Scholar]
- Duff, C. T. , & Sulla, E. M. (2015). Measuring executive function in the differential diagnosis of attention‐deficit/hyperactivity disorder: Does it really tell us anything? Applied Neuropsychology: Child, 4, 188–196. 10.1080/21622965.2013.848329 [DOI] [PubMed] [Google Scholar]
- Durston, S. (2003). A review of the biological bases of ADHD: What have we learned from imaging studies? Mental Retardation and Developmental Disabilities Research Reviews, 9(3), 184–195. 10.1002/mrdd.10079 [DOI] [PubMed] [Google Scholar]
- Durston, S. , Tottenham, N. T. , Thomas, K. M. , Davidson, M. C. , Eigsti, I. M. , Yang, Y. , … Casey, B. J. (2003). Differential patterns of striatal activation in young children with and without ADHD. Biological Psychiatry, 53(10), 871–878. [DOI] [PubMed] [Google Scholar]
- Emond, V. , Joyal, C. , & Poissant, H. (2009). Structural and functional neuroanatomy of attention‐deficit hyperactivity disorder (ADHD). Encephale, 35(2), 107–114. 10.1016/j.encep.2008.01.005 [DOI] [PubMed] [Google Scholar]
- Faraone, S. V. , Asherson, P. , Banaschewski, T. , Biederman, J. , Buitelaar, J. K. , Ramos‐Quiroga, J. A. , … Franke, B. (2015). Attention‐deficit/hyperactivity disorder. Nature Reviews Disease Primers, 1, 15020 10.1038/nrdp.2015.20 [DOI] [PubMed] [Google Scholar]
- Fischl, B. , & Dale, A. M. (2000). Measuring the thickness of the human cerebral cortex from magnetic resonance images. Proceedings of the National Academy of Sciences of the United States of America, 97(20), 11050–11055. 10.1073/pnas.200033797 [DOI] [PMC free article] [PubMed] [Google Scholar]
- Fischl, B. , Salat, D. H. , Busa, E. , Albert, M. , Dieterich, M. , Haselgrove, C. , … Dale, A. M. (2002). Whole brain segmentation: Automated labeling of neuroanatomical structures in the human brain. Neuron, 33(3), 341–355. [DOI] [PubMed] [Google Scholar]
- Fischl, B. , Salat, D. H. , van der Kouwe, A. J. , Makris, N. , Segonne, F. , Quinn, B. T. , & Dale, A. M. (2004). Sequence‐independent segmentation of magnetic resonance images. NeuroImage, 23(Suppl 1), S69–S84. 10.1016/j.neuroimage.2004.07.016 [DOI] [PubMed] [Google Scholar]
- Fischl, B. , Sereno, M. I. , & Dale, A. M. (1999). Cortical surface‐based analysis. II: Inflation, flattening, and a surface‐based coordinate system. NeuroImage, 9(2), 195–207. 10.1006/nimg.1998.0396 [DOI] [PubMed] [Google Scholar]
- Fischl, B. , Sereno, M. I. , Tootell, R. B. , & Dale, A. M. (1999). High‐resolution intersubject averaging and a coordinate system for the cortical surface. Human Brain Mapping, 8(4), 272–284. 10.1002/(SICI)1097-0193(1999)8:4<272::AID-HBM10>3.0.CO;2-4 [DOI] [PMC free article] [PubMed] [Google Scholar]
- Fischl, B. , van der Kouwe, A. , Destrieux, C. , Halgren, E. , Segonne, F. , Salat, D. H. , … Dale, A. M. (2004). Automatically parcellating the human cerebral cortex. Cerebral Cortex, 14(1), 11–22. [DOI] [PubMed] [Google Scholar]
- Galaburda, A. M. , LoTurco, J. , Ramus, F. , Fitch, R. H. , & Rosen, G. D. (2006). From genes to behavior in developmental dyslexia. Nature Neuroscience, 9(10), 1213–1217. 10.1038/nn1772 [DOI] [PubMed] [Google Scholar]
- Garavan, H. , Ross, T. J. , Murphy, K. , Roche, R. A. , & Stein, E. A. (2002). Dissociable executive functions in the dynamic control of behavior: Inhibition, error detection, and correction. NeuroImage, 17(4), 1820–1829. [DOI] [PubMed] [Google Scholar]
- Gayan, J. , Willcutt, E. G. , Fisher, S. E. , Francks, C. , Cardon, L. R. , Olson, R. K. , … DeFries, J. C. (2005). Bivariate linkage scan for reading disability and attention‐deficit/hyperactivity disorder localizes pleiotropic loci. Journal of Child Psychology and Psychiatry, 46(10), 1045–1056. 10.1111/j.1469-7610.2005.01447.x [DOI] [PubMed] [Google Scholar]
- Genovese, C. R. , Lazar, N. A. , & Nichols, T. (2002). Thresholding of statistical maps in functional neuroimaging using the false discovery rate. NeuroImage, 15(4), 870–878. 10.1006/nimg.2001.1037 [DOI] [PubMed] [Google Scholar]
- Germano, E. , Gagliano, A. , & Curatolo, P. (2010). Comorbidity of ADHD and dyslexia. Developmental Neuropsychology, 35(5), 475–493. 10.1080/87565641.2010.494748 [DOI] [PubMed] [Google Scholar]
- Gialluisi, A. , Newbury, D. F. , Wilcutt, E. G. , Olson, R. K. , DeFries, J. C. , Brandler, W. M. , … Consortium, S. (2014). Genome‐wide screening for DNA variants associated with reading and language traits. Genes, Brain and Behavior, 13(7), 686–701. 10.1111/gbb.12158 [DOI] [PMC free article] [PubMed] [Google Scholar]
- Goradia, D. D. , Vogel, S. , Mohl, B. , Khatib, D. , Zajac‐Benitez, C. , Rajan, U. , … Stanley, J. A. (2016). Distinct differences in striatal dysmorphology between attention deficit hyperactivity disorder boys with and without a comorbid reading disability. Psychiatry Research: Neuroimaging, 258, 30–36. 10.1016/j.pscychresns.2016.10.012 [DOI] [PMC free article] [PubMed] [Google Scholar]
- Gray, C. , & Climie, E. A. (2016). Children with attention deficit/hyperactivity disorder and reading disability: A review of the efficacy of medication treatments. Frontiers in Psychology, 7, 1–6. 10.3389/fpsyg.2016.00988 [DOI] [PMC free article] [PubMed] [Google Scholar]
- Hancock, R. , Richlan, F. , & Hoeft, F. (2017). Possible roles for fronto‐striatal circuits in reading disorder. Neuroscience and Biobehavioral Reviews, 72, 243–260. 10.1016/j.neubiorev.2016.10.025 [DOI] [PMC free article] [PubMed] [Google Scholar]
- Hart, H. , Radua, J. , Nakao, T. , Mataix‐Cols, D. , & Rubia, K. (2013). Meta‐analysis of functional magnetic resonance imaging studies of inhibition and attention in attention‐deficit/hyperactivity disorder: Exploring task‐specific, stimulant medication, and age effects. JAMA Psychiatry, 70(2), 185–198. 10.1001/jamapsychiatry.2013.277 [DOI] [PubMed] [Google Scholar]
- Hinshaw, S. P. (1992). Academic underachievement, attention deficits, and aggression: Comorbidity and implications for intervention. Journal of Consulting and Clinical Psychology, 60(6), 893–903. [DOI] [PubMed] [Google Scholar]
- Hoeft, F. , Meyler, A. , Hernandez, A. , Juel, C. , Taylor‐Hill, H. , Martindale, J. L. , … Gabrieli, J. D. (2007). Functional and morphometric brain dissociation between dyslexia and reading ability. Proceedings of the National Academy of Sciences of the United States of America, 104(10), 4234–4239. 10.1073/pnas.0609399104 [DOI] [PMC free article] [PubMed] [Google Scholar]
- Holm, S. (1979). A simple sequentially rejective multiple test procedure. Scandinavian Journal of Statistics, 6, 65–70. [Google Scholar]
- Houde, O. , Rossi, S. , Lubin, A. , & Joliot, M. (2010). Mapping numerical processing, reading, and executive functions in the developing brain: An fMRI meta‐analysis of 52 studies including 842 children. Developmental Science, 13(6), 876–885. 10.1111/j.1467-7687.2009.00938.x [DOI] [PubMed] [Google Scholar]
- Huttunen‐Scott, T. , Kaartinen, J. , Tolvanen, A. , & Lyytinen, H. (2008). Mismatch negativity (MMN) elicited by duration deviations in children with reading disorder, attention deficit or both. International Journal of Psychophysiology, 69(1), 69–77. 10.1016/J.Ijpsycho.2008.03.002 [DOI] [PubMed] [Google Scholar]
- Kasparek, T. , Theiner, P. , & Filova, A. (2013). Neurobiology of ADHD from childhood to adulthood: Findings of imaging methods. Journal of Attention Disorders, 19, 931–943. 10.1177/1087054713505322 [DOI] [PubMed] [Google Scholar]
- Katz, L. J. , Brown, F. C. , Roth, R. M. , & Beers, S. R. (2011). Processing speed and working memory performance in those with both ADHD and a reading disorder compared with those with ADHD alone. Archives of Clinical Neuropsychology, 26(5), 425–433. 10.1093/arclin/acr026 [DOI] [PubMed] [Google Scholar]
- Kibby, M. Y. , Kroese, J. M. , Krebbs, H. , Hill, C. E. , & Hynd, G. W. (2009). The pars triangularis in dyslexia and ADHD: A comprehensive approach. Brain and Language , 111(1), 46–54. doi: 10.1016/j.bandl.2009.03.001 [DOI] [PMC free article] [PubMed] [Google Scholar]
- Kibby, M. Y. , Pavawalla, S. P. , Fancher, J. B. , Naillon, A. J. , & Hynd, G. W. (2009). The relationship between cerebral hemisphere volume and receptive language functioning in dyslexia and attention‐deficit hyperactivity disorder (ADHD). Journal of Child Neurology, 24(4), 438–448. 10.1177/0883073808324772 [DOI] [PMC free article] [PubMed] [Google Scholar]
- Kibby, M. Y. , & Cohen, M. J. (2008). Memory functioning in children with reading disabilities and/or attention deficit/hyperactivity disorder: A clinical investigation of their working memory and long‐term memory functioning. Child Neuropsychology, 14, 525–546. 10.1080/09297040701821752 [DOI] [PMC free article] [PubMed] [Google Scholar]
- Kronbichler, M. , Hutzler, F. , Staffen, W. , Mair, A. , Ladurner, G. , & Wimmer, H. (2006). Evidence for a dysfunction of left posterior reading areas in German dyslexic readers. Neuropsychologia, 44(10), 1822–1832. 10.1016/j.neuropsychologia.2006.03.010 [DOI] [PubMed] [Google Scholar]
- Kronbichler, M. , Hutzler, F. , Wimmer, H. , Mair, A. , Staffen, W. , & Ladurner, G. (2004). The visual word form area and the frequency with which words are encountered: Evidence from a parametric fMRI study. NeuroImage, 21(3), 946–953. 10.1016/j.neuroimage.2003.10.021 [DOI] [PubMed] [Google Scholar]
- Kuperberg, G. R. , Broome, M. R. , McGuire, P. K. , David, A. S. , Eddy, M. , Ozawa, F. , … Fischl, B. (2003). Regionally localized thinning of the cerebral cortex in schizophrenia. Archives of General Psychiatry, 60(9), 878–888. 10.1001/archpsyc.60.9.878 [DOI] [PubMed] [Google Scholar]
- Langberg, J. M. , Vaughn, A. J. , Brinkman, W. B. , Froehlich, T. , & Epstein, J. N. (2010). Clinical utility of the Vanderbilt ADHD rating scale for ruling out comorbid learning disorders. Pediatrics, 126(5), e1033–e1038. 10.1542/peds.2010-1267 [DOI] [PMC free article] [PubMed] [Google Scholar]
- Langer, N. , Benjamin, C. , Minas, J. , & Gaab, N. (2013). The neural correlates of Reading fluency deficits in children. Cerebral Cortex, 25, 1441–1453. 10.1093/cercor/bht330 [DOI] [PMC free article] [PubMed] [Google Scholar]
- Levy, F. , Hay, D. A. , Bennett, K. S. , & McStephen, M. (2005). Gender differences in ADHD subtype comorbidity. Journal of the American Academy of Child and Adolescent Psychiatry, 44, 368–376. 10.1097/01.chi.0000153232.64968.c1 [DOI] [PubMed] [Google Scholar]
- Liddle, P. F. , Kiehl, K. A. , & Smith, A. M. (2001). Event‐related fMRI study of response inhibition. Human Brain Mapping, 12(2), 100–109. 10.1002/1097-0193(200102)12:2<100::AID-HBM1007>3.0.CO;2-6 [DOI] [PMC free article] [PubMed] [Google Scholar]
- Light, J. G. , Pennington, B. F. , Gilger, J. W. , & DeFries, J. C. (1995). Reading disability and hyperactivity disorder: Evidence for a common genetic etiology. Developmental Neuropsychology, 11, 323–335. 10.1080/87565649509540623 [DOI] [Google Scholar]
- Lim, L. , Marquand, A. , Cubillo, A. A. , Smith, A. B. , Chantiluke, K. , Simmons, A. , … Rubia, K. (2013). Disorder‐specific predictive classification of adolescents with attention deficit hyperactivity disorder (ADHD) relative to autism using structural magnetic resonance imaging. PLoS One, 8(5), e63660 10.1371/journal.pone.0063660 [DOI] [PMC free article] [PubMed] [Google Scholar]
- Linkersdorfer, J. , Lonnemann, J. , Lindberg, S. , Hasselhorn, M. , & Fiebach, C. J. (2012). Grey matter alterations co‐localize with functional abnormalities in developmental dyslexia: An ALE meta‐analysis. PLoS One, 7(8), e43122 10.1371/journal.pone.0043122 [DOI] [PMC free article] [PubMed] [Google Scholar]
- Locascio, G. , Mahone, E. M. , Eason, S. H. , & Cutting, L. E. (2010). Executive dysfunction among children with reading comprehension deficits. Journal of Learning Disabilities, 43(5), 441–454. 10.1177/0022219409355476 [DOI] [PMC free article] [PubMed] [Google Scholar]
- Martin, A. , Schurz, M. , Kronbichler, M. , & Richlan, F. (2015). Reading in the brain of children and adults: A meta‐analysis of 40 functional magnetic resonance imaging studies. Human Brain Mapping, 36(5), 1963–1981. 10.1002/hbm.22749 [DOI] [PMC free article] [PubMed] [Google Scholar]
- Martinussen, R. , & Tannock, R. (2006). Working memory impairments in children with attention‐deficit hyperactivity disorder with and without comorbid language learning disorders. Journal of Clinical and Experimental Neuropsychology, 28(7), 1073–1094. 10.1080/13803390500205700 [DOI] [PubMed] [Google Scholar]
- Mascheretti, S. , Trezzi, V. , Giorda, R. , Boivin, M. , Plourde, V. , Vitaro, F. , … Marino, C. (2017). Complex effects of dyslexia risk factors account for ADHD traits: Evidence from two independent samples. Journal of Child Psychology and Psychiatry and Allied Disciplines, 58, 75–82. 10.1111/jcpp.12612 [DOI] [PubMed] [Google Scholar]
- Mather, N. , Hammill, D. D. , Allen, E. A. , & Roberts, R. (2004). Test of Silent Word Reading Fluency. Austin, TX: PRO‐ED. [Google Scholar]
- Maurer, U. , Brem, S. , Bucher, K. , Kranz, F. , Benz, R. , Steinhausen, H. C. , & Brandeis, D. (2007). Impaired tuning of a fast occipito‐temporal response for print in dyslexic children learning to read. Brain, 130(Pt 12), 3200–3210. 10.1093/brain/awm193 [DOI] [PubMed] [Google Scholar]
- McGrath, L. M. , Pennington, B. F. , Shanahan, M. A. , Santerre‐Lemmon, L. E. , Barnard, H. D. , Willcutt, E. G. , … Olson, R. K. (2011). A multiple deficit model of reading disability and attention‐deficit/hyperactivity disorder: Searching for shared cognitive deficits. Journal of Child Psychology and Psychiatry, 52(5), 547–557. 10.1111/j.1469-7610.2010.02346.x [DOI] [PMC free article] [PubMed] [Google Scholar]
- Messe, A. , Rudrauf, D. , Benali, H. , & Marrelec, G. (2014). Relating structure and function in the human brain: Relative contributions of anatomy, stationary dynamics, and non‐stationarities. PLoS Computational Biology, 10(3), e1003530 10.1371/journal.pcbi.1003530 [DOI] [PMC free article] [PubMed] [Google Scholar]
- Miller, A. C. , Keenan, J. M. , Betjemann, R. S. , Willcutt, E. G. , Pennington, B. F. , & Olson, R. K. (2013). Reading comprehension in children with ADHD: Cognitive underpinnings of the centrality deficit. Journal of Abnormal Child Psychology, 41, 473–483. 10.1007/s10802-012-9686-8 [DOI] [PMC free article] [PubMed] [Google Scholar]
- Miranda, A. , Mercader, J. , Fernández, M. I. , & Colomer, C. (2017). Reading performance of young adults with ADHD diagnosed in childhood: Relations with executive functioning. Journal of Attention Disorders, 21, 294–304. 10.1177/1087054713507977 [DOI] [PubMed] [Google Scholar]
- Mohl, B. , Ofen, N. , Jones, L. L. , Robin, A. L. , Rosenberg, D. R. , Diwadkar, V. A. , … Stanley, J. A. (2015). Neural dysfunction in ADHD with Reading disability during a word rhyming continuous performance task. Brain and Cognition, 99, 1–7. 10.1016/j.bandc.2015.04.009 [DOI] [PubMed] [Google Scholar]
- Mostofsky, S. H. , Schafer, J. G. , Abrams, M. T. , Goldberg, M. C. , Flower, A. A. , Boyce, A. , … Pekar, J. J. (2003). fMRI evidence that the neural basis of response inhibition is task‐dependent. Brain Research. Cognitive Brain Research, 17(2), 419–430. [DOI] [PubMed] [Google Scholar]
- Moura, O. , Pereira, M. , Alfaiate, C. , Fernandes, E. , Fernandes, B. , Nogueira, S. , … Simões, M. R. (2017). Neurocognitive functioning in children with developmental dyslexia and attention‐deficit/hyperactivity disorder: Multiple deficits and diagnostic accuracy. Journal of Clinical and Experimental Neuropsychology, 39, 296–312. 10.1080/13803395.2016.1225007 [DOI] [PubMed] [Google Scholar]
- Nakao, T. , Radua, J. , Rubia, K. , & Mataix‐Cols, D. (2011). Gray matter volume abnormalities in ADHD: Voxel‐based meta‐analysis exploring the effects of age and stimulant medication. The American Journal of Psychiatry, 168(11), 1154–1163. 10.1176/appi.ajp.2011.11020281 [DOI] [PubMed] [Google Scholar]
- Neale, B. M. , Sham, P. C. , Purcell, S. , Banaschewski, T. , Buitelaar, J. , Franke, B. , … Faraone, S. V. (2008). Population differences in the International Multi‐Centre ADHD Gene Project. Genetic Epidemiology, 32(2), 98–107. 10.1002/gepi.20265 [DOI] [PubMed] [Google Scholar]
- Ozernov‐Palchik, O. , Yu, X. , Wang, Y. , & Gaab, N. (2016). Lessons to be learned: How a comprehensive neurobiological framework of atypical reading development can inform educational practice. Current Opinion in Behavioral Sciences, 10, 45–58. 10.1016/j.cobeha.2016.05.006 [DOI] [PMC free article] [PubMed] [Google Scholar]
- Pennington, B. F. (2006). From single to multiple deficit models of developmental disorders. Cognition, 101(2), 385–413. 10.1016/j.cognition.2006.04.008 [DOI] [PubMed] [Google Scholar]
- Pennington, B. F. , Groisser, D. , & Welsh, M. C. (1993). Contrasting cognitive deficits in attention deficit hyperactivity disorder versus reading disability. Developmental Psychology, 29, 511–523. [Google Scholar]
- Peterson, R. L. , & Pennington, B. F. (2012). Developmental dyslexia. Lancet, 379(9830), 1997–2007. 10.1016/S0140-6736(12)60198-6 [DOI] [PMC free article] [PubMed] [Google Scholar]
- Peterson, R. L. , & Pennington, B. F. (2015). Developmental dyslexia. Annual Review of Clinical Psychology, 11, 283–307. 10.1146/annurev-clinpsy-032814-112842 [DOI] [PubMed] [Google Scholar]
- Polanczyk, G. , de Lima, M. S. , Horta, B. L. , Biederman, J. , & Rohde, L. A. (2007). The worldwide prevalence of ADHD: A systematic review and metaregression analysis. American Journal of Psychiatry, 164(6), 942–948. 10.1176/appi.ajp.164.6.942 [DOI] [PubMed] [Google Scholar]
- Powers, S. J. , Wang, Y. , Beach, S. D. , Sideridis, G. D. , & Gaab, N. (2016). Examining the relationship between home literacy environment and neural correlates of phonological processing in beginning readers with and without a familial risk for dyslexia: An fMRI study. Annals of Dyslexia, 66(3), 337–360. 10.1007/s11881-016-0134-2 [DOI] [PMC free article] [PubMed] [Google Scholar]
- Price, C. J. , & Devlin, J. T. (2011). The interactive account of ventral occipitotemporal contributions to reading. Trends in Cognitive Sciences, 15(6), 246–253. 10.1016/j.tics.2011.04.001 [DOI] [PMC free article] [PubMed] [Google Scholar]
- Pritchard, A. E. , Nigro, C. A. , Jacobson, L. A. , & Mahone, E. M. (2012). The role of neuropsychological assessment in the functional outcomes of children with ADHD. Neuropsychology Review, 22(1), 54–68. 10.1007/s11065-011-9185-7 [DOI] [PubMed] [Google Scholar]
- Pugh, K. R. , Mencl, W. E. , Jenner, A. R. , Katz, L. , Frost, S. J. , Lee, J. R. , … Shaywitz, B. A. (2001). Neurobiological studies of reading and reading disability. Journal of Communication Disorders, 34(6), 479–492. [DOI] [PubMed] [Google Scholar]
- Purvis, K. L. , & Tannock, R. (2000). Phonological processing, not inhibitory control, differentiates ADHD and reading disability. Journal of the American Academy of Child and Adolescent Psychiatry, 39(4), 485–494. 10.1097/00004583-200004000-00018 [DOI] [PubMed] [Google Scholar]
- Quinn, M. M. , Rutherford, R. B. , & Leone, P. E. (2001). Students with disabilities in correctional facilities. ERIC Clearinghouse on Disabilities and Gifted Education, #E621, 1–6. [Google Scholar]
- Rabiner, D. L. , Malone, P. S. , & Conduct Problems Prevention Research Group . (2004). The impact of tutoring on early reading achievement for children with and without attention problems. Journal of Abnormal Child Psychology, 32(3), 273–284. 10.1023/B:Jacp.0000026141.20174.17 [DOI] [PMC free article] [PubMed] [Google Scholar]
- Raschle, N. M. , Chang, M. , & Gaab, N. (2011). Structural brain alterations associated with dyslexia predate reading onset. NeuroImage, 57(3), 742–749. 10.1016/j.neuroimage.2010.09.055 [DOI] [PMC free article] [PubMed] [Google Scholar]
- Raschle, N. M. , Lee, M. , Buechler, R. , Christodoulou, J. A. , Chang, M. , Vakil, M. , … Gaab, N. (2009). Making MR imaging child's play—Pediatric neuroimaging protocol, guidelines and procedure. Journal of Visualized Experiments, 29, 1309 10.3791/1309 [DOI] [PMC free article] [PubMed] [Google Scholar]
- Raschle, N. M. , Stering, P. L. , Meissner, S. N. , & Gaab, N. (2014). Altered neuronal response during rapid auditory processing and its relation to phonological processing in prereading children at familial risk for dyslexia. Cerebral Cortex, 24(9), 2489–2501. 10.1093/cercor/bht104 [DOI] [PMC free article] [PubMed] [Google Scholar]
- Raschle, N. M. , Zuk, J. , & Gaab, N. (2012). Functional characteristics of developmental dyslexia in left‐hemispheric posterior brain regions predate reading onset. Proceedings of the National Academy of Sciences of the United States of America, 109(6), 2156–2161. 10.1073/pnas.1107721109 [DOI] [PMC free article] [PubMed] [Google Scholar]
- Raschle, N. M. , Zuk, J. , Ortiz‐Mantilla, S. , Sliva, D. D. , Franceschi, A. , Grant, P. E. , … Gaab, N. (2012). Pediatric neuroimaging in early childhood and infancy: Challenges and practical guidelines. Annals of the New York Academy of Sciences, 1252, 43–50. 10.1111/j.1749-6632.2012.06457.x [DOI] [PMC free article] [PubMed] [Google Scholar]
- Richlan, F. , Kronbichler, M. , & Wimmer, H. (2009). Functional abnormalities in the dyslexic brain: A quantitative meta‐analysis of neuroimaging studies. Human Brain Mapping, 30(10), 3299–3308. 10.1002/hbm.20752 [DOI] [PMC free article] [PubMed] [Google Scholar]
- Richlan, F. , Kronbichler, M. , & Wimmer, H. (2011). Meta‐analyzing brain dysfunctions in dyslexic children and adults. NeuroImage, 56(3), 1735–1742. 10.1016/j.neuroimage.2011.02.040 [DOI] [PubMed] [Google Scholar]
- Richlan, F. , Kronbichler, M. , & Wimmer, H. (2013). Structural abnormalities in the dyslexic brain: A meta‐analysis of voxel‐based morphometry studies. Human Brain Mapping, 34(11), 3055–3065. 10.1002/hbm.22127 [DOI] [PMC free article] [PubMed] [Google Scholar]
- Ring, J. , & Black, J. L. (2018). The multiple deficit model of dyslexia: What does it mean for identification and intervention? Annals of Dyslexia, 68(2), 104–125. 10.1007/s11881-018-0157-y [DOI] [PubMed] [Google Scholar]
- Rosas, H. D. , Liu, A. K. , Hersch, S. , Glessner, M. , Ferrante, R. J. , Salat, D. H. , … Fischl, B. (2002). Regional and progressive thinning of the cortical ribbon in Huntington's disease. Neurology, 58(5), 695–701. 10.1212/WNL.58.5.695 [DOI] [PubMed] [Google Scholar]
- Rucklidge, J. J. , & Tannock, R. (2002). Neuropsychological profiles of adolescents with ADHD: Effects of reading difficulties and gender. Journal of Child Psychology and Psychiatry, 43(8), 988–1003. [DOI] [PubMed] [Google Scholar]
- Ryan, M. , Jacobson, L. A. , Hague, C. , Bellows, A. , Denckla, M. B. , & Mahone, E. M. (2017). Rapid automatized naming (RAN) in children with ADHD: An ex‐Gaussian analysis. Child Neuropsychology, 23, 571–587. 10.1080/09297049.2016.1172560 [DOI] [PMC free article] [PubMed] [Google Scholar]
- Salat, D. H. , Buckner, R. L. , Snyder, A. Z. , Greve, D. N. , Desikan, R. S. R. , Busa, E. , … Fischl, B. (2004). Thinning of the cerebral cortex in aging. Cerebral Cortex, 14(7), 721–730. 10.1093/cercor/bhh032 [DOI] [PubMed] [Google Scholar]
- Saygin, Z. M. , Osher, D. E. , Norton, E. S. , Youssoufian, D. A. , Beach, S. D. , Feather, J. , … Kanwisher, N. (2016). Connectivity precedes function in the development of the visual word form area. Nature Neuroscience, 19(9), 1250–1255. 10.1038/nn.4354 [DOI] [PMC free article] [PubMed] [Google Scholar]
- Scarborough, H. S. (1998). Predicting the future achievement of second graders with reading disabilities: Contributions of phonemic awareness, verbal memory, rapid naming, and IQ. Annals of Dyslexia, 48, 115–136. 10.1007/S11881-998-0006-5 [DOI] [Google Scholar]
- Schlaggar, B. L. , & McCandliss, B. D. (2007). Development of neural systems for reading. Annual Review of Neuroscience, 30, 475–503. 10.1146/annurev.neuro.28.061604.135645 [DOI] [PubMed] [Google Scholar]
- Schneider, M. F. , Krick, C. M. , Retz, W. , Hengesch, G. , Retz‐Junginger, P. , Reith, W. , & Rosler, M. (2010). Impairment of fronto‐striatal and parietal cerebral networks correlates with attention deficit hyperactivity disorder (ADHD) psychopathology in adults—A functional magnetic resonance imaging (fMRI) study. Psychiatry Research, 183(1), 75–84. 10.1016/j.pscychresns.2010.04.005 [DOI] [PubMed] [Google Scholar]
- Schulz, E. , Maurer, U. , van der Mark, S. , Bucher, K. , Brem, S. , Martin, E. , & Brandeis, D. (2009). Reading for meaning in dyslexic and young children: Distinct neural pathways but common endpoints. Neuropsychologia, 47(12), 2544–2557. 10.1016/j.neuropsychologia.2009.04.028 [DOI] [PubMed] [Google Scholar]
- Semrud‐Clikeman, M. , Hooper, S. R. , Hynd, G. W. , Hern, K. , Presley, R. , & Watson, T. (1996). Prediction of group membership in developmental dyslexia, attention deficit hyperactivity disorder, and normal controls using brain morphometric analysis of magnetic resonance imaging. Archives of Clinical Neuropsychology, 11(6), 521–528. [PubMed] [Google Scholar]
- Serrallach, B. , Gross, C. , Bernhofs, V. , Engelmann, D. , Benner, J. , Gundert, N. , … Seither‐Preisler, A. (2016). Neural biomarkers for dyslexia, ADHD, and ADD in the auditory cortex of children. Frontiers in Neuroscience, 10, 324 10.3389/fnins.2016.00324 [DOI] [PMC free article] [PubMed] [Google Scholar]
- Sesma, H. W. , Mahone, E. M. , Levine, T. , Eason, S. H. , & Cutting, L. E. (2009). The contribution of executive skills to reading comprehension. Child Neuropsychology, 15(3), 232–246. 10.1080/09297040802220029 [DOI] [PMC free article] [PubMed] [Google Scholar]
- Sexton, C. C. , Gelhorn, H. L. , Bell, J. A. , & Classi, P. M. (2012). The co‐occurrence of Reading disorder and ADHD: Epidemiology, treatment, psychosocial impact, and economic burden. Journal of Learning Disabilities, 45(6), 538–564. 10.1177/0022219411407772 [DOI] [PubMed] [Google Scholar]
- Shaffer, J. P. (1995). Mutiple hypothesis testing. Annual Review of Psychology, 46, 561–584. [Google Scholar]
- Shanahan, M. A. , Pennington, B. F. , Yerys, B. E. , Scott, A. , Boada, R. , Willcutt, E. G. , … DeFries, J. C. (2006). Processing speed deficits in attention deficit/hyperactivity disorder and reading disability. Journal of Abnormal Child Psychology, 34(5), 585–602. 10.1007/s10802-006-9037-8 [DOI] [PubMed] [Google Scholar]
- Smith, A. , Taylor, E. , Rogers, J. W. , Newman, S. , & Rubia, K. (2002). Evidence for a pure time perception deficit in children with ADHD. Journal of Child Psychology and Psychiatry, 43(4), 529–542. [DOI] [PubMed] [Google Scholar]
- Snowling, M. J. (2004). The science of dyslexia: A review of contemporary approaches In Turner M. & Rack J. (Eds.), The study of dyslexia (pp. 77–90). Boston, MA: Springer. [Google Scholar]
- Spencer, T. J. , Biederman, J. , & Mick, E. (2007). Attention‐deficit/hyperactivity disorder: Diagnosis, lifespan, comorbidities, and neurobiology. Journal of Pediatric Psychology, 32(6), 631–642. 10.1093/jpepsy/jsm005 [DOI] [PubMed] [Google Scholar]
- Stephens, T. L. (2014). The assessment of executive functioning using the Delis‐Kaplan Executive Functions System (D‐KEFS) In Goldstein S. & Naglieri J. A. (Eds.), Handbook of executive functioning (pp. 209–222). New York, NY, US: Springer Science + Business Media; 10.1007/978-1-4614-8106-5_13 [DOI] [Google Scholar]
- Stern, S. K. , & Morris, M. K. (2013). Discrimination of ADHD and reading disability in adults using the D‐KEFS. Archives of Clinical Neuropsychology, 28(2), 125–134. 10.1093/arclin/acs111 [DOI] [PubMed] [Google Scholar]
- Stubenrauch, C. , Freund, J. , Alecu de Flers, S. , Scharke, W. , Braun, M. , Jacobs, A. , & Konrad, K. (2014). Non‐word reading and Stroop interference: What differentiates ADHD and reading disability? Journal of Clinical and Experimental Neuropsychology, 36, 9999–9999. 10.1080/13803395.2013.878690 [DOI] [PubMed] [Google Scholar]
- Suskauer, S. J. , Simmonds, D. J. , Caffo, B. S. , Denckla, M. B. , Pekar, J. J. , & Mostofsky, S. H. (2008). fMRI of intrasubject variability in ADHD: Anomalous premotor activity with prefrontal compensation. Journal of the American Academy of Child and Adolescent Psychiatry, 47(10), 1141–1150. 10.1097/CHI.0b013e3181825b1f [DOI] [PMC free article] [PubMed] [Google Scholar]
- Suskauer, S. J. , Simmonds, D. J. , Fotedar, S. , Blankner, J. G. , Pekar, J. J. , Denckla, M. B. , & Mostofsky, S. H. (2008). Functional magnetic resonance imaging evidence for abnormalities in response selection in attention deficit hyperactivity disorder: Differences in activation associated with response inhibition but not habitual motor response. Journal of Cognitive Neuroscience, 20(3), 478–493. 10.1162/jocn.2008.20032 [DOI] [PMC free article] [PubMed] [Google Scholar]
- Temple, E. (2002). Brain mechanisms in normal and dyslexic readers. Current Opinion in Neurobiology, 12(2), 178–183. [DOI] [PubMed] [Google Scholar]
- Thomason, M. E. , Burrows, B. E. , Gabrieli, J. D. , & Glover, G. H. (2005). Breath holding reveals differences in fMRI BOLD signal in children and adults. NeuroImage, 25(3), 824–837. 10.1016/j.neuroimage.2004.12.026 [DOI] [PubMed] [Google Scholar]
- Toplak, M. E. , Rucklidge, J. J. , Hetherington, R. , John, S. C. , & Tannock, R. (2003). Time perception deficits in attention‐deficit/hyperactivity disorder and comorbid reading difficulties in child and adolescent samples. Journal of Child Psychology and Psychiatry, 44(6), 888–903. [DOI] [PubMed] [Google Scholar]
- Torgesen, J. K. , Wagner, R. K. , & Rashotte, C. A. (1999). Test of word Reading efficiency [TOWRE]. Austin, TX: PRO‐ED. [Google Scholar]
- Vaidya, C. J. , Bunge, S. A. , Dudukovic, N. M. , Zalecki, C. A. , Elliott, G. R. , & Gabrieli, J. D. (2005). Altered neural substrates of cognitive control in childhood ADHD: Evidence from functional magnetic resonance imaging. American Journal of Psychiatry, 162(9), 1605–1613. 10.1176/appi.ajp.162.9.1605 [DOI] [PMC free article] [PubMed] [Google Scholar]
- van Bergen, E. , van der Leij, A. , & de Jong, P. F. (2014). The intergenerational multiple deficit model and the case of dyslexia. Frontiers in Human Neuroscience, 8, 1–13. 10.3389/fnhum.2014.00346 [DOI] [PMC free article] [PubMed] [Google Scholar]
- Van De Voorde, S. , Roeyers, H. , Verte, S. , & Wiersema, J. R. (2010). Working memory, response inhibition, and within‐subject variability in children with attention‐deficit/hyperactivity disorder or reading disorder. Journal of Clinical and Experimental Neuropsychology, 32(4), 366–379. 10.1080/13803390903066865 [DOI] [PubMed] [Google Scholar]
- Van De Voorde, S. , Roeyers, H. , & Wiersema, J. R. (2010). Error monitoring in children with ADHD or reading disorder: An event‐related potential study. Biological Psychology, 84(2), 176–185. 10.1016/j.biopsycho.2010.01.011 [DOI] [PubMed] [Google Scholar]
- Vellutino, F. R. , Fletcher, J. M. , Snowling, M. J. , & Scanlon, D. M. (2004). Specific reading disability (dyslexia): What have we learned in the past four decades? Journal of Child Psychology and Psychiatry, 45(1), 2–40. [DOI] [PubMed] [Google Scholar]
- von Aster, M. G. , & Shalev, R. S. (2007). Number development and developmental dyscalculia. Developmental Medicine and Child Neurology, 49(11), 868–873. 10.1111/j.1469-8749.2007.00868.x [DOI] [PubMed] [Google Scholar]
- Wadsworth, S. J. , DeFries, J. C. , Willcutt, E. G. , Pennington, B. F. , & Olson, R. K. (2015). The Colorado longitudinal twin study of reading difficulties and ADHD: Etiologies of comorbidity and stability. Analytical Chemistry, 25, 368–379. 10.1016/j.cogdev.2010.08.003.Personal [DOI] [PMC free article] [PubMed] [Google Scholar]
- Wagner, R. K. , Torgesen, J. K. , & Rashotte, C. A. (1999). Comprehensive test of phonological processing. Austin TX: PRO‐ED. [Google Scholar]
- Walhovd, K. B. , Fjell, A. M. , Reinvang, I. , Lundervold, A. , Dale, A. M. , Eilertsen, D. E. , … Fischl, B. (2005). Effects of age on volumes of cortex, white matter and subcortical structures. Neurobiology of Aging, 26(9), 1261–1270; discussion 1275–1268. 10.1016/j.neurobiolaging.2005.05.020 [DOI] [PubMed] [Google Scholar]
- Wang, L. , Zhu, C. , He, Y. , Zang, Y. , Cao, Q. , Zhang, H. , … Wang, Y. (2009). Altered small‐world brain functional networks in children with attention‐deficit/hyperactivity disorder. Human Brain Mapping, 30(2), 638–649. 10.1002/hbm.20530 [DOI] [PMC free article] [PubMed] [Google Scholar]
- Willcutt, E. G. (2018). ADHD and reading disorder In Benaschewski T., Coghill D., & Zuddas A. (Eds.), Attention deficit hyperactivity disorder. Oxford: Oxford University Press. [Google Scholar]
- Willcutt, E. G. , Betjemann, R. S. , McGrath, L. M. , Chhabildas, N. A. , Olson, R. K. , DeFries, J. C. , & Pennington, B. F. (2010). Etiology and neuropsychology of comorbidity between RD and ADHD: The case for multiple‐deficit models. Cortex, 46(10), 1345–1361. 10.1016/j.cortex.2010.06.009 [DOI] [PMC free article] [PubMed] [Google Scholar]
- Willcutt, E. G. , Nigg, J. T. , Pennington, B. F. , Solanto, M. V. , Rohde, L. A. , Tannock, R. , … Lahey, B. B. (2012). Validity of DSM‐IV attention deficit/hyperactivity disorder symptom dimensions and subtypes. Journal of Abnormal Psychology, 121(4), 991–1010. 10.1037/a0027347 [DOI] [PMC free article] [PubMed] [Google Scholar]
- Willcutt, E. G. , Pennington, B. F. , Boada, R. , Ogline, J. S. , Tunick, R. A. , Chhabildas, N. A. , & Olson, R. K. (2001). A comparison of the cognitive deficits in reading disability and attention‐deficit/hyperactivity disorder. Journal of Abnormal Psychology, 110(1), 157–172. [DOI] [PubMed] [Google Scholar]
- Willcutt, E. G. , Pennington, B. F. , Olson, R. K. , Chhabildas, N. , & Hulslander, J. (2005). Neuropsychological analyses of comorbidity between reading disability and attention deficit hyperactivity disorder: In search of the common deficit. Developmental Neuropsychology, 27(1), 35–78. 10.1207/s15326942dn2701_3 [DOI] [PubMed] [Google Scholar]
- Willcutt, E. G. , Chhabildas, N. , Kinnear, M. , Defries, J. C. , Olson, R. K. , Leopold, D. R. , … Pennington, B. F. (2014). The internal and external validity of sluggish cognitive tempo and its relation with DSM‐IV ADHD. Journal of Abnormal Child Psychology, 42, 21–35. 10.1007/s10802-013-9800-6 [DOI] [PMC free article] [PubMed] [Google Scholar]
- Willcutt, E. G. , Nigg, J. T. , Pennington, B. F. , Solanto, M. V. , Rohde, L. A. , Tannock, R. , … Lahey, B. B. (2013). NIH public access. Journal of Abnormal Psychology, 121(4), 991–1010. 10.1037/a0027347.Validity [DOI] [PMC free article] [PubMed] [Google Scholar]
- Willcutt, E. G. , Pennington, B. F. , Olson, R. K. , & DeFries, J. C. (2007). Understanding comorbidity: A twin study of reading disability and attention‐deficit/hyperactivity disorder. American Journal of Medical Genetics, Part B: Neuropsychiatric Genetics, 144, 709–714. 10.1002/ajmg.b.30310 [DOI] [PubMed] [Google Scholar]
- Williams, V. J. , Juranek, J. , Cirino, P. , & Fletcher, J. M. (2018). Cortical thickness and local gyrification in children with developmental dyslexia. Cerebral Cortex, 28(3), 963–973. 10.1093/cercor/bhx001 [DOI] [PMC free article] [PubMed] [Google Scholar]
- Wodka, E. L. , Loftis, C. , Mostofsky, S. H. , Prahme, C. , Larson, J. C. , Denckla, M. B. , & Mahone, E. M. (2008). Prediction of ADHD in boys and girls using the D‐KEFS. Archives of Clinical Neuropsychology, 23(3), 283–293. 10.1016/j.acn.2007.12.004 [DOI] [PMC free article] [PubMed] [Google Scholar]
- Wodka, E. L. , Mostofsky, S. H. , Prahme, C. , Gidley Larson, J. C. , Loftis, C. , Denckla, M. B. , & Mahone, E. M. (2008). Process examination of executive function in ADHD: Sex and subtype effects. The Clinical Neuropsychologist, 22(5), 826–841. 10.1080/13854040701563583 [DOI] [PMC free article] [PubMed] [Google Scholar]
- Wodka, E. L. , Mostofsky, S. H. , Prahme, C. , Larson, G. , Jennifer, C. , Loftis, C. , … Mark Mahone, E. (2007). Process examination of executive function in ADHD: Sex and subtype effects. The Clinical Neuropsychologist, 22, 826–841. 10.1080/13854040701563583 [DOI] [PMC free article] [PubMed] [Google Scholar]
- Wolf, M. , & Denckla, M. B. (2005). RAN/RAS: Rapid automatized naming and rapid alternating. Austin, TX: PRO‐ED, Inc. [Google Scholar]
- Yu, X. , Raney, T. , Perdue, M. V. , Zuk, J. , Ozernov‐Palchik, O. , Becker, B. L. C. , … Gaab, N. (2018). Emergence of the neural network underlying phonological processing from the prereading to the emergent reading stage: A longitudinal study. Human Brain Mapping, 39(5), 2047–2063. 10.1002/hbm.23985 [DOI] [PMC free article] [PubMed] [Google Scholar]
- Yu, X. , Zuk, J. , & Gaab, N. (2018). What factors facilitate resilience in developmental dyslexia? Examining protective and compensatory mechanisms across the neurodevelopmental trajectory. Child Development Perspectives, 12(4), 240–246. 10.1111/cdep.12293 [DOI] [PMC free article] [PubMed] [Google Scholar]
- Zhan, C. , Liu, Y. , Wu, K. , Gao, Y. , & Li, X. (2017). Structural and functional abnormalities in children with attention‐deficit/hyperactivity disorder: A focus on Subgenual anterior cingulate cortex. Brain Connectivity, 7(2), 106–114. 10.1089/brain.2016.0444 [DOI] [PMC free article] [PubMed] [Google Scholar]
- Zuk, J. , Perdue, M. V. , Becker, B. , Yu, X. , Chang, M. , Raschle, N. M. , & Gaab, N. (2018). Neural correlates of phonological processing: Disrupted in children with dyslexia and enhanced in musically trained children. Developmental Cognitive Neuroscience, 34, 82–91. 10.1016/j.dcn.2018.07.001 [DOI] [PMC free article] [PubMed] [Google Scholar]
Associated Data
This section collects any data citations, data availability statements, or supplementary materials included in this article.
Supplementary Materials
Figure S1 Example stimuli for all fMRI tasks.
Figure S2 The results for the fMRI ROI validation analysis for each fMRI task are illustrated. The mean and standard deviations of the normalized beta values for all groups are displayed. The ANOVA for the phonological processing task revealed significant effects for the left fusiform gyrus and the left occipitotemporal area. Typically developing children (blue) and COM children (purple) exhibit increased brain activation compared to the RD (red) and ADHD (green) groups. For the go/no‐go task, the TYP revealed increased activation in SMA/ACC compared to COM and ADHD children. The ANOVA for the reading fluency task revealed a significant effect, which was mainly due to increased activation in the TYP, ADHD and COM groups compared to the RD group.