

SUMMARY
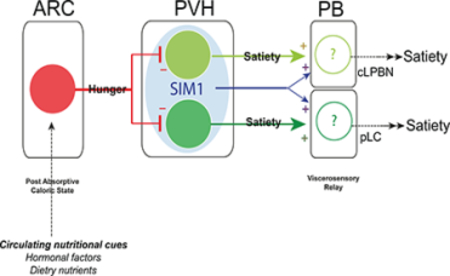
SIM1-expressing paraventricular hypothalamus (PVH) neurons are key regulators of energy balance. Within the PVHSIM1 population, melanocortin-4 receptor-expressing (PVHMC4R) neurons are known to regulate satiety and bodyweight, yet they account for only half of PVHSIM1 neuron-mediated regulation. Here we report that PVH prodynorphin-expressing (PVHPDYN) neurons, which notably lack MC4Rs, function independently and additively with PVHMC4R neurons to account for the totality of PVHSIM1 neuron-mediated satiety. Moreover, PVHPDYN neurons are necessary for prevention of obesity in an independent but equipotent manner to PVHMC4R neurons. While PVHPDYN and PVHMC4R neurons both project to the parabrachial complex (PB), they synaptically engage distinct efferent nodes, the pre-locus coeruleus (pLC) and central lateral parabrachial nucleus (cLPBN), respectively. PB-projecting PVHPDYN neurons, like PVHMC4R neurons, receive input from interoceptive ARCAgRP neurons, respond to caloric state, and are sufficient and necessary to control food intake. This expands the CNS satiety circuitry to include two non-overlapping PVH to hindbrain circuits.
TOC blurb:
Li et al. discover that PVHPDYN neurons, additively with PVHMC4R neurons, are responsible for PVH-mediated satiety. Both PVH neurons are distinct, equipotent, and use parallel projections to different aspects of the parabrachial complex to cause satiety and prevent obesity.
Graphical Abstract
INTRODUCTION
Although appetite control is the most efficacious treatment for obesity, current pharmacotherapies are limited by efficacy and/or side effects (Gautron et al., 2015). Complex neural circuits regulate feeding behavior in response to a variety of contexts. Among them, satiety circuits control food intake specifically in response to caloric sufficiency in order to maintain energy balance (Andermann and Lowell, 2017). The PVH is a critical node in this circuitry and contains neuronal populations necessary for satiety and the prevention of obesity. Indeed, lesions of the PVH (Gold et al., 1977), haploinsufficiency in both mice and humans of SIM1 (Single minded-1), a transcription factor expressed by most PVH neurons and necessary for their development (Holder et al., 2000; Michaud et al., 2001) and genetic ablation of PVHSIM1 neurons (Xi et. al 2013), all cause hyperphagia and obesity. Also, gene manipulations that perturb normal PVH or PVHSIM1 neuron function, such as disruption of glutamate release (via deletion of Vglut2) (Xu et. al 2013), neurotrophic factor secretion (via deletion of BDNF) (An et. al 2015) or DNA methylation and its effectors (via deletion of Dnmt3 or MECP2) (Fyffe et. al 2008, Kohno et. al, 2014) all dramatically disrupt normal food intake and energy balance. Chemogenetically activating PVHSIM1 neurons (Atasoy et al., 2012) or a heterogeneous subset of NOS1-expressing (Sutton et al., 2014) PVHSIM1 neurons supresses appetite Reciprocally, chemogenetic inhibition of PVHSIM1 neurons cause voracious food consumption in calorically replete mice, comparable to that seen in fasted animals (Atasoy et al., 2012). Collectively, these findings demonstrate that the PVH, and PVHSIM1 neurons in particular, play a vital role in regulating satiety, and consequently body weight.
Within the broader and heterogeneous PVHSIM1 neuron population, the first specific satiety neurons to be identified were those expressing the melanocortin-4 receptor (PVHMC4R neurons) (Balthasar et al., 2005). The MC4R and its endogenous ligands, agouti-related peptide (AgRP; an inverse agonist and/or antagonist) and alpha-melanocyte stimulating hormone (α-MSH; an agonist, the cleavage product of the POMC precursor peptide) are components of the central melanocortin system, which is a critical regulator of energy balance (Krashes et al., 2016). Indeed, the importance of this network is highlighted by the fact that loss-of-function mutations in the genes encoding POMC or MC4R result in profound hyperphagia and early-onset obesity in both mice and humans (Huszar et al., 1997; Krude et al., 1998; Yaswen et al., 1999; Yeo et al., 1998). AgRP and POMC-expressing neurons in the arcuate hypothalamus (ARC) are first order interoceptive neurons that antagonistically regulate energy balance in response to circulating nutritional cues (Flak and Myers, 2016; Morton et al., 2014; Müller et al., 2015). Specifically, ARCAgRP neurons are activated by caloric deficiency and protect against starvation by increasing energy intake and suppressing energy expenditure (Hahn et al., 1998; Krashes et al., 2016), while ARCPOMC neurons are activated by caloric sufficiency and promote satiety and energy expenditure (Krashes et al., 2016; Mizuno et al., 1998). Experimental manipulations of these two populations cause significant effects on feeding behavior. Chemo- or optogenetic activation of ARCAgRP neurons increases food intake, whereas activation of ARCPOMC neurons decreases food intake (Aponte et al., 2011; Atasoy et al., 2012; Fenselau et al., 2017; Krashes et al., 2011; Zhan et al., 2013). Conversely, inhibition, ablation or removal of key signalling molecules from ARCAgRP neurons produces hypophagia and starvation while loss of function in POMC neurons produces hyperphagia and obesity (Atasoy et al., 2012; Gropp et al., 2005; Koch et al., 2015; Krashes et al., 2011; Luquet et al., 2005; Zhan et al., 2013). ARCAgRP and ARCPOMC neurons regulate appetite in part by inhibition and activation, respectively, of second-order, satiety-promoting PVHMC4R neurons (Balthasar et al., 2005; Garfield et al., 2015; Shah et al., 2014). Like upstream ARCPOMC neurons, PVHMC4R neurons are similarly activated by caloric sufficiency and are both necessary and sufficient for satiety (Garfield et al., 2015).
While PVHMC4R neurons are undoubtedly critical for satiety regulation, two independent lines of evidence suggest that they do not explain the entire satiety effect mediated by PVHSIM1 neurons. First, chemogenetic inhibition of PVHMC4R neurons causes a degree of hyperphagia that appears to be only ~50% of that caused by chemogenetic inhibition of PVHSIM1 neurons (food intake during the first hour, normalized to saline (Δ) ~0.3 g for PVHMC4R neurons (Garfield et al., 2015) vs. ~0.6 g for PVHSIM1 neurons (Atasoy et al., 2012)). Secondly, ARCAgRP neurons provide strong GABAergic inhibition to not only PVHMC4R neurons but also MC4R-negative PVH neurons of unknown identity (Garfield et al., 2015). Moreover, this MC4R-negative PVH population may also be involved in ARCAgRP-driven food intake since optogenetic occlusion of ARCAgRP ➔PVH driven hunger is totally blocked by concomitant PVHSIM1 neuron activation (Atasoy et al., 2012), but only partially blocked by concomitant activation of PVHMC4R neurons (Garfield et al., 2015). Together, these findings suggest the existence of MC4R-negative, but SIM1-positive PVH neurons that, like PVHMC4R neurons, are also downstream of ARCAgRP neurons and similarly regulate satiety. The search for other populations of PVH satiety neurons has been ongoing, with recent findings suggesting that, PVHCCKAR (cholecystokinin), PVHBDNF (brain derived neurotrophic factor), or PVHGLP1R (glucagon like receptor 1) expressing neurons may also participate in satiety regulation (An et al., 2015; D’Agostino et al., 2016; Li et al., 2018; Liu et al., 2017). However, many of these subtypes overlap significantly with PVHMC4R neurons and there is no evidence that they provide non-redundant regulation of satiety and bodyweight independently from PVHMC4R neurons.
In the present study, we find that PVHPDYN neurons are a novel population of satiety- and body-weight regulating neurons. Importantly, we demonstrate that PVHPDYN neurons are not only anatomically separate, but also functionally independent from PVHMC4R neurons such that the two populations cause additive satiety and bodyweight regulation. These data directly implicates PVHPDYN neurons as the “missing” MC4Rnegative component of PVHSIM1 neuron-regulated appetite and obesity. Moreover, we use genetically enabled circuit mapping and real-time manipulations to interrogate this novel satiety circuit and its efferent circuitry. We find that these two populations achieve independent and additive satiety regulation via two parallel, but distinct efferent circuits that engage different nuclei within the parabrachial complex.
RESULTS
PVHPDYN neurons are the “missing” SIM1-positive, MC4R-negative satiety population
We propose the existence of “unidentified” PVH satiety neurons. If these neurons do exist, they should be SIM1-positive, MC4R-negative, and like PVHMC4R satiety neurons, they should be necessary for satiety, as demonstrated by hyperphagia upon functional inhibition. Based on prior studies, we eliminated many candidate populations on the basis that, unlike PVHSIM1 or PVHMC4R neurons, their chemogenetic inhibition does not cause hyperphagia. Eliminated PVH neurons include those expressing oxytocin (OXT), corticotropin-releasing hormone (CRH), vasopressin (AVP), thyrotropin-releasing hormone (TRH) and pituitary adenylate cyclase-activating polypeptide (PACAP) (Garfield et al., 2015; Krashes et al., 2014; Pei et al., 2014). However, one major group of PVH neurons has not previously been investigated, namely those that express PDYN. While little is known about the function of this population in terms of regulating energy balance, it is likely to be distinct from the PVHMC4R population since conditional reactivation of the Mc4r gene specifically in PDYN neurons fails to reduce the obesity phenotype of otherwise Mc4r-null Mc4r-loxTB mice (Shah et al., 2014). In contrast, reactivation of the Mc4r gene in SIM1 neurons normalizes this hyperphagia and obesity phenotype (Balthasar et al., 2005). Building on this observation, we proceeded to characterize the nature and function of PVHPDYN neurons within the context of satiety and body weight regulation.
First, using histological analysis, we determined if PVHPDYN neurons are indeed anatomically distinct from PVHMC4R neurons. PVHPDYN and PVHMC4R neurons were visualized using Mc4r-T2A-Cre::Ai9-Rosa26-LSL-TdTom::Pdyn-EGFP mice generated by intercrossing previously published lines (Garfield et al., 2015; Gong et al., 2003; Madisen et al., 2010) (Fig 1A). We validated that Pdyn-EGFP BAC transgenic mice express EGFP accurately in PVHPDYN neurons by comparison to TdTOM reporter expression driven by Pdyn-IRES-Cre mice (which has previously been validated using in situ hybridization) (Krashes et al., 2014) in Pdyn-IRES-Cre::Ai9-Rosa26-LSL-TdTom::Pdyn-EGFP mice, (Fig S1A-C). Having validated the Pdyn-EGFP mice, we investigated potential overlap between the PVHPDYN and PVHMC4R populations. Confocal microscopy was used to quantify PDYN-EGFP-expressing and MC4R::TdTOM-expressing neurons across the rostral-caudal extent of the PVH (Fig 1B). Approximately 90% of all PVHPDYN neurons do not express MC4R. Likewise, ~90% of PVHMC4R neurons do not express PDYN (Fig 1C). Next, to determine if PVHPDYN neurons are a subset of PVHSIM1 neurons, we generated Sim1-IRES-Cre::Ai9-Rosa26-LSL-TdTom::Pdyn-EGFP mice (Fig S1D). Using confocal imaging, we found that the majority of PVHPDYN neurons (~85%) are indeed SIM1-expressing and that they comprise ~37% of all PVHSIM1 neurons (Fig S1E-F). Thus, PVHPDYN neurons are SIM1-expressing and are largely anatomically distinct from PVHMC4R neurons.
Figure 1. PVHPDYN neurons are a MC4R-negative satiety population that accounts for the missing 50% of PVHSIM1 neuron-mediated satiety.

(A) Schematic of Mc4r-T2A-Cre::Ai9-Rosa26-LSL-TdTom::Pdyn-EGFP mouse. (B) Representative histological sections of the PVH from rostral to caudal (MC4R::TdTOM=red, PDYN-EGFP=green, double labeled=yellow) (C) Quantification MC4R::TdTOM+, PDYN-EGFP+ vs. double labeled neurons summed across the rostra-caudal extent of the PVH (n=4). (D) Schematic of AAV-DIO-hM4Di injection in the PVH of Sim1-IRES-Cre, Mc4r-T2A-Cre, Pdyn-IRES-Cre, or compound Pdyn-IRES-Cre::Mc4r-T2A-Cre mice. (E) Representative images of hM4Di-mCherry expression in PVHSIM1, PVHMC4R, PVHPDYN, and PVHPDYN::MC4R neurons in the PVH. (F) Light-cycle cumulative food intake in sated mice following saline vs. CNO/hM4Di inhibition of PVHSIM1, PVHMC4R, PVHPDYN and PVHPDYN::MC4R neurons. PVHSIM1 n=6: Repeated Measures (RM) 2 way ANOVA Time F(3,15)=87.43 ****P<0.0001, Treatment F(1,5)=243.8 ****P<0.00001, Interaction F(3,15)=57.22. Sidak’s Multiple Comparisons: Saline vs. CNO ****P<0.00001 at 1,2,3 hours. PVHMC4R n=7: RM 2 way ANOVA Time F(3,18)=23.47 ****P<0.0001. Treatment F(1,6)=109.4 ****P<0.0001, Interaction F(3,18)=23.01, ****P<0.0001, Sidak’s Multiple Comparisons: Saline vs. CNO **P<0.01 at hour 1, ****P<0.0001 at hour 2,3. PVHPDYN n=5: RM 2 way ANOVA Time F (3,12)=26.03 ****P<0.0001, Treatment F(1,4)=50.07 ***P<0.001, Interaction F(3,12)=34.47 ****P<0.0001. Sidak’s Multiple Comparisons: Saline vs. CNO ****P<0.0001 at hours 1,2,3. PVHPDYN::MC4R n=5: RM 2 way ANOVA Time F(3,12)=135. 4 ****P<0.0001, Treatment F(1,4)=245.9 *****P<0.0001, Interaction F(3,12)=88.51 ****P<0.0001, Sidak’s Multiple Comparisons: Saline vs. CNO ****P<0.0001 at hours 1,2,3. (G) Same data at the 3 hour time point quantified as change in food intake (CNO-Saline). ANOVA F(3, 18) = 25.87 ****P<0.0001, Tukey’s Multiple Comparisons between groups: PVHSIM1 vs. PVHMC4R ****P<0.0001, PVHSIM1 vs. PVHPDYN ****P>0.0001, PVHMC4R vs. PVHPDYN:MC4R ***P<0.001, PVHPDYN vs. **PVHPDYN::MC4R P<0.01, PVHPDYN::MC4R vs. PVHSIM1 N.S., PVHMC4R vs. PVHPDYN NS. Data are represented as mean ± SEM.
We next asked if PVHPDYN neurons are necessary for satiety and, if so, how this compares to PVHMC4R and PVHSIM1 neuron-regulated satiety. To accomplish this, PVHPDYN, PVHMC4R and PVHSIM1 neurons were chemogenetically inhibited during a time of caloric repletion (ad libtum fed, light cycle) and effects on food intake were assessed. The chemogenetic inhibitory virus AAV-DIO-hM4Di-mCherry was stereotaxically injected bilaterally into the PVH of Pdyn-IRES-Cre mice, Mc4r-T2A-Cre, Sim1-IRES-Cre, or compound Pdyn-IRES-Cre::Mc4r-T2A-Cre mice (Fig 1D-E). The ability of CNO to inhibit action potential firing in hM4Di-mCherry-expressing PVH neurons of each subtype was tested and confirmed by ex vivo slice electrophysiology with bath application of CNO (5 μM) in presence of synaptic blockers (Fig S1G-H). For these feeding studies, food consumption was measured, following IP saline or CNO injection, over 3 hours of the light cycle (9 am-12 pm), when animals are calorically replete. Only mice with histologically confirmed bilateral hM4Di-mCherry expression completely covering and restricted to the PVH were included in the final analysis. We defined Δfood intake in each animal as the difference in food intake between CNO trials and saline control trials.
Within the context of a single controlled experiment, as we anticipated, chemogenetic inhibition of PVHMC4R neurons caused a level of hyperphagia that was only 41% of that seen following inhibition of PVHSIM1 neurons (PVHMC4R Δ=0.33 g ± 0.024 g/3 hr vs. PVHSIM1 Δ=0.80 g ± 0.069 g/3 hr)(Fig 1F-G). This confirms the notion that the PVHSIM1 population contains a presently unidentified subset of satiety neurons. In support of this hypothesis, we find that chemogenetic inhibition of PVHPDYN neurons caused marked hyperphagia (PVHPDYN Δ=0.41 g ± 0.038 g/3 hr) of a degree similar to that seen following inhibition of PVHMC4R neurons (Fig 1F-G) (Garfield et al., 2015). As was also true for PVHMC4R neurons (Garfield et al., 2015), chemogenetic activation of PVHPDYN neurons using AAV-DIO-hM3Dq-mCherry decreased food intake during the dark cycle (a time of physiological hunger) (Fig S1I-K). Thus, PVHPDYN neurons, like PVHMC4R neurons, exert bidirectional control over appetite.
Given the anatomical segregation of PVHPDYN and PVHMC4R satiety neurons, and the fact that inhibition of each population produces an effect that is ~ 50% of that seen following inhibition of PVHSIM1 neurons, we hypothesized that PVHPDYN neurons function independently of PVHMC4R neurons and that together they account for all PVHSIM1 neuron-mediated satiety. If this is indeed the case, then concomitant inhibition of both PVHPDYN+PVHMC4R populations should produce an additive degree of hyperphagia equal to that caused by inhibiting PVHSIM1 neurons. Consistent with this hypothesis, simultaneous chemogenetic inhibition of PVHMC4R and PVHPDYN neurons in Pdyn-IRES-Cre::Mc4r-T2A-Cre mice resulted in hyperphagia (Δ=0.70 g ± 0.029 g/3 hr) that was comparable to that observed following inhibition of PVHSIM1 neurons over the same time course (Fig 1F-G). Thus, PVHPDYN neurons act independently from PVHMC4R neurons such that together they account for the majority, if not the totality, of PVHSIM1 neuron-mediated satiety. Of note, mice with validated PVH misses (Fig S1L) did not exhibit any feeding response to CNO administration (Fig S1M), confirming that CNO itself at this dose has no effect on food intake. In summary, PVHPDYN neurons meet our anatomical and functional criteria for the missing PVH satiety population: they are SIM1-positive, MC4R-negative and necessary for satiety. Furthermore, they function independently but additively with PVHMC4R neurons to account for the totality of PVHSIM1 neuron-mediated satiety.
PVHPDYN neurons prevent obesity, independently of and additive with PVHMC4R neurons
Given our observation that PVHPDYN neurons control energy intake independently of PVHMC4R neurons, we hypothesized that they may also function chronically to prevent obesity. To this end we assessed the consequence of long-term inhibition of PVHPDYN, PVHMC4R and PVHPDYN+PVHMC4R neurons on food intake and body weight. We employed two experimental approaches: chronically inhibiting synaptic release using cre-dependent tetanus toxin virus (AAV-DIO-eGFP-2A-TeNT) and neuronal ablation using cre-dependent caspase virus (AAV-flex-taCasp3-TEVp). In the first experiment, within the same experimental cohort, mice of each genotype: Pdyn-IRES-Cre, Mc4r-T2A-Cre and Pdyn-IRES Cre::Mc4r-T2A-Cre received bilateral PVH injections of the tetanus toxin virus or control virus, AAV-DIO-GFP. Food intake was measured for one week prior to the viral injection surgeries, body weight was tracked over the next month, and food intake was measured again at the end of the study (Fig 2A,B). In the second experiment, Pdyn-IRES Cre::Ai9-Rosa26-LSL-TdTOM mice received bilateral PVH injections of caspase virus or DIO-GFP(Fig S2A-C) and followed a similar experimental timeline.
Figure 2. PVHPDYN neurons prevent obesity independent of and additive with PVHMC4R neurons.

(A) Schematic of AAVDJ-CMV-DIO-eGFP-2A-TeNT (Tetanus Toxin) injection in the PVH of Mc4r-T2A-Cre, Pdyn-IRES-Cre, or compound PDYN-IRES-Cre::Mc4r-T2A-Cre mice and experimental timeline. (B) Representative histological images from of eGFP2A-TeNT expression in PVHPDYN, PVHMC4R, and PVHPDYN::MC4R neurons in the PVH (C) Average daily food intake of animals of each genotype in the week prior to injection of AAV vs. after 4 weeks of synaptic silencing with AAV-DIO-TeNT. GFP n=6, MC4R n=7, PDYN n=11, PDYN::MC4R n=5. Repeated Measures (RM) 2Way ANOVA: Time Pre or post AAV injection: F (1, 20) = 41.28, ****P<0.0001, Sidak’s post hoc comparisons pre vs. post injection: GFP N.S., MC4R **P<0.01, PDYN **P<0.01 PDYN::MC4R **P<0.01. (D) Body weight of the same animals prior to injection of AAV and after injection, monitored biweekly for 4.5 weeks. Repeated Measures (RM) 2Way ANOVA: Time F (11, 297) = 149.45, ****P<0.0001. Group F(3,27)=6.816, **P<0.01. Interaction (F33,297)=14.83 ****P<0.0001. Sidak’s post hoc comparisons for each group: BW at X week post injection vs. baseline BW: GFP N.S. at all time points, MC4R ****P<0.0001 from1.5 weeks onwards, PDYN ****P<0.0001 from 1.5 weeks onward, PDYN::MC4R ****P<0.0001 from 1 week onward. Sidak’s post hoc comparisons between genotype groups at 4.5 weeks: GFP vs. MC4R, PDYN or MC4R::PDYN ****<P<0.0001, MC4R or PDYN vs. PDYN::MC4R ****P<0.0001, PDYN vs MC4R N.S. Data are represented as mean ± SEM.
Consistent with our acute inhibition studies, chronic inhibition of PVHPDYN neurons caused sustained hyperphagia and progressive development of obesity over 1 month, compared to baseline. As expected, GFP injected controls showed little change in food intake and bodyweight during the same time period. Food intake was markedly increased by ~30% at 1 month after neuronal ablation/silencing compared to baseline (Δ in food intake in TeNT and Caspase mice= ~+26% and +35% respectively) (Fig 2C, S2D). Body weight increased by ~30% in this time period. (Δ in body weight in TeNT and Caspase mice ~+35%) (Fig 2D, S2E). This progressive weight gain began days after viral injection surgery, reached significance in the second week following neuronal ablation/silencing and persisted for the duration of the experiment.
As anticipated, we observed similar hyperphagia and obesity when PVHMC4R neurons were chronically silenced using TeNT (FI Δ~+26%, BW Δ~+42% from baseline) (Fig 2C). Concomitant chronic silencing of both PVHPDYN and PVHMC4R neurons also resulted in hyperphagia, and remarkably produced an additive effect on obesity (BWΔ~+68%) (Fig 2D). Thus, PVHPDYN neurons are necessary for the long-term regulation of satiety and body weight and play an independent and additive role with PVHMC4R neurons in preventing obesity. The two populations together seem to comprise the entirety of the PVHSIM1 neurons’ capacity to prevent obesity.
PVHPDYN neurons and PVHMC4R neurons project in parallel to the parabrachial complex (PB), but engage distinct efferent sites
We next sought to determine the downstream site by which PVHPDYN neurons promote satiety. To map PVHPDYN neuron efferent projections across the brain, we injected Cre-dependent anterograde tracer AAV-DIO-Synaptophysin (Syp)-mCherry into the PVH of Pdyn-IRES-Cre mice (Fig 3A). We also compared PVHPDYN neuron projections to those of PVHMC4R and PVHSIM1 neurons via the same tracing method in Mc4r-T2A-Cre and Sim1-IRES-Cre mice (Fig 3A). PVHPDYN neurons project to three main neuroanatomical sites: the parabrachial complex (PB) (Fig 3B), the median eminence (ME), and the nucleus tractus solitaris/dorsal motor nucleus of the vagus (NTS/DMV) (Fig S3A,B). Lesser projection fields include: the rostral ventral lateral medulla (RVLM), lateral hypothalamus (LH), dorsal raphe nucleus (DRN), ventral lateral periaqueductal grey (vlPAG) and retrorubral field (RRF) (Fig S3C). Interestingly, PVHPDYN projection fields are similar to those of PVHMC4R neurons, which control food intake exclusively through projections to the central compartment of the lateral parabrachial nucleus (cLPBN) of the PB (Garfield et al., 2015). Notably, PVHPDYN and PVHMC4R neuron axonal projection fields within the PB are qualitatively similar, with dense projection fields confined to the cLPBN and the pre-locus coeruleus (pLC) (Figure 3B,C). Consistent with this finding, PVHSIM1 neurons, which contain both satiety populations, plus other non-satiety neurons, have a similar projection field in the pLC and cLPBN but also an additional lighter projection field in the external LPBN (eLBPN) (Fig 3D). Thus, PVH satiety neurons share a common projection profile within the PB.
Figure 3. PVHPDYN neurons and PVHMC4R neurons share a similar projection profile in the PB, but synaptically engage different effector nodes: pLC vs. cLPBN.

(A) Schematic of AAV-DIO-Syp-mCherry injections in the PVH of Pdyn-IRES-Cre, Mc4r-T2A-Cre or Sim1-IRES-Cre for anterograde tracing. (B-D) Axonal projection profiles of above PVH satiety populations in the parabrachial complex (PB) from rostral to caudal (Syp-mCherry=red co-labeled with immunohistochemistry for choline-acetyltransferase (ChAT) =grey and tyrosine hydroxylase (TH) = green). TH marks locus coeruleus (LC) neurons while TH and ChAT mark the transition from cLPBN to eLPBN. (E) Schematic of CRACM experiments to assay connectivity between PVHPDYN, PVHMC4R or PVHSIM1 neurons and downstream neurons in the pLC vs. cLPBN compartments of the PB. (F-K) Schematic and representative monosynaptic light-evoked excitatory current traces and connectivity from (F-G) PVHPDYN neurons to the pLC (n=4 mice) and to cLPBN (n=6 mice) (H-I) PVHMC4R neurons to pLC (n=3 mice), cLPBN (n=3 mice) and (J-K) PVHSIM1 neurons to pLC (n=3 mice) and cLPBN (n=3 mice) (L) Summary of the connectivity of PVHMC4R vs. PVHPDYN neurons to pLC or cLPBN compared to connectivity of PVHSIM1 neurons in both pLC and cLPBN. Data are represented as mean ± SEM.
To determine if projection to the cLPBN and pLC compartments of the PB is a feature unique to satiety-regulating PVH neurons, we used the same tracing method for PVH neuron populations that do not promote satiety (i.e. those that express CRH, TRH, PACAP, OXT, and AVP). This was accomplished using previously validated Cre-driver lines (Krashes et al., 2014) (Fig S3D). Interestingly, non-satiety PVH neurons do not make projections to the pLC or cLPBN that is detectable using these tracing methods (Fig S3E-I). For example, PVHAVP and PVHOXY neuron terminals are not present these regions of the PB complex (Fig S3G-H), while PVHCRH, PVHTRH and PVHPACAP neurons provide light innervation to neighboring eLPBN only (Fig 3SE-F,I). Thus, the dense and highly specific innervation of the cLPBN and pLC is a defining characteristic of PVH satiety-promoting neurons. Like PVHMC4R➔PB projections, this descending PVHPDYN➔PB circuit is therefore a likely mediator of PVHPDYN neuron-regulated satiety.
A previous study demonstrated that PVH-mediated satiety is contingent upon glutamatergic signaling (Xu et al., 2013). We therefore performed channelrhodopsin-2 assisted circuit mapping (CRACM) to assess glutamatergic synaptic transmission between PVHPDYN neurons and downstream neurons located in the pLC and cLPBN. AAV-DIO-ChR2-mCherry was injected in the PVH of Pdyn-IRES-Cre mice (Fig 3E). In ex vivo brain slices, we recorded from neurons within the PVHPDYN➔pLC or cLPBN axon projection field in whole cell voltage clamp mode and delivered pulses of 473 nm light to evoke excitatory postsynaptic currents (EPSCs). We found that PVHPDYN neurons make monosynaptic (<6 ms latency, TTX-insensitive) glutamatergic synapses onto neurons in the pLC (37%, 10/27 connected) (Fig 3G, S3K), but not the cLPBN (0%, 0/50 connected) (Fig 3F).
For comparison, we assayed the connectivity between PVHSIM1 or PVHMC4R neurons, and the same downstream regions, again using CRACM (Fig 3E). In contrast to PVHPDYN neurons, and consistent with previous reports (Garfield et al., 2015), we found that PVHMC4R neurons preferentially make glutamatergic synapses onto cLPBN neurons (55%,11/20 connected) (Fig 3H), but minimally onto pLC neurons (2/22,10% connected) (Fig 3I). As expected, we found that PVHSIM1 neurons which include both satiety populations, are synaptically connected to both pLC neurons (46%, 6/13 connected) (Fig 3K) and cLPBN neurons (58%,7/12 connected) (Fig 3J). Of note, this connectivity is approximately the sum of PVHPDYN➔pLC and PVHMC4R➔cLPBN (Fig 3L). Thus, PVHPDYN➔pLC and PVHMC4R➔cLPBN are parallel but distinct circuits that together comprise the entire PVHSIM1➔pLC/cLPBN circuit.
PVHPDYN neurons also project to several other neuroanatomical areas that have been implicated in the control of food intake such as: NTS/DMV (D’Agostino et al., 2016; Roman et al., 2016), DRN (Nectow et al., 2017; Stachniak et al., 2014), vlPAG (Stachniak et al., 2014) and LH (Jennings et al., 2013). Thus, we further assayed for glutamatergic CRACM connectivity between PVHPDYN neurons and neurons within these other projection fields (Fig S3J). We found no connectivity or very low connectivity in these areas: NTS 0/15, DMV 0/15, vlPAG 0/15, DRN 2/15, LH 3/30 (Fig S3L-Q). Comparing across all PVHPDYN projection fields, the pLC region of the PB is unique in its high connectivity of 37% compared to ~0–13% in all other projection sites (Fig S3Q). These data collectively point to the pLC as a projection site where PVHPDYN neurons cause satiety, at least as related to glutamatergic signaling (Xu et al., 2013).
The PB-projecting PVHPDYN neurons are regulated by caloric state and receive input from interoceptive ARCAgRP neurons
In accordance with their satiety promoting function, PVHMC4R neurons exhibit activity that correlates with caloric state (high activity when sated, and low activity when fasted) and receive inputs from first-order, interoceptive ARCAgRP neurons (Garfield et al., 2015). We therefore assessed these same characteristics in PVHPDYN neurons. To visually isolate PB-projecting PVHPDYN neurons, we injected the retrograde tracer, Cholera Toxin B (CTB), into the PB of Pdyn-IRES-Cre::Ai9-Rosa26-LSL-TdTom mice. Mice were fasted overnight and the next morning half of the experimental group was sacrificed in the fasted state while the other half was refed ad libitum for 2 hours before sacrifice (Fig 4A). FOS (protein product of an immediate-early gene that correlates with neuronal activity) and CTB immunohistochemistry was performed on brain slices from the fasted and refed groups. We used confocal microscopy to quantify the percentage of FOS+ PB-projecting PVHPDYN neurons across the rostral-caudal extent of the PVH. PB-projecting PVH neurons were topographically concentrated throughout the caudal PVH (Bregma AP −1.20) (~42%) and ventral lateral compartment of the mid-PVH (AP −0.90) (~46%), with fewer neurons in the rostral PVH (AP −0.60) (~11%) (Fig 4B, S4A-B). Summed across the PVH, the percentage of PB-projecting PVHPDYN neurons that were FOS+ was twice as high in the refed state compared to the fasted state (42.92 ± 1.9% vs. 21.8 ± 1.3%) (Fig 4C). Thus, like PVHMC4R neurons, PB-projecting PVHPDYN neurons are activated by caloric sufficiency.
Figure 4. PB-projecting PVHPDYN neurons respond to caloric state and receive input from ARCAgRP neurons.

(A) Schematic for FOS assay of neuronal activity in PB-projecting PVHPDYN neurons in different caloric states. CTB retrolabeling of PB-projecting PVHPDYN neurons in Pdyn-IRES-Cre::Ai9-Rosa26-LSL-TdTom mice and experimental paradigm to manipulate caloric state. (B) Representative images of the PVH from rostral to caudal (PDYN::TdTOM+ neurons=red, retrolabeled with immunohistochemistry for CTB CTB=grey and FOS=green. Insets show high-magnification images corresponding to boxed region. (C) Quantification of the % of FOS+ neurons out of all PB-projecting PVHPDYN across the rostral-caudal extent of the PVH n= 4–5 per group, RM 2 way ANOVA, PVH location and interaction= NS. Caloric state: F(1,7)=601.8, *****P<0.0001, Sidak’s Multiple Comparisons: Fasted vs. Refed at 3 locations within PVH AP-0.60 *P<0.05, AP-0.90 ***P<0.001, AP-1.20**P<0.01. (D) Schematic of CRACM experiment assaying connectivity of ARCAgRP neurons to PVHPDYN neurons in Agrp-IRES-Cre::PDYN-EGFP mice with circuit specific CTB-555 retrolabeling from the entire PB, the pLC only or the LPBN only. (E) Representative images of PDYN-GFP expressing neurons retrolabeled with CTB-555 across the rostral-caudal extent of the PVH (PDYN-EGFP=green, CTB-555=red, double-labeled=yellow) (F-I) Schematic and representative monosynaptic light-evoked inhibitory current traces and connectivity between ARCAgRP neurons and downstream PVHPDYN neurons with or without circuit specificity: (F) ARCAgRP➔randomly selected PVHPDYN neurons (n=3 mice) (G) ARCAgRP➔PB-projecting PVHPDYN neurons (n=2 mice) (H) ARCAgRP ➔pLC-projecting PVHPDYN neurons (n=2 mice) (I) ARCAgRP ➔LPBN-projecting PVHPDYN neurons (n=1 mouse) (J) Summary of above CRACM connectivity data from ARCAgRP ➔PVHPDYN neurons with or without circuit specificity. Data are represented as mean ± SEM.
We next asked which inputs might be conveying caloric state information to PB-projecting PVHPDYN neurons. One major source of interoceptive input to the PVH arises from ARCAgRP neurons (Atasoy et al., 2012). Most PVHMC4R satiety neurons receive GABAergic input from ARCAgRP neurons (83.3% connected) (Garfield et al., 2015), while non-satiety PVH neuronal subtypes that express CRH, OXY, AVP, PACAP and TRH receive little or no ARCAgRP neuron input (Garfield et al., 2015; Krashes et al., 2014). However, PVHMC4R neurons are not the only PVH neurons engaged by ARCAgRP neurons, since 20% of MC4R-negative PVH neurons also receive ARCAgRP GABAergic input (Garfield et al., 2015). We therefore tested if PB projecting PVHPDYN neurons might represent the missing population downstream of ARCAgRP neurons. To perform CRACM in the ARCAgRP➔PVHPDYN➔PB circuit, we injected AAV-DIO-ChR2-mCherry into the ARC of Agrp-IRES-Cre::Pdyn-EGFP mice and CTB-555 into the whole PB, the LPBN only, or the pLC only, to visually isolate the each population of PVHPDYN neurons that project to each target area (Fig 4D-E). In whole cell voltage-clamp mode, we recorded light-evoked ARCAgRP neuron-derived inhibitory postsynaptic currents (IPSCs) in PVHPDYN neurons. We found that 33% (8/24) of randomly selected PVHPDYN neurons received monosynaptic GABAergic ARCAgRP neuron input (<6ms latency) (Fig 4F). After enriching for the PVH➔PB satiety circuit by retrograde CTB-labeling, we found 57% (8/14) of PB (LPBN+pLC)-projecting PVHPDYN neurons (Fig 4G) and 90% (9/10) of pLC only-projecting PVHPDYN neurons receive ARCAgRP neuron input (Fig 3H). On the other hand, only 12.5% of LPBN only-projecting PVHPDYN neurons were connected (Fig 4I). Thus, PVHPDYN neurons are a previously unidentified MC4R-negative downstream target of the ARCAgRP➔PVH circuit. Moreover, the preferential connectivity of ARCAgRP neurons to PB-projecting, and especially high connectivity to pLC-projecting PVHPDYN neurons, further implicates the importance of the PVHPDYN➔ pLC circuit in regulating satiety (Fig 4J). Collectively, these data demonstrate that PB-projecting PVHPDYN neurons, like PVHMC4R neurons, possess key characteristics of a satiety neuron in that they respond to caloric state and receive inhibitory input from ARCAgRP neurons.
PVHPDYN➔PB projections are sufficient to induce satiety
We next used in vivo optogenetic terminal stimulation to determine if the PVHPDYN➔PB circuit is sufficient to suppress food intake. AAV-DIO-ChR2-mCherry was injected bilaterally into the PVH of Pdyn-IRES-Cre mice and optical fibers were placed over the PB (Fig 5A-B, S5C). We measured food intake for 3 hours during the dark cycle. We defined Δ food intake as the difference in food intake between light on trials and light off trials. Terminal stimulation significantly decreased dark-cycle food intake by ~50% (Δ=0.48 ± 0.05 g/3 hr) (Fig 5C), as compared to light off trials. As expected, control animals injected with AAV-DIO-mCherry and subjected to the same light stimulation protocol showed no changes in dark-cycle food intake (Fig S5A-C). Thus, this circuit is sufficient to reduce appetite. Moreover, PVHPDYN➔PB terminal stimulation reduced food intake by a similar magnitude compared to PVHMC4R➔PB terminal stimulation using the same light delivery protocol (Δ~0.42 g/3 hr) (Garfield et al., 2015).
Figure 5. PB-projecting PVHPDYN neurons are both sufficient and necessary for satiety, likely via downstream effector node pLC, a novel satiety-regulating site.

(A) Schematic of optogenetic terminal stimulation of the PVHPDYN➔PB circuit: AAV-DIO-ChR2-mCherry injection into the PVH of Pdyn-IRES-Cre mice and optical fiber delivery of 463nm light in the PB (B) Representative image of ChR2-mCherry expression in PVHPDYN neurons and their axon projection field in the PB with optical fiber placement over the PB. (C) Dark-cycle cumulative food intake over 3 hours during light off vs. light on terminal stimulation trials n=10 mice, RM 2 Way ANOVA Time F(3, 27)= 70.53 ****P<0.0001, Treatment F(1, 9)=70.53 ****P<0.0001, Interaction F(3, 27)=29.92 ****P<0.0001, Sidak’s Multiple Comparisons: Saline vs. CNO **P<0.01 at hour 1, ****P<0.0001 at hours 2 and 3. (D) Schematic of optogenetic terminal inhibition of PVHPDYN PB: AAV-DIO-ArchT-GFP injection into the PVH of Pdyn-IRES-Cre mice and optical fiber delivery of 532nm light in the PB (E) Representative image of ArchT-GFP expression in PVHPDYN neurons and their axon projection field in the PB with optical fiber placement over the PB (F) Light-cycle cumulative food intake over 3 hours during light off vs. light on terminal inhibition trials n=6, RM 2 way ANOVA Time F(3,15)= 90.23 ****P<0.0001, Treatment F(1, 5)= 90.23 ****P<0.0001, Interaction F(3,15) =21.88 ****P<0.0001. Sidak’s multiple comparisons: Saline vs. CNO ***P<0.001 at 1,2 hours, ****P<0.0001 at hour 3. (G) Schematic of AAV-DIO-Syp-mCherry guided fasted vs. refed FOS assay in the pLC projection field of PVHPDYN neurons (H) Representative images of FOS+ neurons (green) in the pLC axon projection field of PVHPDYN neurons (red) co-labeled with TH (grey) in fasted vs. refed states at low (top) and high (bottom) magnification (I) Quantification of the number of FOS+ cells in the pLC of mice sacrificed in the fasted vs. refed states across the rostral-caudal extent of the PVHPDYN pLC projection field n=5 per group. RM 2 way ANOVA Bregma level and Interaction NS, Caloric state: F(1,8)=299.9 ****P<0.0001, Sidak’s multiple comparisons: Fasted vs. Refed at each level of the pLC ****P<0.0001. (J) Schematic of chemogenetic inhibition experiment of the pLC with injection of AAV-hM4Di-mCherry in the pLC of wild type mice. (K) Representative image of GROUP 1 animals: histological cases with hM4Di-mCherry expression in the pLC (with spill over in i,d,vLPBN) (L) GROUP 1: Light-cycle cumulative food intake after saline vs. CNO treatment of animals with the above histology n=5, Time F(3,12)= 58.76 ****P<0.0001, Treatment F(1,4) =72.75 ** P<0.01, Interaction F(3,12)= 28.54 ****P<0.0001. Sidaks Multiple Comparisons: Saline vs. CNO: *P<0.05 at 1 hour, ****P<0.0001 at 2,3 hours (M) Representative image of GROUP 2 animals: histological cases with hM4Di-mCherry in i,d,vLPBN expression only, but not pLC (N) GROUP2: Light-cycle cumulative food intake after Saline vs. CNO treatment of animals with this histology n=4, RM 2 way ANOVA F(1,3) NS. Data are represented as mean ± SEM.
PVHPDYN➔PB projections are necessary for satiety.
We next investigated if the PVHPDYN➔ PB projection is necessary for satiety. To this end, we used optogenetic terminal inhibition to selectively reduce activity of the PVHPDYN➔PB circuit during the sated state. We injected AAV-DIO-ArchT-GFP bilaterally into the PVH of Pdyn-IRES-Cre mice and placed optical fibers bilaterally over the PB for delivery of 532 nm light (Fig 5D-E, S5F). Food intake was measured for 3 hours during the light cycle, when mice were calorically replete. Terminal inhibition of the PVHPDYN➔PB circuit significantly increased food intake by ~50% compared to light off trials (Δ= 0.27 ± 0.03 g/3 hr) (Fig 5F). Video analysis of feeding behavior confirmed that animals spent more time engaged in food consumption during light-on trials compared to light-off trials. In addition, there was an increased frequency of feeding bouts (Fig S5G-J). Control mice injected with AAV-DIO-GFP showed no change in food intake during the same light delivery protocol (Fig S5D-F). These data demonstrate that the PVHPDYN➔PB circuit is necessary for satiety.
The pLC is a novel satiety node
Our CRACM data (Fig 3G) suggest that PVHPDYN neurons regulate satiety by activating neurons in the pLC region. Since the pLC has not previously been implicated in control of food intake, we tested if this structure contains neurons that satisfy the criteria for satiety neurons (i.e. are responsive to changes in caloric state and drive hyperphagia upon inhibition). First, we assayed for caloric state-dependent neuronal activity using FOS immunohistochemistry. To provide anatomical specificity, we labeled the PVHPDYN axon projection field in the pLC by AAV-DIO-Synaptophysin (Syp)-mCherry injection into the PVH of Pdyn-IRES-Cre mice (Fig 5G). Animals were sacrificed in the fasted vs. refed states, as above, and FOS immunoreactive neurons quantified within the mCherry positive PVHPDYN➔pLC projection field (Fig 5H). In the refed state, fivefold more FOS+ neurons were observed in the PVHPDYN➔ pLC projection field compared to the fasted state (148.8 ± 3.5 cells vs. 26.0 ± 5.6 cells) (Fig 5I). Thus, pLC neurons downstream of PVHPDYN neurons are activated by caloric sufficiency.
To test if the pLC region contains neurons that are necessary for satiety we chemogenetically inhibited neurons in the pLC when mice were calorically replete. AAV-hM4Di-mCherry was injected bilaterally into the pLC of wild-type mice (Fig 5J). We confirmed that CNO was capable of inhibiting the action potential firing of hM4Di-mCherry expressing pLC neurons using ex vivo brain slice electrophysiology, as above (Fig S5 K,L). For food intake studies, light-cycle food intake was measured for 3 hours during the sated state, comparing saline vs. CNO treatments. Due to the absence of cell type-specific Cre-expressing mice for this study, and the small size of the pLC, complete targeting of the pLC without any infection beyond the pLC was not possible. As such, we undertook a subtractive approach to the analysis whereby mice were divided into two groups based on post hoc histology. The first group had hM4DimCherry expression in the pLC area that receive PVHPDYN inputs and spillover into neighboring LPBN regions (LPBN internal, ventral, or dorsal compartments, i,v,dLPBN) that do not receive input from neither PVHPDYN nor PVHPDYN neurons (Fig 5K). The second group had no hM4Di-mCherry expression in the pLC, but only in the neighboring i,v,dLPBN regions (Fig 5M). Cases with any amount of cLPBN hM4Di transfection, where PVHMC4R neurons exert their effects (Garfield et al., 2015), were excluded from the analysis. Images from all mice included in the analysis from both groups were documented (Fig S5M-N). Consistent with a role for the pLC in regulating satiety, group 1 mice (pLC + i,v,dLPBN hit) exhibited a hyperphagic response to CNO administration, as compared to saline (Δ= 0.30 ± 0.02g) (Fig 5L), while group 2 mice (only i,v,dLPBN hit, no pLC) showed no change in food intake (Δ= 0.019 ± 0.03g) (Fig 5N). In summary, these results demonstrate that the pLC contains neurons that are activated by caloric sufficiency and are necessary for satiety. Combined with our CRACM studies, these findings strongly support the conclusion that neurons within the pLC region are important downstream effectors of the PVHPDYN➔PB satiety circuit.
DISCUSSION
PVHSIM1 neurons are critical for the regulation of satiety and prevention of obesity. In this study we demonstrate that PVHMC4R neurons account for only ~50% of PVHSIM1 neuron-mediated satiety and obesity prevention, and identify the missing component. We find that PVHPDYN neurons are a novel SIM1-positive, MC4R-negative satiety population that receive input from ARCAgRP neurons and that together with PVHMC4R neurons they comprise the totality of PVHSIM1 neuron-mediated satiety. Furthermore, PVHPDYN neurons are necessary for restraining weight gain to the same degree as, but independently from, PVHMC4R neurons. Thus, PVHPDYN and PVHMC4R neurons additively comprise the majority of PVH’s capacity for obesity prevention. However, while PVHPDYN and PVHMC4R neurons both regulate satiety via parallel projections to the parabrachial complex (PB), they synaptically engage distinct effector nodes, the pLC and cLPBN, respectively.
The activity of satiety neurons correlates with caloric state. This property, demonstrated by all known satiety neurons, including PVHMC4R, ARCPOMC and ARCVglut2/OxtR neurons (Betley et al., 2015; Chen et al., 2015; Fenselau et al., 2017; Garfield et al., 2015; Liu et al., 2012; Mandelblat-Cerf et al., 2015), is also shared by PB-projecting PVHPDYN neurons. Caloric state information is transmitted to the brain via both the humoral and visceral interoceptive sensory pathways which engage a network of downstream effector populations that ultimately control feeding behavior (Andermann and Lowell, 2017). The ARCAgRP➔PVH circuit is one main pathway by which first-order, humoral interoceptive ARCAgRP neurons drive homeostatic feeding (Atasoy et al., 2012; Garfield et al., 2015). Both pLC-projecting PVHPDYN neurons (Fig 4H) and PVHMC4R neurons (Garfield et al., 2015) are second-order neurons in this network. They receive ARCAgRP input that is high-fidelity (90% and 88% connectivity, respectively), and highly selective (compared to little connectivity from ARCAgRP➔PVH non-satiety neurons) (Garfield et al., 2015; Krashes et al., 2014). Interestingly, concomitant inhibition of PVHMC4R and PVHPDYN neurons (Fig 1F,G) matches the magnitude of hyperphagia caused by ARCAgRP neuron activation (Aponte et al., 2011; Krashes et al., 2011). Thus, these two PVH satiety populations are the main second-order effector neurons engaged by the ARCAgRP➔PVH circuit to cause feeding.
Consistent with their activation by caloric sufficiency, silencing of PVHPDYN neurons promotes food consumption in calorically replete mice, to an extent comparable to that seen when PVHMC4R neurons are inhibited (Fig 1 F-G). This provides compelling evidence that PVHPDYN neurons play a physiological role in satiety maintenance during sated states of ad libitum feeding similar to PVHMC4R neurons. The additive nature of hyperphagia observed with concomitant inhibition of both PVH satiety populations confirms their segregation as two functionally independent, non-overlapping satiety populations. Meanwhile the magnitude of this additive hyperphagia matches that caused by PVHSIM1 neuron inhibition, suggesting that together, PVHPDYN neurons and PVHMC4R neurons make up the vast majority, if not the totality of all PVH satiety neurons. In agreement with the additive satiety effect, chronic loss of function of these two populations resulted in an additive elevation in body weight (Fig 2). These findings imply that PVHPDYN neurons are independent from, but as important as PVHMC4R neurons for preventing obesity. Together, chronic inhibition or ablation of both PVHPDYN and PVHMC4R neurons causes a level of obesity similar to ablating all SIM1 neurons (Xi et al., 2012). The role of a recently characterized population of PVHGLP1R neurons highlights that they too bi-directionally regulate homeostatic feeding and bodyweight (Li et al., 2018), however, their overlap with PVHMC4R neurons means that at present it is uncertain what independent role they play in PVHSIM1 regulated satiety.
Both PVHPDYN and PVHMC4R satiety populations, unlike PVH non-satiety neurons, share a common projection profile in the pLC and cLPBN compartments of the PB (Fig 3A,B, Fig S3D-I). Several key pieces of data from our study provide strong evidence that PVHPDYN neurons primarily regulate satiety via their PB projection. First, gain and loss of function of the PVHPDYN➔PB projection bidirectionally controls food intake. Moreover, the hyperphagia observed from PVHPDYN➔PB optogenetic terminal inhibition is equal in magnitude to hyperphagia from chemogenetic inhibition of all PVHPDYN neurons (Fig 5D-F vs. Fig 2D-G), suggesting that this projection accounts for a majority of the satiety phenotype of this population. Second, given the importance of glutamatergic signaling in PVH neuron- and PVHMC4R neuron-mediated satiety (Shah et al., 2014; Xu et al., 2013a), the high excitatory connectivity in the PVHPDYN➔pLC projection (37%) (Fig 3G) compared PVHPDYN projections to all other brain sites (Fig S3Q) suggests that PVHPDYN neurons regulate satiety via the pLC. Finally, the preferential inhibitory connectivity between ARCAgRP neurons to PB-projecting PVHPDYN neurons versus all other PVHPDYN neurons (Fig 4F-J) suggests that the PB projection may be a key regulator of satiety. While the theoretical possibility that PVHPDYN neuron projections to other regions also contribute to the satiety exists, our data collectively suggest that they are unlikely to be major contributors. In support of our data, PVHMC4R neurons, which have almost identical projections, exclusively regulate satiety via their projections to the PB (Garfield et al., 2015). Furthermore, studies using stereotaxic methods (Kirchgessner and Sclafani, 1988) and terminal chemogenetic inhibition of PVHSIM neurons (Stachniak et al., 2014) indicate that the PVH regulates satiety almost exclusively via projections to the hindbrain.
Strong evidence suggests that the PVHPDYN➔pLC and PVHMC4R➔cLPBN circuits are separate and parallel, engaging different downstream populations to regulate satiety. Although optogenetic experiments do not have the spatial resolution to separately interrogate these adjacent projections (using standard calculations of light spread within the brain (https://web.stanford.edu/group/dlab/cgi-bin/graph/chart.php)), our CRACM data reveal two non-overlapping circuits with distinct sites of action. Specifically, the two satiety circuits have divergent glutamatergic signaling in the PB (Fig 3F-I). Given the importance of glutamatergic signaling for PVH mediated satiety (Xu et al., 2013b), the two circuits likely engage separate downstream populations to functionally cause satiety. Moreover, ARCAgRP neurons provide preferential input to pLC-projecting (90%) vs. LPBN-projecting (12.5%) PVHPDYN neurons (Fig 4H,I). These data support the existence of two co-functional but distinct PVH➔PB satiety circuits downstream of the first-order ARCAgRP neurons. Given that satiety is a complex phenotype comprised of behavioral, physiological and emotional components, the differential contributions of each satiety circuit to the total phenotype will be a key question for future study.
Given the anatomical proximity and functional similarity of the two PVH satiety circuits, the question of potential cross-talk or synergistic action to regulate satiety may arise. However, the functional additivity and divergent synaptic connectivity within the PB of these two PVH satiety populations strongly suggests functional segregation. If such cross-talk were to exist, perhaps other signaling molecules besides glutamate are involved. One possibility is that the PVHPDYN➔PB circuit may use dynorphin/ Kappa opioid receptor (KOR) Gi-coupled signaling in addition to glutamatergic signaling in the PB, not to enhance the excitation of second order satiety neurons in the PB, but rather to inhibit downstream neurons that compete with satiety. Indeed dynorphin/KOR is known to play a role in presynaptic inhibition in other circuits (Kreibich et al., 2008; Li et al., 2012; Tejeda et al., 2017) and KOR expressing neurons exist within the PB (Cai et al., 2016). However, the role of dynorphin/KOR signaling in satiety regulation is presently unclear (Morales et al., 2016; Nogueiras et al., 2012). Nevertheless, dynorphin modulating satiety in this circuit is just one of many possible hypotheses. Elucidating the full complement of non-fast transmitter signaling molecules that may play some role in this pathway may be a subject of future investigations.
The pLC (previously also called pre-LC) is a recently demarked neuroanatomical region that may be considered a component of the PB complex, a viscero-sensory relay for multiple modalities of interoceptive information from the peripheral organs to the brain (Campos et al., 2017; 2016; Flak et al., 2014; Garfield et al., 2014; Geerling et al., 2016; Missig et al., 2014; Rosen et al., 2011). Specifically, the pLC is ontologically closer to the PB than the LC (locus coeruleus) based on neurochemical identity and wiring. The pLC does not express TH (Tyrosine hydroxylase) like its neighbor LC, but rather expresses FOXP2 (Forkhead box protein P2) a transcriptional factor shared by several other PB nuclei (Geerling et al., 2011). The pLC also shares similar inputs with many PB nuclei including the nucleus of the solitary tract (NTS) (Geerling et al., 2006, Herbert et al., 1990) and the PVH (Geerling et al., 2010, Herbert et al., 2000) as well as efferent targets (e.g. BNST, midline thalamus, LH, PVH and DMH) (Shin et al., 2011, Saper and Loewy, 1980, Fulwiler and Saper., 1984). Previously, the pLC was identified in studies investigating sodium appetite (Geerling et al., 2006; 2011, Jarvie et al., 2016, Resch et al., 2017). Our findings here expand the role of the pLC to include the regulation of feeding behavior.
We demonstrate that two PVH satiety populations innervate and synapse specifically onto neurons in the the pLC and cLPBN compartments of the PB, unlike PVH non-satiety neuron subtypes, which avoid these regions (Fig S3D-I). These data also suggest that PB effector neurons downstream of PVH homeostatic satiety neurons do not overlap with eLPBNCGRP neurons (external lateral parabrachial nucleus neurons expressing calcitonin gene related peptide), which are known to relay signals of gut fullness and visceral malaise. The two pathways are functionally distinct: pLC/cLPBN control homeostatic satiety and total food consumed (hyperphagia upon loss off function in an ad lib state), while eLPBNCGRP neurons control meal pattern but not the amount of food consumed (Campos et al., 2016; 2017; Carter et al., 2015; 2013). Thus, to date, three distinct appetite-regulating pathways have been demarcated in the PB (eLPBNCGRP, cLPBN, pLC), of which only the latter two (downstream of the PVH) provides homeostatic appetite regulation. Thus, the PB serves as a hub where two key pathways for satiety related interoceptive information converge: one from the circulation via the hypothalamus and one from the GI system via the visceral sensory relay, NTS. Future studies are necessary for a comprehensive dissection of the PB’s distinct labeled lines of information that participate in appetite regulation, including detailed interrogation of the two separate homeostatic satiety populations.
For 40 years, the PVH has been implicated as the most important brain nucleus necessary for satiety and bodyweight regulation, yet a complete understanding of the neuronal populations involved has been lacking. Here we extend understanding of PVH-regulated satiety and body weight beyond PVHMC4R neurons by identifying PVHPDYN neurons as a non-overlapping and functionally additive population. This novel satiety population acts with equal potency, but independently of PVHMC4R neurons via distinct efferent circuitry. Together the two PVH populations additively account for the satiety and bodyweight regulating capacity of the PVH. Going forward, it will be important to a gain deeper understanding of how these two distinct PVH satiety circuits work additively to execute all the emotional, behavioral and physiological components that comprise the phenotype of homeostatic satiety. In addition, the discovery of these previously unknown PVHPDYN satiety neurons will provide new opportunities for anti-obesity drug development.
STAR METHODS
CONTACT FOR REAGENT AND RESOURCE SHARING
Further information and requests for resources and reagents should be directed to and will be fulfilled by the Lead Contact, Bradford Lowell (blowell@havard.bidmc.edu).
EXPERIMENTAL MODEL AND SUBJECT DETAILS
Mice
Pdyn-IRES-Cre, Crh-IRES-Cre, Trh-IRES-Cre, Avp-IRES-Cre, Trh-IRES-Cre and Adcyap-IRES-Cre (Krashes et al., 2014), Oxt-RES-Cre (Wu et al., 2012). Agrp-IRES-Cre (Tong et al., 2008), BAC transgenic Pdyn-EGFP (Gong et al., 2003), Mc4r-T2A-Cre (Garfield et al., 2015), Rosa26-Ai9-CAG-LSL-TdTom mice (Madisen et al., 2010) were bred from previous published lines. Sim1-IRES-Cre mice were generated in house using standard protocols for knock in IRES-cre mice. For details, see below under Method Details: “Generation of Sim1-IRES-Cre mice” section. All mice used in experiments were maintained on a mixed genetic background and used in the heterozygous state.
All animal care and experimental procedures were conducted in accordance to guidelines of Institutional Animal Care and Use Committee at Beth Israel Deaconess Medical Center. Mice were housed in a temperature and humidity-controlled room with a 12 hour light-dark cycle (6am/6pm). Unless otherwise specified by experimental procedures, animals were provided with ad libitum access to standard mouse chow (Teklad F6 Rodent Diet 8664; 4.05 kcal g−1, 3.3 kcal g−1 metabolizable energy, 12.5% kcal from fat; Harlan Teklad). Animals were provided ad libitum access to water. Male mice 10–16weeks were used for functional or behavioral experiments and functional experiments. Male and female mice 10–16 weeks were used for histological circuit mapping experiments and 6–12 weeks were used for brain slice electrophysiological experiments.
METHOD DETAILS
Generation of Sim1-IRES-Cre mice
Sim1-IRES-Cre mice were created using standard protocols for generating knock in IRES-cre mice. Specifically, to target IRES-Cre to the Sim1 gene, recombineering techniques were used (Copeland et al., 2001). A PCR amplicon containing an optimized internal ribosome entry sequence (IRES) fused to Cre recombinase (Michael et al., 1999), followed by a FRT-flanked neomycin selection cassette, was first inserted 3 bp after the Sim1 stop codon within a Sim1 BAC genomic clone obtained from a mouse RPCI-22 BAC 129S6/SvEvTac genomic library. The targeting construct containing the Cre and FRT-flanked neomycin selection cassette, along with 4kb of upstream and downstream Sim1 genomic DNA sequence (i.e. the homology arms), was then lifted out from the BAC clone using reverse recombineering. The resulting targeting construct was then transfected into mouse ES cells (W4/129S6, Taconic Farm). Drug-selection was used to enrich for targeted clones, which were then identified by long range PCR, and injected into C57Bl6 blastocysts. Chimeric animals from blastocyst implantation were bred for germline-line transmission of the targeted Sim1 gene. Animals heterozygous for the targeting event were crossed with mice expressing Flp-recombinase in the germline (Harley et al. 2000) to remove neo cassette flanked by FRT sites. More details can be found in prior publications (Tong et al.,2008, Rossi et al., 2011., Wu et al., 2012).
Stereotaxic surgery
Mice 5–10 weeks old were anesthetized with ketamine (100 mg/kg) and xylazine (10mg/kg) cocktail diluted in 0.9% saline. Animals were placed into stereotaxic apparatus (David Kopf 940) under sterile conditions. A small incision was made to expose the skull and hole was drilled at the injection site for injections or optical fiber placement. Standard postoperative care for mice included subcutaneously injected extended release Meloxicam SR (0.5 mg/kg).
Viral or CTB injections
A glass pipette with 20–40 mm tip diameter was inserted into the brain and virus was injected by an air pressure system using picoliter air puffs through a solenoid valve (Clippard EV 24VDC) pulsed by a Grass S48 stimulator to control injection speed (40 nl min−1). A micromanipulator (Grass Technologies, Model S48 Stimulator) was used to control injection speed at 25 nl min−1 and the pipette was withdrawn 5 min after injection. For chemogenetic experiments (both in vivo and for ex-vivo acute brain slice electrophysiology), we used AAV8-hSyn-DIO-hM4Di-mCherry for cre-dependent inhibition or AAV8-hSyn-DIO-hM3Dq-mCherry for cre-dependent activation and finally AAV8-hSyn-hM4Di-mCherry was used for independent activation (University of North Carolina (UNC) Vector Core, Bryan Roth donating PI). For chronic cre-dependent neuronal synaptic silencing, we used AAVDJ-DIO-CMV-eGFP-2a-TeNT or control virus AAVDJ-CMV-DIO-eGFP from Stanford Viral core. For chronic cre-dependent neuronal ablation, we used AAV1-flex-taCasp3-TEVp(Caspase) UNC Viral Core (Nairo Shah, Donating PI) or control virus AAV8-hsyn-DIO-GFP (UNC Core)
For efferent tracing, we used AAV8-EF1α-DIO-Synaptophysin (Syp)-mCherry (made by Dr. Rachel Neve at the Massachusetts Institute of Technology McGovern Institute for Brain Research Viral Vector Core and purchased from Virovek, Inc). For in vivo optogenetic terminal stimulation experiments and ex vivo channelrhodopsin-2 assisted circuit mapping (CRACM) experiments, we used AAV9-EF1α-dflox-ChR2(H134R)mCherry (University of Pennsylvania Vector Core, Karl Deisseroth donating PI). For in vivo optogenetic terminal inhibition experiments, we used AAV8-hSyn-FLEX-ArchT-GFP (UNC Vector Core, Ed Boyden, Donating PI). For fluoroflor control optogenetic experiments, we used AAV9-DIO-EF1α-mCherry/EYFP (UPenn Vector Core, Karl Deisseroth donating PI). For retrolabeling histology experiments, Cholera Toxin-B (0.5mg/mL) (List Technologies) was injected. For retrolabeling for ex vivo brain slice electrophysiology experiments, Cholera Toxin-B, Alexa-Fluor-555 Conjugated (CTB555) (0.5mg/mL) (Life-Technologies) was injected. All AAVs were allowed 4 weeks for expression before experiments were initiated. CTB was injected 4–5 days prior to sacrifice for retrograde transport. Stereotaxic coordinates from Bregma and volumes injected are the following: PVH (AP-0.70, ML +/−0.18, DV-4.70, ~15nL AAV), LPBN (AP −5.30, ML 1.35, DV 3.35, 10nL AAV, 25nL CTB), pLC (AP −5.60, +/− ML 0.90, DV 3.50, 10nL AAV, 25nL CTB), PB (AP −5.45, +/−ML +/−1.10, 50nL CTB). All stereotaxic injection sites were validated under epi-florescence microscopy (for electrophysiology-related studies) or by post hoc histology using immunohistochemistry and imaged on the slide canner (see below under Imaging) (for anatomy and in vivo studies). All ‘misses’ or ‘partial hits’ based on expression of mCherry/GFP reporter were excluded from data analysis unless otherwise specifically noted).
Optic fiber implantation
For in vivo optogenetics, optic fiber implants made from optical fiber (BFH37–200 Multimode, 200 μm diameter core, 0.37NA, Thor Labs) were epoxy glued into zirconia ferrules (LC Ferrule 230uM, Kientec Systems Inc). Optical fibers were implanted over the parabrachial complex (PB) (AP-5.45, ML +/−1.10, DV 3.00). Fibers were fixed to the skull using dental acrylic during surgery the same day as viral injections. Optical fiber placement sites were validated by post hoc histology with immunofluorescence.
Behavioral Food intake and BW Studies
Age matched male mice (10–16 weeks old) were used. Animals were singly housed for at least 1.5 weeks prior to experiment and handled daily to reduce stress response. Studies were conducted in a home-cage environment with ad libitum food and water access.
Chemogenetic Food intake Studies
Animals were subjected to sham injections every other day for 1 week prior to experiment in addition to regular handling. Light-cycle food intake studies began 3 hours after lights on (9am-12pm), when mice are sated. Dark-cycle food intake studies were performed at onset of the dark-cycle (6pm-9pm when mice engage in normal dark-cycle feeding. Food intake was measured at 0, 1, 2, and 3 hour time points.
Each trial consists of a saline treatment day, followed by a CNO (5mg/kg) treatment day. On experiment day, CNO or equal volume saline was injected 15 minutes prior to the first food measurement time point. Animals received a week ‘off’ between trials before another trial was initiated. Each animal’s 2 trials were averaged and data was analyzed.
Specifically for hM4Di studies in Fig 1, each experimental cohort consisted of animals of each genotype: Sim1-IRES-Cre, Mc4r-T2A-Cre, Pdyn-IRES-Cre or Pdyn-IRES-Cre::Mc4r-T2A-Cre to facilitate direction comparisons between the genotypes and prevent between cohort specific confounds. For these studies, approximately 10 experimental cohorts were run each comprising each of the above genotypes to achieve approximately 5–8 mice with bilateral hits per genotype for final analysis.
Statistical Analysis:
For all chemogenetic studies, we used a two-way RM ANOVA across factors “drug treatment” and “time.” Due to cumulative food intake measurements, “time” was always significant. We performed a Sidak’s post-hoc comparison between Saline vs. CNO conditions, within subjects at each hour: 1, 2 and 3 time points of the food intake study. Fig 1G: To focus on comparing magnitudes of hyperphagia between different genotype groups, One way ANOVA was followed by Tukey’s post-hoc comparisons between all genotype groups of the 3 hour cumulative food intake.
Chronic Food intake and Body weight Studies.
Baseline:
Animals were singly housed for 1 week prior to beginning of study and daily food intake/bodyweight monitored to reach a steady state indicating stress from single housing have subsided. Then FI and BW was recorded daily at 9AM for 7 days. The average was taken for “pre-injection” food intake.
Surgeries with AAV injections:
Animals were recombined into their original litter mate cages for group housing for 1 week until stable FI/BW was reached for chronic study. Animals were randomized based on baseline bodyweight into each treatment group.
Control viruses (GFP) or Silencing/Ablation viruses (Caspase or TeNT) were injected bilaterally in the PVH on day 0.
Post injection BW measurements:
After AAV-injections, bodyweight was measured at 9AM either daily (Caspase) for 28 days or bi-weekly (TeNT) or 4.5 weeks.
Post-injection FI measurements:
At the end of the chronic study, animals were singly housed in order to measure food intake. Animals were first singly housed for 1 week for and BW/FW monitored daily to achieve a steady state indicating that the stress of singly housing have subsided. Then FI was measured daily for 7 days and the average taken for “Post injection FI”
Statistical Analysis:
For food intake statistical analysis was performed via an 2Way ANOVA test for both “time= post vs. pre-injection” and “treatment” (control GFP vs. silencing virus). A paired T-test was used to compare “pre-injection” vs. “post injection” in either control GFP and Caspase/TeNT groups. For Body weight experiments, data was analyzed to compare multiple factors: time after injection, treatment, and genotype (only in the case of TeNT experiment across multiple genotypes). In the caspase experiment where only PDYN neurons were ablated, Sidak’s multiple comparisons were used to isolate effects of “time after injection” to analyze the progression of obesity after treatment with either GFP or Caspase virus. In the TeNT experiment, we used Sidak’s multiple comparisons test to 1) determine the time after injection for obesity onset for each genotype group and 2) importantly, compared the magnitude of obesity in the MC4R vs. PDYN vs. PDYN+MC4R vs. GFP control groups at the endpoint of the study at 4.5 weeks.
Optogenetic Food intake Studies
Animals were acclimated to being attached to patchcords every other day for 1 week prior to experiment in addition to regular handling. Light-cycle food intake studies began 3 hours into the light cycle, when mice are sated. Dark-cycle food intake studies were performed at onset of the dark-cycle when mice engage in normal dark-cycle feeding. Food intake was measured at 0, 1, 2, and 3 hour time points. Animals received a week ‘off’ between trials before another trial was initiated. For each animal, trials (2 per treatment) were averaged and data was analyzed.
Each trial consists of a light off treatment day followed by a light on treatment day. One hour before experiments, mice were attached to optical fiber patch chords (1m long, 200um core, 0.63 NA, Doric Lenses) for acclimation. The light stimulation protocol was controlled via LabView software and a National Instruments NIDAQ board through TTL pulses. The light stimulation protocol began immediately before the onset of the first food measurement and continued for the 3 hour duration of each food intake trial. For ChR2 terminal stimulation experiments: blue 563nm light was delivered via LEDs (Plexbright) with light power of ~7–9mW at the fiber tip using the stimulation protocol (20Hz, 10ms pulses, 5s on 2s off) previously described to activate PVHMC4R neurons to produce a satiety phenotype (Garfield et al., 2015). During light on trials, protocol was repeated for the duration of the 3 hour trial. For ArchT terminal inhibition experiments: Green 532nm light was delivered via lasers (Shanghai Century Lasers) with light power of ~10–12mW at the fiber tip using the following stimulation protocol (Constant light, 20s on, 10s off) as previously described (Anthony et al., 2014). During light on trials, we alternated 10 minute epochs of lights on and off for the duration of the 3 hour trial, to prevent overheating brain tissue (since constant light emission is required for continuous optogenetic inhibition). Light irradiance at the PB was estimated to be ~10mW/mm2 for blue light and 12mW/mm2 for green light as calculated by the light transmission calculator at http://web.stanford.edu/group/dlab/cgi-bin/graph/chart.php. During one of the two trials, recordings of food intake behaviors were performed using overhead USB cameras (Logitech 910B) and scored visually across 3 hours of the light off trial vs. light on trial. Time engaged in food consumption was defined as animals actively engaged in biting, chewing, swallowing food.
Statistical Analysis:
For all optogenetic food intake studies, we used a 2 Way RM ANOVA for “light treatment” and “time.” Due to the nature of cumulative food intake measurements, “time” was always significant. We performed a Sidak’s post-hoc comparison between Light off vs. Light treatment conditions within subjects at each hour: 1, 2 and 3 time points of the food intake study. Additionally, from video recordings, each parameter of food intake was analyzed using a paired T-test comparing between light on vs light off conditions within subjects.
Histological Validation of Hits for all behavioral studies
Only animals that were “hits” with bilateral histologically validated expression of control fluorophore or transgene of interest in the target area (PVH) were used in data analysis. Cases with expression in other brain regions were omitted unless otherwise noted, such as for subtractive comparison in Fig 5. For optogenetic experiments, only animals with bilateral anatomically correct optical fiber placements (for optogenetic experiments) were included in analysis.
Histology, Immunohistochemistry and Imaging
Mice were terminally anesthetized with chloral hydrate 500mg/kg (Sigma Aldrich) and transcardially perfused with 0.1 M phosphate-buffered saline (PBS) followed by 10% neutral buffered formalin (Fisher Scientific). Brains were extracted, post-fixed overnight in above formalin at 4° C, cryoprotected overnight in 20% sucrose at 4°C, and sectioned coronally on a freezing sliding microtome (Leica Biosystems) at 30μm and collected in four equal series.
Immunohistochemistry
Brain sections were washed in 0.1 M PBS, blocked in 3% normal donkey serum/0.25% Triton X-100 in PBS for 1 hour at room temperature and then incubated overnight at room temperature in blocking solution containing primary antiserum. Primary antibodies used were Rat anti-mCherry 1:1,000 (Life Technologies), Rabbit anti-GFP 1:1,000 (Life Technologies), 1:1000 Rabbit anti-CRF (Thermo-Fisher), 1:1,000, Mouse anti-Tyrosine Hydroxylase (TH) LNC1 1:1,000 (EMD Millipore), Goat anti-Choline Acetyltransferase (ChAT)1:1000 (EMD Millipore), Rabbit anti-Calcitonin gene-related peptide (CGRP) 1:1000 (Peninsula), Rabbit anti-FOS 1:1,000 (EMD Millipore), Goat-anti Cholera Toxin B (CTB) 1:1,000 (List Technologies). The next morning sections were washed 3X PBS and then incubated in Alexa Fluor Donkey secondary antibody 1:1000 (Molecular Probes) diluted in blocking solution for 2 h at room temperature. The ChAT antibody also requires an antigen retrieval step: 30min incubation at 60°C in sodium citrate buffer prior to primary antibody incubation. Sections were washed 3× in PBS, mounted onto gelatin subbed slides, and cover-slipped with DAPI-Vectashield mounting media (Vector Labs).
Imaging
Fluorescent images were captured using an Olympus VS120 slide-scanning microscope at 10X for anatomical tracing studies or histological validation of behavioral studies and at 20X for pLC FOS quantification studies. For cell type co-localization studies in the PVH or FOS quantification in the PVH, images were captured using a Zeiss LSM510 confocal microscope using a 20X air lens. For each 30um thick section, 15 optical sections at 2um thickness was acquired.
FOS analysis across caloric states in PVHPDYN and pLC
To analyze neuronal activation under states of caloric deficiency vs. sufficiency, aged matched male mice were assigned to the fasted or refed group. Mice had been handled for 7 consecutive days before the assay to reduce stress response. Food was removed from home cages at the onset of the dark cycle for a 16 hour overnight fast. Half the animals were sacrificed the following morning in calorically deficient state (Fasted Group). The second half of the same cohort of animals were given food for 2 hours the following morning prior to sacrifice (Fed Group). Mice were transcardially perfused and brain tissue processed as described above. Immunochemistry for FOS protein was performed in parallel for both fasted and refed groups. The exact same image acquisition parameters were kept constant for both fasted and refed mice and slides from each group were imaged in parallel. ImageJ was used for analysis with no extra adjustment or image processing for purposes of FOS quantification. For FOS quantification studies, we used a 2 way RM ANOVA across “caloric state” and “anatomical section” (the repeated variable). A paired Sidak’s post-hoc comparison between Fed vs. Fasted groups at each anatomical section of the structure of interest was performed.
In PB-projecting PVHPDYN neurons:
Pdyn-IRES-Cre::Ai9-Rosa26-LSL-TdTom mice that received CTB injections in the PB 5 days prior to experiment were divided into two groups (n=4 fasted group n=5 refed group). To ascertain co-localization of FOS-IR with pDYN::TdTOM+, CTB+ PB-projecting PVHPDYN neurons, the PVH was imaged at 20X using triple channel confocal microscopy as described above. We manually counted FOS positive neurons across 3 rostral-caudal sections of the PVH for each mouse by marking each neuron in ImageJ in each channel and then using image calculator to overlay channels.
In pLC neurons with the PVHPDYN ➔pLC projection field
Pdyn-IRES-Cre mice were injected with AAV-DIO-Syp-mCherry injections 4 weeks prior to experiment to mark the axon projection field. Mice were divided into two groups (n=5 fasted group n=5 refed group). Images were acquired at 20x using an Olympus VS120 slide-scanning microscope. In ImageJ, Syp-mcherry marked projection fields were defined by ROIs and FOS+ neurons were counted within those ROIs across 3 rostra-caudal sections for the pLC for each mouse.
Electrophysiology
Brain slices were prepared from 6–10-weeks-old mice. Mice were anaesthetised with isoflurane before rapid decapitation and subsequent brain removal. Brains were immediately submerged in ice-cold, carbogen-saturated (95% O2, 5% CO2) sucrose solution (72 sucrose, 83 NaCl, 2.5 KCl, 1 NaH2PO4, 26 NaHCO3, 22 glucose, 5 MgCl2, 1 CaCl2). Then, 300-μM thick coronal sections were cut with a Leica VT1000S Vibratome and the slices were then incubated in oxygenated aCSF (126 mM NaCl, 21.4 mM NaHCO3, 2.5 mM KCl, 1.2 mM NaH2PO4, 1.2 mM MgCl2, 2.4 mM CaCl2, 10 mM glucose) at 34 °C for 30 min. Slices were allowed to recover for 1 hr in room temperature aCSF. A single slice was then placed in the recording chamber where it was continuously superfused at a rate of 3–4 ml per min with room temperature (20–24 °C) oxygenated aCSF. Neurons were visualized with an upright microscope equipped with infrared-differential interference contrast and fluorescence optics. Borosilicate glass microelectrodes (5–7 MΩ) were filled with internal solution.
Channelrhodopsin-assisted circuit mapping (CRACM)
For CRACM, photostimulation-evoked responses were recorded using a Cs+ based, low Cl− internal solution consisting of (in mM): 135 CsMeSO3, 10 HEPES, 1 EGTA, 4 MgCl2, 4 Na2-ATP, 0.4 Na2-GTP, 10 Na2-phosphocreatine (pH 7.3 adjusted with CsOH; 295 mOsm · kg−1; ECl = −70 mV). Light-evoked EPSCs and IPSCs were recorded in whole-cell voltage clamp mode with the membrane potential clamped at Vh = −70 mV and 0 mV, respectively. CNQX and D-AP5 or bicuculline were included to isolate glutamatergic/GABAergic currents as needed. A laser or LED light source (473 nm; Opto Engine; Thorlabs) was used to evoke ChR2-mediated responses. The light output was controlled by a programmable pulse stimulator, Master-8 (A.M.P.I.) and pClamp 10.2 software (Axon Instruments). Photostimulation-evoked EPSCs/IPSCs detection protocol consisted of 4X 5msec blue light laser pulses administered 1s apart during and 8 second sweep, repeated for a total of 30 sweeps. Evoked EPSCs with short latency (≤6 ms) upon light stimulation were considered as light-driven. As discussed by others (Petreanu et al., 2007), such currents are most likely monosynaptic. TTX 5uM was applied in several cells to demonstrate definitive monosynaptic connectivity.
Electrophysiological validation of CNO
For electrophysiological validation of CNO effects on Hm4Di expressing neurons, neurons were recorded in the whole cell current clamp mode in the presence of synaptic blockers picrotoxin and kynurenic acid. The intracellular solution for current clamp recordings contained the following (in mM): 128 K gluconate, 10 KCl, 10 HEPES, 1 EGTA, 1 MgCl2, 0.3 CaCl2, 5 Na2ATP, 0.3 NaGTP, adjusted to pH 7.3 with KOH. After acquisition of stable whole-cell recordings for 2–5 min, aCSF solution containing 5 μM CNO was perfused into the brain slice preparation.
Analysis of Recordings
All recordings were made using a Multiclamp 700B amplifier (Molecular Devices), and data were filtered at 2 kHz and digitized at 10 or 20 kHz. Access resistance (<30 MΩ) was continuously monitored by a voltage step and recordings were accepted for analysis if changes were <15%. All recordings were analyzed offline using Clampfit 10 (Molecular Devices),
QUANTIFICATION AND STATISTICAL ANALYSIS
Statistical analysis was performed with Prism 6 (GraphPad) software in all cases. Electrophysiological traces were analyzed on Clamp fit 10 (Molecular Devices) and Origin (Origin Lab) software. Specific statistical tests are specified in the sections above for each experiment as well as in the figure legends. All data presented met the assumptions of the statistical test used. Animals were excluded from analysis if histological validation revealed poor or inaccurate reporter expression or inaccurate fiber placement unless otherwise noted. N values reflect the final number of validated animals per group included in the analysis.
Supplementary Material
KEY RESOURCES TABLE.
| REAGENT or RESOURCE | SOURCE | IDENTIFIER |
|---|---|---|
| Antibodies | ||
| Rabbit anti-CGRP | Peninsula Laboratories | Cat #: T-4032; RRID: AB_2313775 |
| Rabbit anti-c-FOS | EMD Millipore | Cat #: ABE457; RRID: AB_2631318 |
| Rabbit anti-GFP | Invitrogen | Cat #: A10262; RRID: AB_2534023 |
| Rat anti-mCherry | Invitrogen | Cat #: M11217; RRID: AB_2536611 |
| Mouse anti-Tyrosine Hydroxylase (TH) LNC1 | EMD Millipore | Millipore Cat # MAB318, RRID:AB_2201528 |
| Goat anti-Choline Acetyl Transferase (ChAT) | EMD Millipore | Cat #: AB144P; RRID:AB_2079751 |
| Rabbit anti-CRF | Thermo Fisher Scientific | Cat# PA1-33008, RRID:AB_19569 |
| Goat anti-Cholera Toxin B | List Biological | List Biological Cat # 703, RRID:AB_10013220 |
| Donkey anti-Rabbit IgG, secondary antibody, Alexa 488 Conjugate | Invitrogen | Cat #: A-21206; RRID:AB_2535792 |
| Goat anti-Chicken IgG secondary antibody, Alexa 488 conjugate | Invitrogen | Cat #: A-11039; RRID: AB_2534096 |
| Donkey anti-Rat IgG, secondary antibody, Alexa 594 Conjugate | Invitrogen | Cat #: A-21209; RRID: AB_2535795 |
| Donkey anti-Goat IgG, secondary antibody, Alexa 647 Conjugate | Invitrogen | Cat# A-21447, RRID:AB_2535864 |
| Donkey anti-Rabbit, secondary antibody, Alexa 647 Conjugate | Thermo Fisher Scientific | Cat# A-31573 RRID:AB_2536183 |
| Bacterial and Virus Strains | ||
| AAV8-hSyn-DIO-hM4Di-mCherry | UNC Vector Core | Addgene 44362 |
| AV8-hSyn-DIO-hM3Dq-mCherry | UNC Vector Core | Addgene 44361 |
| AAVDJ-CMV-DIO-eGFP-2A-TeNT | Stanford Vector Core | N/A |
| AAVDJ-CMV-DIO-eGFP | Stanford Vector Core | N/A |
| AAV1-EF1a-FLEX-taCasp3-TEVp | UNC Vector Core | Addgene: 45580 |
| AAV8-DIO-hSyn-EGFP | UNC Vector Core | Addgene: 50457 |
| AAV9-EF1a-double floxed-hChR2(H134R)-mCherry | Penn Vector Core | Addgene 20297 |
| AAV8-FLEX-ArchT-GFP | UNC Vector Core | Addgene: 28407 |
| AAV8-Ef1a-DIO-synaptophysin (Syp)-mCherry | MIT Vector Core | N/A |
| AAV9-EF1a-double floxed-mCherry | Upenn Vector Core | Addgene 20299 |
| AAV9-EF1a-double floxed-EYFP | Upenn Vector Core | Addgene 20298 |
| AAV8-hM4Di-mCherry | UNC Vector Core | Addgene 50479 |
| Chemicals, Peptides, and Recombinant Proteins | ||
| Clozapine-N-Oxide (CNO) | NIMH Drug Supply | Program Cat #: C929 |
| CNQX | Tocris | Cat# 0190 |
| D-AP5 | Tocris | Cat #: 0106 |
| Kynurenic Acid | Sigma-Aldrich | Cat #: K3375–5G |
| Picrotoxin | Tocris | Cat #: 1128 |
| Bicuculline | Tocris | Cat #: 2503 |
| TTX | Tocris | Cat #: 1069 |
| Cholera Toxin B Subunit (Choleragenoid) from Vibrio cholerae in Low Salt | List Biological Laboratories | Cat#104 |
| Cholera Toxin B Subunit B (Recombinant), Alexa Fluor 555 Conjugate | Thermo Fisher | Cat#34776 |
| Experimental Models: Cell Lines | ||
| W4/129S6 | Taconic Farm | Cat#129SVE |
| Experimental Models: Organisms/Strains | ||
| Mouse/Pdyn-IRES-Cre B6;129S-Pdyntm1.1(cre)Mjkr/LowlJ Mus musculus | Jackson Laboratory; Krashes et al, 2014 | (IMSR Cat# JAX:027958, RRID:IMSR_JAX:027958) |
| Mouse/Mc4r-T2A-Cre STOCK Mc4rtm3.1(cre)Lowl/J Mus musculus | Jackson Laboratory; Garfield et al, 2015 | (IMSR Cat# JAX:030759, RRID:IMSR_JAX:030759) |
| Mouse/Sim1-IRES-Cre | This Paper | N/A |
| Mouse/Agrp-IRES-Cre STOCK Agrptm1(cre)Lowl/J Mus musculus | Jackson Laboratory; Tong et al., 2008 | IMSR Cat# JAX:012899, RRID:IMSR_JAX:012899) |
| Mouse/Ai9(lox)-tdTomato B6.Cg-Gt(ROSA)26Sortm9(CAG-tdTomato)Hze/J Mus musculus | Jackson Laboratory; Madisen et al., 2010 | (IMSR Cat# JAX:007909, RRID:IMSR_JAX:007909) |
| Mouse/PDYN-EGFP STOCK Tg(Pdyn-EGFP)BD193Gsat/Mmnc | MMRRC; Gong et al., 2003 | Cat# 000240-UNC, RRID:MMRRC_000240-UNC |
| Mouse/Trh-IRES-Cre B6;129S-Trhtm1.1(cre)Mjkr/LowlJ | Jackson Laboratory; Krashes et. al 2014 | IMSR Cat# JAX:032468, RRID:IMSR_JAX:032468 |
| Mouse/Crh-IRES-Cre | Lowell Lab; Krashes et. al 2014 | N/A |
| Mouse/Oxy-IRES-Cre B6;129S-Oxttm1.1(cre)Dolsn/J Mus musculus | Jackson Laboratory; Wu et al. 2012 | (IMSR Cat# JAX:024234, RRID:IMSR_JAX:024234) |
| Mouse/AVP-IRES-Cre Avptm1.1(cre)Dolsn | Lowell Lab; Krashes et. al 2014 | N/A |
| Mouse/PACAP-IRES-Cre Adcyap1tm1.1(cre)Mjkr | Lowell Lab; Krashes et. al 2014 | N/A |
| Mouse/Flpe Deleter (FLPeR/ROSA26::FLPe) B6N.129S4-Gt(ROSA)26Sortm1(FLP1)Dym/J | Jackson Laboratory Farley et al., 2000 | MSR Cat# JAX:016226, RRID:IMSR_JAX:016226 |
Highlights:
PVH neurons cause satiety, of which ~50% is accounted for by PVHMC4R neurons.
PVHPDYN neurons are identified as novel satiety neurons that prevent obesity.
PVHPDYN & PVHMC4R neurons are distinct & equipotent, producing additive effects.
PVHPDYN & PVHMC4R neurons use separate efferent circuits to regulate appetite.
ACKNOWLEDGEMENTS
We would like to thank: Drs. Joel Geerling, and Christian Burgess for helpful discussions. Jia Yu and Dr. Linh Vong, the BNORC and BADERC Transgenic Cores for assistance in generating cre-driver mouse lines. Dr. Chen Wu for assistance with sequencing of mouse lines. Dr. Natalia Machado for consultation about energy expenditure and thermoregulation. Yanfang Li and Zongfang Yang for technical Assistance. Ella Douglas, Vignesh Chander, Sean Hawkins and Lauren Shin for assistance on histology and animal behavior. The BIDMC Molecular Medicine Core for sequencing facilities and helpful discussions. Dr. Rachael Neve and the MIT McGovern Institute for Brain Research Viral Core for the DIO-Syp-mCherry virus. BIDMC Confocal Imaging Core for confocal microscopy facilities. This research was funded by the following NIH grants to B.B.L.: R01 DK075632, R01 DK096010, R01 DK089044, R01 DK111401, P30 DK046200, P30 DK057521; to A.S.G. University of Edinburgh Chancellor’s Fellowship, to J.M.R.: F32 DK103387; to J.N.C.: AHA Postdoctoral Fellowship 14POST20100011.
Footnotes
DECLARATION OF INTERESTS
The authors declare no competing interests.
Publisher's Disclaimer: This is a PDF file of an unedited manuscript that has been accepted for publication. As a service to our customers we are providing this early version of the manuscript. The manuscript will undergo copyediting, typesetting, and review of the resulting proof before it is published in its final citable form. Please note that during the production process errors may be discovered which could affect the content, and all legal disclaimers that apply to the journal pertain.
REFERENCES
- An JJ, Liao G-Y, Kinney CE, Sahibzada N, and Xu B (2015). Discrete BDNF Neurons in the Paraventricular Hypothalamus Control Feeding and Energy Expenditure. Cell Metab. 22, 175–188. [DOI] [PMC free article] [PubMed] [Google Scholar]
- Andermann ML, and Lowell BB (2017). Toward a Wiring Diagram Understanding of Appetite Control. Neuron 95, 757–778. [DOI] [PMC free article] [PubMed] [Google Scholar]
- Anthony TE, Dee N, Bernard A, Lerchner W, Heintz N, and Anderson DJ (2014). Control of stress-induced persistent anxiety by an extra-amygdala septohypothalamic circuit. Cell 156, 522–536. [DOI] [PMC free article] [PubMed] [Google Scholar]
- Aponte Y, Atasoy D, and Sternson SM (2011a). AGRP neurons are sufficient to orchestrate feeding behavior rapidly and without training. Nature Publishing Group; 14, 351–355. [DOI] [PMC free article] [PubMed] [Google Scholar]
- Atasoy D, Betley JN, Su HH, and Sternson SM (2012). Deconstruction of a neural circuit for hunger. Nature 488, 172–177. [DOI] [PMC free article] [PubMed] [Google Scholar]
- Balthasar N, Dalgaard LT, Lee CE, Yu J, Funahashi H, Williams T, Ferreira M, Tang V, McGovern RA, Kenny CD, et al. (2005). Divergence of melanocortin pathways in the control of food intake and energy expenditure. Cell 123, 493–505. [DOI] [PubMed] [Google Scholar]
- Betley JN, Xu S, Cao ZFH, Gong R, Magnus CJ, Yu Y, and Sternson SM (2015). Neurons for hunger and thirst transmit a negative-valence teaching signal. Nature 521, 180–185. [DOI] [PMC free article] [PubMed] [Google Scholar]
- Cai X, Huang H, Kuzirian MS, Snyder LM, Matsushita M, Lee MC, Ferguson C, Homanics GE, Barth AL, and Ross SE (2016). Generation of a KOR-Cre knockin mouse strain to study cells involved in kappa opioid signaling. Genesis 54, 29–37. [DOI] [PMC free article] [PubMed] [Google Scholar]
- Campos CA, Bowen AJ, Han S, Wisse BE, Palmiter RD, and Schwartz MW (2017). Cancer-induced anorexia and malaise are mediated by CGRP neurons in the parabrachial nucleus. Nature Publishing Group; 20, 934–942. [DOI] [PMC free article] [PubMed] [Google Scholar]
- Campos CA, Bowen AJ, Schwartz MW, and Palmiter RD (2016). Parabrachial CGRP Neurons Control Meal Termination. Cell Metab. 23, 811–820. [DOI] [PMC free article] [PubMed] [Google Scholar]
- Carter ME, Han S, and Palmiter RD (2015). Parabrachial calcitonin gene-related peptide neurons mediate conditioned taste aversion. J. Neurosci 35, 4582–4586. [DOI] [PMC free article] [PubMed] [Google Scholar]
- Carter ME, Soden ME, Zweifel LS, and Palmiter RD (2013). Genetic identification of a neural circuit that suppresses appetite. Nature 503, 111–114. [DOI] [PMC free article] [PubMed] [Google Scholar]
- Chen Y, Lin Y-C, Kuo T-W, and Knight ZA (2015). Sensory detection of food rapidly modulates arcuate feeding circuits. Cell 160, 829–841. [DOI] [PMC free article] [PubMed] [Google Scholar]
- Copeland NG, Jenkins NA, Court DL (2001). Recombineering: a powerful new tool for mouse functional genomics. Nature Review Genetics 2, 769–779. [DOI] [PubMed] [Google Scholar]
- D’Agostino G, Lyons DJ, Cristiano C, Burke LK, Madara JC, Campbell JN, Garcia AP, Land BB, Lowell BB, Dileone RJ, et al. (2016a). Appetite controlled by a cholecystokinin nucleus of the solitary tract to hypothalamus neurocircuit. eLife 5, 27. [DOI] [PMC free article] [PubMed] [Google Scholar]
- Farley FW, Soriano P, Steffen LS, Dymecki SM Widespread recombinase expression using FLPeR (flipper) mice. Genesis 28, 106–110. [PubMed] [Google Scholar]
- Fenselau H, Campbell JN, Verstegen AMJ, Madara JC, Xu J, Shah BP, Resch JM, Yang Z, Mandelblat-Cerf Y, Livneh Y, et al. (2017). A rapidly acting glutamatergic ARC→PVH satiety circuit postsynaptically regulated by α-MSH. Nature Publishing Group; 20, 42–51. [DOI] [PMC free article] [PubMed] [Google Scholar]
- Flak JN, and Myers MG (2016). Minireview: CNS Mechanisms of Leptin Action. Mol. Endocrinol 30, 3–12. [DOI] [PMC free article] [PubMed] [Google Scholar]
- Flak JN, Patterson CM, Garfield AS, D’Agostino G, Goforth PB, Sutton AK, Malec PA, Wong J-MT, Germani M, Jones JC, et al. (2014). Leptin-inhibited PBN neurons enhance responses to hypoglycemia in negative energy balance. Nature Publishing Group; 17, 1744–1750. [DOI] [PMC free article] [PubMed] [Google Scholar]
- Garfield AS, Li C, Madara JC, Shah BP, Webber E, Steger JS, Campbell JN, Gavrilova O, Lee CE, Olson DP, et al. (2015). A neural basis for melanocortin-4 receptor-regulated appetite. Nature Publishing Group; 18, 863–871. [DOI] [PMC free article] [PubMed] [Google Scholar]
- Garfield AS, Shah BP, Madara JC, Burke LK, Patterson CM, Flak J, Neve RL, Evans ML, Lowell BB, Myers MG, et al. (2014). A parabrachial-hypothalamic cholecystokinin neurocircuit controls counterregulatory responses to hypoglycemia. Cell Metab. 20, 1030–1037. [DOI] [PMC free article] [PubMed] [Google Scholar]
- Gautron L, Elmquist JK, and Williams KW (2015). Neural control of energy balance: translating circuits to therapies. Cell 161, 133–145. [DOI] [PMC free article] [PubMed] [Google Scholar]
- Geerling JC, Kim M, Mahoney CE, Abbott SBG, Agostinelli LJ, Garfield AS, Krashes MJ, Lowell BB, and Scammell TE (2016). Genetic identity of thermosensory relay neurons in the lateral parabrachial nucleus. Am. J. Physiol. Regul. Integr. Comp. Physiol 310, R41–R54. [DOI] [PMC free article] [PubMed] [Google Scholar]
- Gold RM, Jones AP, and Sawchenko PE (1977). Paraventricular area: critical focus of a longitudinal neurocircuitry mediating food intake. Physiol. Behav 18, 1111–1119. [DOI] [PubMed] [Google Scholar]
- Gong S, Zheng C, Doughty ML, Losos K, Didkovsky N, Schambra UB, Nowak NJ, Joyner A, Leblanc G, Hatten ME, et al. (2003). A gene expression atlas of the central nervous system based on bacterial artificial chromosomes. Nature 425, 917–925. [DOI] [PubMed] [Google Scholar]
- Gropp E, Shanabrough M, Borok E, Xu AW, Janoschek R, Buch T, Plum L, Balthasar N, Hampel B, Waisman A, et al. (2005). Agouti-related peptide-expressing neurons are mandatory for feeding. Nature Neuroscience 8, 1289–1291. [DOI] [PubMed] [Google Scholar]
- Hahn TM, Breininger JF, Baskin DG, and Schwartz MW (1998). Coexpression of Agrp and NPY in fasting-activated hypothalamic neurons. Nature Neuroscience 1, 271–272. [DOI] [PubMed] [Google Scholar]
- Holder JL, Butte NF, and Zinn AR (2000). Profound obesity associated with a balanced translocation that disrupts the SIM1 gene. Hum Mol Genet 9, 101–108. [DOI] [PubMed] [Google Scholar]
- Huszar D, Lynch CA, Fairchild-Huntress V, Dunmore JH, Fang Q, Berkemeier LR, Gu W, Kesterson RA, Boston BA, Cone RD, et al. (1997). Targeted disruption of the melanocortin-4 receptor results in obesity in mice. Cell 88, 131–141. [DOI] [PubMed] [Google Scholar]
- Jennings JH, Rizzi G, Stamatakis AM, Ung RL, and Stuber GD (2013). The inhibitory circuit architecture of the lateral hypothalamus orchestrates feeding. Science 341, 1517–1521. [DOI] [PMC free article] [PubMed] [Google Scholar]
- Kirchgessner AL, and Sclafani A (1988). PVN-hindbrain pathway involved in the hypothalamic hyperphagia-obesity syndrome. Physiol. Behav 42, 517–528. [DOI] [PubMed] [Google Scholar]
- Koch M, Varela L, Kim JG, Kim JD, Hernández-Nuño F, Simonds SE, Castorena CM, Vianna CR, Elmquist JK, Morozov YM, et al. (2015). Hypothalamic POMC neurons promote cannabinoid-induced feeding. Nature 519, 1–20. [DOI] [PMC free article] [PubMed] [Google Scholar]
- Krashes MJ, Koda S, Ye C, Rogan SC, Adams AC, Cusher DS, MaratosFlier E, Roth BL, and Lowell BB (2011). Rapid, reversible activation of AgRP neurons drives feeding behavior in mice. J Clin Invest 121, 1424–1428. [DOI] [PMC free article] [PubMed] [Google Scholar]
- Krashes MJ, Lowell BB, and Garfield AS (2016). Melanocortin-4 receptor-regulated energy homeostasis. Nature Publishing Group; 19, 206–219. [DOI] [PMC free article] [PubMed] [Google Scholar]
- Krashes MJ, Shah BP, Madara JC, Olson DP, Strochlic DE, Garfield AS, Vong L, Pei H, Watabe-Uchida M, Uchida N, et al. (2014). An excitatory paraventricular nucleus to AgRP neuron circuit that drives hunger. Nature 507, 238–242. [DOI] [PMC free article] [PubMed] [Google Scholar]
- Kreibich A, Reyes BAS, Curtis AL, Ecke L, Chavkin C, Van Bockstaele EJ, and Valentino RJ (2008). Presynaptic inhibition of diverse afferents to the locus ceruleus by kappa-opiate receptors: a novel mechanism for regulating the central norepinephrine system. J. Neurosci 28, 6516–6525. [DOI] [PMC free article] [PubMed] [Google Scholar]
- Krude H, Biebermann H, Luck W, Horn R, Brabant G, and Grüters A (1998). Severe early-onset obesity, adrenal insufficiency and red hair pigmentation caused by POMC mutations in humans. Nat. Genet 19, 155–157. [DOI] [PubMed] [Google Scholar]
- Li C, Navarrete J, Liang-Guallpa J, Lu C, Funderburk SC, Chang RB, Liberles SD, Olson DP, and Krashes MJ (2018). Defined Paraventricular Hypothalamic Populations Exhibit Differential Responses to Food Contingent on Caloric State. Cell Metab. [DOI] [PMC free article] [PubMed] [Google Scholar]
- Li C, Pleil KE, Stamatakis AM, Busan S, Vong L, Lowell BB, Stuber GD, and Kash TL (2012). Presynaptic inhibition of gamma-aminobutyric acid release in the bed nucleus of the stria terminalis by kappa opioid receptor signaling. Biol. Psychiatry 71, 725–732. [DOI] [PMC free article] [PubMed] [Google Scholar]
- Liu J, Conde K, Zhang P, Lilascharoen V, Xu Z, Lim BK, Seeley RJ, Zhu JJ, Scott MM, and Pang ZP (2017). Enhanced AMPA Receptor Trafficking Mediates the Anorexigenic Effect of Endogenous Glucagon-like Peptide-1 in the Paraventricular Hypothalamus. Neuron 96, 897–909.e5. [DOI] [PMC free article] [PubMed] [Google Scholar]
- Liu T, Kong D, Shah BP, Ye C, Koda S, Saunders A, Ding JB, Yang Z, Sabatini BL, and Lowell BB (2012). Fasting activation of AgRP neurons requires NMDA receptors and involves spinogenesis and increased excitatory tone. Neuron 73, 511–522. [DOI] [PMC free article] [PubMed] [Google Scholar]
- Luquet S, Perez FA, Hnasko TS, and Palmiter RD (2005). NPY/AgRP neurons are essential for feeding in adult mice but can be ablated in neonates. Science 310, 683–685. [DOI] [PubMed] [Google Scholar]
- Madisen L, Zwingman TA, Sunkin SM, Oh SW, Zariwala HA, Gu H, Ng LL, Palmiter RD, Hawrylycz MJ, Jones AR, et al. (2010). A robust and high-throughput Cre reporting and characterization system for the whole mouse brain. Nature Publishing Group; 13, 133–140. [DOI] [PMC free article] [PubMed] [Google Scholar]
- Mandelblat-Cerf Y, Ramesh RN, Burgess CR, Patella P, Yang Z, Lowell BB, and Andermann ML (2015). Arcuate hypothalamic AgRP and putative POMC neurons show opposite changes in spiking across multiple timescales. eLife 4, 351. [DOI] [PMC free article] [PubMed] [Google Scholar]
- Michael SK, Brennan J, Robertson EJ(1999). Efficient gene-specific expression of Cre-recombinase in the mouse embryo by targeted insertion of novel IRES-Cre- cassette into endogenous loci. Mechanisms of Development 85, 25–47. [DOI] [PubMed] [Google Scholar]
- Michaud JL, Boucher F, Melnyk A, Gauthier F, Goshu E, Lévy E, Mitchell GA, Himms-Hagen J, and Fan CM (2001). Sim1 haploinsufficiency causes hyperphagia, obesity and reduction of the paraventricular nucleus of the hypothalamus. Hum Mol Genet 10, 1465–1473. [DOI] [PubMed] [Google Scholar]
- Missig G, Roman CW, Vizzard MA, Braas KM, Hammack SE, and May V (2014). Parabrachial nucleus (PBn) pituitary adenylate cyclase activating polypeptide (PACAP) signaling in the amygdala: implication for the sensory and behavioral effects of pain. Neuropharmacology 86, 38–48. [DOI] [PMC free article] [PubMed] [Google Scholar]
- Mizuno TM, Kleopoulos SP, Bergen HT, Roberts JL, Priest CA, and Mobbs CV (1998). Hypothalamic pro-opiomelanocortin mRNA is reduced by fasting and [corrected] in ob/ob and db/db mice, but is stimulated by leptin. Diabetes 47, 294–297. [DOI] [PubMed] [Google Scholar]
- Morales I, Font L, Currie PJ, and Pastor R (2016). Involvement of opioid signaling in food preference and motivation In Progress in Brain Research, (Elsevier; ), pp. 159–187. [DOI] [PubMed] [Google Scholar]
- Morton GJ, Meek TH, and Schwartz MW (2014). Neurobiology of food intake in health and disease. Nat. Rev. Neurosci 15, 367–378. [DOI] [PMC free article] [PubMed] [Google Scholar]
- Müller TD, Nogueiras R, Andermann ML, Andrews ZB, Anker SD, Argente J, Batterham RL, Benoit SC, Bowers CY, Broglio F, et al. (2015). Ghrelin. Molecular Metabolism 4, 437–460. [DOI] [PMC free article] [PubMed] [Google Scholar]
- Nectow AR, Schneeberger M, Zhang H, Field BC, Renier N, Azevedo E, Patel B, Liang Y, Mitra S, Tessier-Lavigne M, et al. (2017). Identification of a Brainstem Circuit Controlling Feeding. Cell 170, 429–442.e11. [DOI] [PubMed] [Google Scholar]
- Nogueiras R, Romero-Picó A, Vazquez MJ, Novelle MG, López M, and Diéguez C (2012). The opioid system and food intake: homeostatic and hedonic mechanisms. Obes Facts 5, 196–207. [DOI] [PubMed] [Google Scholar]
- Pei H, Sutton AK, Burnett KH, Fuller PM, and Olson DP (2014). AVP neurons in the paraventricular nucleus of the hypothalamus regulate feeding. Molecular Metabolism 3, 209–215. [DOI] [PMC free article] [PubMed] [Google Scholar]
- Roman CW, Derkach VA, and Palmiter RD (2016). Genetically and functionally defined NTS to PBN brain circuits mediating anorexia. Nat Commun 7, 11905. [DOI] [PMC free article] [PubMed] [Google Scholar]
- Rosen AM, Victor JD, and Di Lorenzo PM (2011). Temporal coding of taste in the parabrachial nucleus of the pons of the rat. Journal of Neurophysiology 105, 1889–1896. [DOI] [PMC free article] [PubMed] [Google Scholar]
- Rossi J, Balthasar N, Olson D, Scott M, Berglund E, Lee CE, Choi MJ, Lauzon D, Lowell BB, and Elmquist JK (2011). Melanocortin-4 receptors expressed by cholinergic neurons regulate energy balance and glucose homeostasis. Cell Metab. 13, 195–204. [DOI] [PMC free article] [PubMed] [Google Scholar]
- Shah BP, Vong L, Olson DP, Koda S, Krashes MJ, Ye C, Yang Z, Fuller PM, Elmquist JK, and Lowell BB (2014). MC4R-expressing glutamatergic neurons in the paraventricular hypothalamus regulate feeding and are synaptically connected to the parabrachial nucleus. Proceedings of the National Academy of Sciences of the United States of America 111, 13193–13198. [DOI] [PMC free article] [PubMed] [Google Scholar]
- Stachniak TJ, Ghosh A, and Sternson SM (2014). Chemogenetic synaptic silencing of neural circuits localizes a hypothalamus→midbrain pathway for feeding behavior. Neuron 82, 797–808. [DOI] [PMC free article] [PubMed] [Google Scholar]
- Sutton AK, Pei H, Burnett KH, Martin G Myers J, Rhodes CJ, and Olson DP (2014). Control of Food Intake and Energy Expenditure by Nos1 Neurons of the Paraventricular Hypothalamus. Journal of Neuroscience 34, 15306–15318. [DOI] [PMC free article] [PubMed] [Google Scholar]
- Tejeda HA, Wu J, Kornspun AR, Pignatelli M, Kashtelyan V, Krashes MJ, Lowell BB, Carlezon WA, and Bonci A (2017). Pathway- and Cell-Specific Kappa-Opioid Receptor Modulation of Excitation-Inhibition Balance Differentially Gates D1 and D2 Accumbens Neuron Activity. Neuron 93, 147–163. [DOI] [PMC free article] [PubMed] [Google Scholar]
- Tong Q, Ye C-P, Jones JE, Elmquist JK, and Lowell BB (2008). Synaptic release of GABA by AgRP neurons is required for normal regulation of energy balance. Nature Neuroscience 11, 998–1000. [DOI] [PMC free article] [PubMed] [Google Scholar]
- Wu Z, Xu Y, Zhu Y, Sutton AK, Zhao R, Lowell BB, Olson DP, and Tong Q (2012). An Obligate Role of Oxytocin Neurons in Diet Induced Energy Expenditure. PLOS ONE 7(9), e45167. [DOI] [PMC free article] [PubMed] [Google Scholar]
- Xu Y, Wu Z, Sun H, Zhu Y, Kim ER, Lowell BB, Arenkiel BR, Xu Y, and Tong Q (2013a). Glutamate mediates the function of melanocortin receptor 4 on Sim1 neurons in body weight regulation. Cell Metab. 18, 860–870. [DOI] [PMC free article] [PubMed] [Google Scholar]
- Yaswen L, Diehl N, Brennan MB, and Hochgeschwender U (1999). Obesity in the mouse model of pro-opiomelanocortin deficiency responds to peripheral melanocortin. Nat. Med 5, 1066–1070. [DOI] [PubMed] [Google Scholar]
- Yeo GS, Farooqi IS, Aminian S, Halsall DJ, Stanhope RG, and O’Rahilly S (1998). A frameshift mutation in MC4R associated with dominantly inherited human obesity. Nat. Genet 20, 111–112. [DOI] [PubMed] [Google Scholar]
- Zhan C, Zhou J, Feng Q, Zhang J-E, Lin S, Bao J, Wu P, and Luo M (2013). Acute and long-term suppression of feeding behavior by POMC neurons in the brainstem and hypothalamus, respectively. J. Neurosci 33, 3624–3632. [DOI] [PMC free article] [PubMed] [Google Scholar]
Associated Data
This section collects any data citations, data availability statements, or supplementary materials included in this article.