Abstract
Microfluidic acoustophoresis is a label-free technique that isolates a purified product from a complex mixture of cells. This technique is well-studied but thus far has lacked the throughput and device manufacturability needed for many medical and industrial uses. Scale-up of acoustofluidic devices can be more challenging than in other microfluidic systems because the channel walls are integral to the resonant behavior and coupling to neighboring channels can inhibit performance. Additionally, the increased device area needed for parallel channels becomes less practical in the silicon or glass materials usually used for acoustofluidic devices. Here, we report an acoustic separator with 12 parallel channels made entirely from polystyrene that achieves blood cell separation at a flow rate greater than 1 ml/min. We discuss the design and optimization of the device and the electrical drive parameters and compare the separation performance using channels of two different designs. To demonstrate the utility of the device, we test its ability to purify lymphocytes from apheresis product, a process that is critical to new immunotherapies used to treat blood cancers. We process a leukapheresis sample with a volume greater than 100 ml in less than 2 h in a single pass without interruption, achieving greater than 90% purity of lymphocytes, without any prepurification steps. These advances suggest that acoustophoresis could in the future aid in cell therapy bioprocessing and that further scale-up is possible.
I. INTRODUCTION
Acoustophoresis in microchannels has been well-studied as an efficient, gentle, and label-free technique for manipulating cells or particles within a fluid suspension. In practice, acoustophoresis is often performed by oscillating a channel at ultrasonic frequency to establish a pressure standing wave, which results in a force on suspended particles. In one application of the technique, the standing wave is perpendicular to the fluid flow direction, enabling the transport of particles across fluid streamlines. Depending on the particle’s size and the ratio of its mechanical properties to the fluid mechanical properties (density and compressibility), the particle will migrate toward a pressure node. Examples of the many instances of acoustophoretic microdevices demonstrate cell separation or concentration1–4 or trapping.5–8 Surface acoustic waves, instead of bulk channel excitation, may also be used for cell and particle manipulation.9–11 Additionally, there are experimental efforts to achieve a deeper understanding of the fundamental physics of acoustofluidics in microchannels, analyzing particle trajectories,12,13 whole-device imaging of acoustic resonances,14 measurements of acoustic properties of cell subpopulations,15 single-particle tracking to quantify local acoustic energy densities,16 and manipulations of the properties of the suspending fluid.17
While these efforts have produced new insights and favorable results for their various applications, existing acoustic microfluidic devices generally operate on the order of 0.1 ml/min flow rate, which is too slow for many industrial or medical applications. A method of scaling acoustic separation to larger flow rates would expand its uses. One specific example of the need for increased throughput is in the processing of a 200 ml leukapheresis collection, a common task in emerging cell therapies. With current methods of centrifugation and/or immunomagnetic selection, this sample can be purified in several hours. However, this process is recognized as the one in need of automation to help reduce the time and cost of the therapy.18,19
Scaling up acoustic microfluidic devices poses challenges. Existing single-channel acoustic microfluidic devices are in a mature state of development, in which acoustic energy, sample residence time, and channel cross section have already been optimized, and large gains in throughput (per channel) seem unlikely without new configurations. For example, one could not simply enlarge the cross section of the fluid channel to allow an increase in the volumetric flow rate, even though the residence time in the acoustic field could be unchanged. This is because the frequency of the acoustic modes of the channel would decrease with the increased dimensions, thus reducing the acoustic force exerted on the cells.20 Therefore, a more promising approach to increasing throughput is to build many channels for parallel processing. However, this also presents several challenges. One difficulty is that the channel walls are integral to the resonant behavior of the acoustic cavity21 and coupling to neighboring channels can inhibit performance. Additionally, an array of channels requires increased device size and multilayer routing of the outlets, and this fabrication becomes less practical in the micromachined silicon or glass materials usually used for acoustofluidic devices.
In this work, we address the challenges of developing an acoustic separation device that has parallel channels. The system retains the sensitive discrimination of cell types previously demonstrated by acoustic separation (separating lymphocytes from other white blood cells), yet it achieves an order-of-magnitude increase in throughput relative to previous single-channel devices. In addition, the design described herein could enable even larger arrays of channels. To decouple the potential acoustic interaction between neighboring channels, the device incorporates air gaps between them. The channels are milled from polystyrene (PS) sheets, where surface area of the substrate is not a relevant constraint. The individual channel dimensions are taken from our previous studies of plastic single channel devices22–24 and replicated into an array along with multilayer manifolds to distribute the inlet flow from a single port and to merge the channel outlets into two exit ports. The channels are excited by a single rectangular plate transducer.
The results below describe the optimization and testing of this device and confirm for the first time that acoustic separation can be scaled to large parallel arrays successfully. Our results show an improvement in the uniformity of resonant frequency from channel-to-channel when the air gaps (i.e., slots) are present compared to when they are not; we discuss optimization of transducer drive parameters including frequency-modulation; and we show experiments that compare the performance between two different channel dimensions previously tested in single-channel devices. Finally, we demonstrate the utility of the scaled-up system by testing its ability to purify lymphocytes from apheresis product, a process that is critical to new immunotherapies used to treat blood cancers. As is now well known in acoustophoresis, the largest and most dense blood cells migrate fastest toward the pressure node. In the configuration here, the pressure node is along the center axis of each channel, and red blood cells, monocytes, and granulocytes are preferentially directed to the center outlet of each channel, while the less responsive lymphocytes remain toward the channel side streams and are collected in side outlets of each channel. We and others have previously reported label-free purification of lymphocytes by acoustic separation, and it is discussed in more detail in Refs. 17, 22, 25, and 26, but here we show that this purification can be performed at the rates needed for adoption in clinical cell therapy processing.
II. METHODS
A. Microfluidic chip materials and design
All microfluidic devices were fabricated from thermofusion bonded sheets of commodity polystyrene, with channels and ports milled by conventional machining. We selected polystyrene for its relatively high acoustic impedance (among plastics) and low attenuation at MHz frequencies,23 established adoption in biomedical devices and cell culture, high-volume manufacturability, and good optical clarity for real-time observation. Inlet and outlet connectors were affixed, and the device was flow tested to confirm successful bonding. We reported details of the material selection and fabrication methods previously,23 and below we summarize them along with specifics for the present experiments.
We tested four device designs in this study, two designs having four parallel channels and two designs having 12 parallel channels. The four-channel devices had the same cross-sectional channel dimensions but were made without and with slots between neighboring channels, designs 4.1 and 4.2, respectively. Initially, these devices had a single outlet at each channel end and were, therefore, not used to perform any cell separations. These were used to study the variability of optimum frequency among channels using imaging of the RBCs. In a second iteration of 4.1 and 4.2, the same four-channel designs, without and with slots, were fabricated with a trifurcation at each channel outlet and routed to two main outlet ports so that the separation of RBCs could be measured. The 12-channel devices were used to compare the separation efficiency of two different channel cross-section dimensions referred as 12.1 and 12.2, where in both cases those dimensions had been tested previously in single channel separators; refer to Table I for channel dimensions. All 12-channel devices had a trifurcation at each channel outlet to enable separations and had slots between neighboring channels. Since design 12.2 had superior performance, we obtained the remainder of results of this study with devices of that design.
TABLE I.
Dimensions and design information of each design tested during this study. Dimensions are in micrometers.
| Design | Number of channels | Channel width, | Wall width, | Channel height | Slots (Y/N) |
|---|---|---|---|---|---|
| 4.1 | 4 | 550 | 850 | 250 | N |
| 4.2 | 4 | 550 | 850 | 250 | Y |
| 12.1 | 12 | 430 | 1050 | 200 | Y |
| 12.2 | 12 | 550 | 850 | 250 | Y |
The four-channel devices were machined using a desktop micromill (Bantam Tools, Berkeley, CA, USA). Channel width, , and wall width, , were designed according to dimensions previously optimized by Silva et al.24 Slot width, , was chosen based on machining capabilities at , which is the smallest comfortable width, to minimize overall device footprint and material. The initial device was comprised of two layers and required just one bonding step.
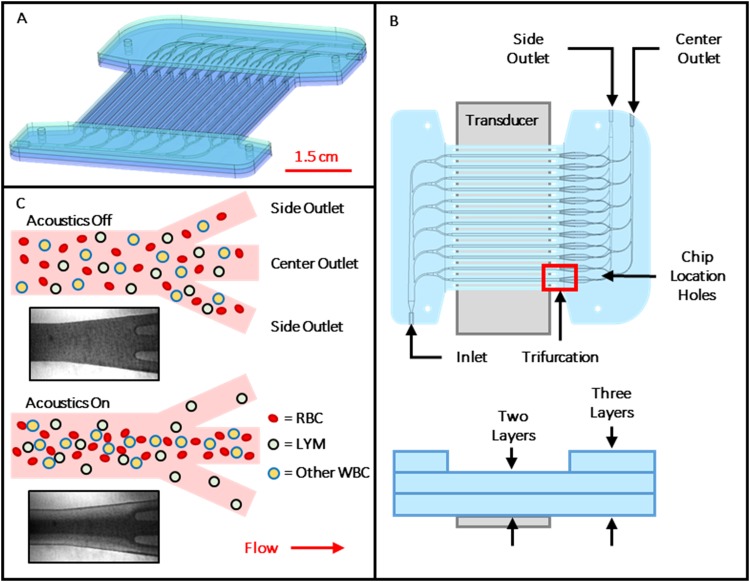
The 12-channel device was fabricated using precision 5-axis machining and contained a single inlet and two outlets. The single inlet branches to six separate bifurcating channels that feed the channel array. Each of these channels has a trifurcation at the downstream end; the center outlet of each merges to a common outlet manifold that is connected to one outlet port (called the “center outlet”). The two side outlet channels of each trifurcation merge to a similar common outlet manifold connected to a second outlet port (called the “side outlet”). The inlet manifold, parallel separation channels, trifurcations, and center outlet manifold are machined on one face of the substrate, while the side outlet manifold was machined on the opposite face. The side outlet manifold connects to the main channel level by a through hole angled at (Fig. 1). An additional sheet sealed the channels on both faces of the center layer, for a total of three sheets thick in the inlet and outlet manifold regions and two sheets thick elsewhere, as shown in Fig. 1.
FIG. 1.
(a) Rendering of assembled 12-channel device with inlet at bottom left and outlets at top right. (b) Top and side views of device, showing channel layout, transducer position, and bonded layers. Layer thicknesses are exaggerated for clarity. (c) Illustration showing top view of idealized acoustic purification of lymphocytes from other blood cells as they exit the separation channel at its downstream end trifurcation. Insets are micrographs showing response of red blood cells (dark regions) at the outlet of a representative channel with transducer off and on.
Throughout the manifolds, the channel cross section was adjusted in both height and width, and the radius of curvature was calculated to reduce variations in shear rate in the flowing liquid according to designs developed previously by others.27–30 Maintaining a shear rate within physiological limits is believed to reduce potential clotting and fouling of blood in the microchannels (e.g., by shear-induced platelet activation).30
B. Fabrication
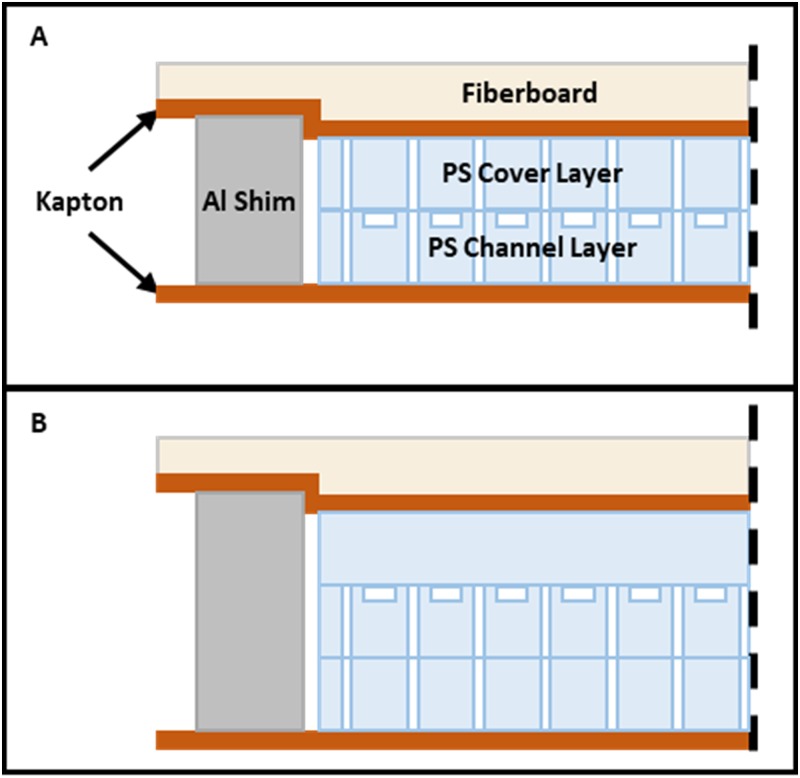
For all devices, the features were machined into 0.95 mm thick sheets of “general purpose” polystyrene (Calsak Plastics, Atlanta, GA, USA). The channels were capped by thermofusion bonding in a custom heated press as described previously.23 Bond time was 45 min at a temperature of , and pressure 240–275 kPa was maintained throughout the heating, static, and cooling process. For the 12-channel devices, the third layer was bonded in a separate step. Four aluminum shims, 25.4 mm long, 12.7 mm wide, and 2.02–2.03 mm thick, were used for 2-layer bonds. Thicker shims, 2.93–2.95 mm, were used when bonding the third layer. The stack created for thermofusion bonding is shown in Fig. 2. After bonding, stainless steel (SS) 20-gauge tubing was glued into the ports with epoxy (Epoxy 907, Miller-Stephenson, Danbury, CT, USA), and vinyl catheter tubing was fit over the SS connectors. The flow rate at the side outlet relative to the total outlet flow rate is here termed “flow fraction” or “side flow fraction” and was set by adjusting the hydraulic resistance at each outlet using outlet tubing of fixed dimensions. Polyvinyl chloride (PVC) tubing, inner diameter (ID) of 0.69 mm and 20 cm long, was used for the inlet. Side and center outlet tubing of the same ID was cut to length to set the desired flow fraction. Typical lengths were in the range of 25–50 cm. In some cases, 0.58 mm ID was used on the outlet, depending on the required flow fraction.
FIG. 2.
Arrangement of layers, release film, and compliant fiberboard during thermofusion bonding. (a) Step one: the main channel layer bonded to the cover using aluminum shims. A 0.005 in. thick sheet of Kapton above and below the device serves as release film. Here, the fiberboard is shown compressed as it appears after bonding. (b) Step two: the third layer bonded with thicker shims, while other materials remain the same.
We measured thickness of the polystyrene sheets prebond and postbond using a drop gauge (Sony U30B-F, Sony Magnescale, Tokyo, Japan), in order to determine channel compression. Channel width was also measured using a calibrated microscope. Following device fabrication, the flow cell was tested to confirm bond integrity by pumping deionized water at .
C. Experimental setup
The transducer mounting, temperature control, and electronic equipment were described previously.22 The microfluidic device is mounted with a thin layer of glycerol (as acoustic coupling material) to a lead zirconate titanate (PZT) bulk transducer element, type 850, 65 mm wide, 25 mm long, 1.8 mm thick, and estimated a resonant frequency of 1.13 MHz (APC International, Ltd., Mackeyville, PA, USA). A thermal gap pad (Laird Technologies, Earth City, MO, USA) was cut to the transducer footprint and laid between the transducer and a custom-built temperature-controlled stage.
The stage comprised an aluminum block heat sink, a thermoelectric element, and heat exchangers mounted to the top and bottom of an aluminum base. The stage was actively cooled to dissipate heat from the transducer, and temperature was held constant at 26 °C with a temperature controller (Model LFI-3751, Wavelength Electronics, Bozeman, MT) and monitored by a miniature thermistor clamped to the surface of the transducer.
A function generator (AFG 3022C, Tektronix, Beaverton, OR) produced a sinusoidal voltage, amplified by a radio frequency (RF) amplifier with standard output impedance of (AG Series Amplifier, T&C Power Conversion, Rochester, NY). The function generator is capable of generating modulated signals, which will be discussed in more detail in Sec. III. An impedance matching transformer between the RF amplifier and piezoelectric transducer reduced reflected power and more effectively delivered the power to the low impedance load. A stereomicroscope was used to observe the acoustophoresis in real-time, while an oscilloscope (DPO 2024B, Tektronix, Beaverton, OR) measured the instantaneous voltage and current and calculated the average dissipative power.22
Depending on the sample throughput requirements and goals of the experiment, two pumping mechanisms were used. For shorter optimization studies, we used a syringe pump (PHD ULTRA™, Harvard Apparatus, Holliston, MA, USA) with 20 ml plastic syringe (BD Luer-Lok Tip, Becton Dickinson, Franklin Lakes, NJ, USA) and connected to the inlet tubing via 21-gauge SS blunt tip (Nordson Corporation, Westlake, OH, USA). For larger sample processing, a peristaltic pump (Ismatec REGLO ICC with 12 Rollers, Cole-Parmer, Vernon Hills, IL, USA) was used to transport the sample from an Erlenmeyer flask. A filter (TRU-FLO® NEO-40, Charter Medical, Winston-Salem, NC, USA) was placed immediately after the peristaltic pump and before the device to remove large debris. Additionally, the filter added compliance to the system and, therefore, reduced pulsations in the flow caused by the peristaltic pump. The sample was gently stirred in the flask with a magnetic stir bar.
D. Blood samples and cell handling
Devices were tested with human blood products obtained from healthy donors, either packed red blood cells (RBCs) or fresh leukapheresis product. All products were purchased deidentified from commercial vendors operating under approved protocols. Packed RBCs suspended in CPDA-1 (Interstate Blood Bank, Memphis TN, USA) were used within 40 days of collection. Leukapheresis samples (Key Biologics, Memphis TN, USA) were anticoagulated with acid citrate dextrose (ACD), shipped overnight chilled, and used within 36 h of collection. We diluted packed RBCs with phosphate buffered saline (PBS) to the desired hematocrit (HCT). Leukapheresis product was diluted using a combination of PBS, Histopaque 1077, and/or Histopaque 1119 (Sigma-Aldrich, St. Louis, MO, USA) to achieve the desired density and/or HCT. Dilution was either 1:1 or 4:1, sample:diluent, as described in Sec. III. For larger volume studies, leukapheresis product was diluted 4:1 using PBS and Histopaque 1119 to achieve an estimated fluid density of 1.04 g/ml. Samples were analyzed before and after separation using an automated hematology analyzer and, in some cases, also by flow cytometry. The analyzer (XP-300, Sysmex Corporation, Kobe, Japan) counts red blood cells (RBCs) and white blood cells (WBCs) and additionally performs a three-part WBC differential analysis, providing counts of lymphocytes, neutrophils, and other. However, when samples differ widely from normal whole blood as they did here, the software suppresses neutrophil counts.
For flow cytometry, we labeled samples with a panel of CD3 (25-0038-41), CD14 (56-0149-41), CD19 (47-0199-41), CD45 (MHCD4530TR), and CD56 (A15704) antibodies (Invitrogen Corporation, Carlsbad, CA, USA). Samples were concentrated by centrifugation and washed with PBS. Equal volume fractions of samples were suspended in flow buffer (PBS with 0.5% BSA and 2 mM EDTA) containing the above antibodies and incubated for 20 min at room temperature. Stained cells were washed and suspended in flow buffer containing 7AAD (Thermo Fisher 00-6993-50). Analysis was performed using an Attune Nxt Flow Cytometer (Thermo Fisher) and analyzed using FlowJo V10 software. Cell recoveries were determined by calculating the total number of cells in each sample using the original volume of the sample and the number of live and single cell gated events obtained from flow analysis.
E. Performance testing
To assess the performance of device designs and electrical parameters, packed RBCs at 10% HCT were pumped through the device while imaging the downstream end of the channel. As a surrogate for the acoustic energy density, we used image analysis to measure the extent to which the RBCs were driven toward the center stream (i.e., the acoustic “focusing” of the RBCs). This allowed us to assess devices and configurations rapidly without the need to count cells or measure separation.24 The RBCs strongly absorb white light illumination and when packed into the central stream of the channel by acoustophoresis form a dark band in captured images. This dark band corresponds to an inverted peak in pixel intensity across the channel, and we calculated the peak height in each case to compare different operating conditions.
Specifically, for the image analysis, images were taken with the acoustic actuation on, with the acoustic actuation off, and with the channel filled with water (for background subtraction). The images were processed in ImageJ, aligned using normalized correlation coefficient, inverted, and a line 300 pixels wide was drawn across the width of the channel, to obtain an average pixel intensity at each position across the channel width. Background light gradients were then subtracted using the water control image. Pixel values were normalized by dividing by the zero-voltage blood condition, which accounts for inconsistencies in lighting and inlet cell concentration. To quantify the degree of RBC focusing on the normalized images, we calculated the peak height as the difference between the maximum pixel value and adjacent local minima. The peak pixel value corresponds to the greatest concentration of RBCs, while the lower pixel values correlate with lower RBC concentration. Further detail on the image processing is provided in the supplementary material.
In addition to image analysis, separation and purification in the devices with two outlet ports were tested by cell counting with either RBCs or leukapheresis product. Side and center outlet samples were collected in conical tubes, weighed to calculate volume, and cell concentrations were measured. Recovery of a cell type was calculated as
| (1) |
where is the number of target cells collected from the center outlet and is the number collected from the side outlet. Cell depletion, as in the RBC depletion results, is defined as . Lymphocyte purity was measured with the hematology analyzer and is defined as the percentage of lymphocytes relative to the total WBC measured.
III. RESULTS
A. Comparison of devices with and without slots
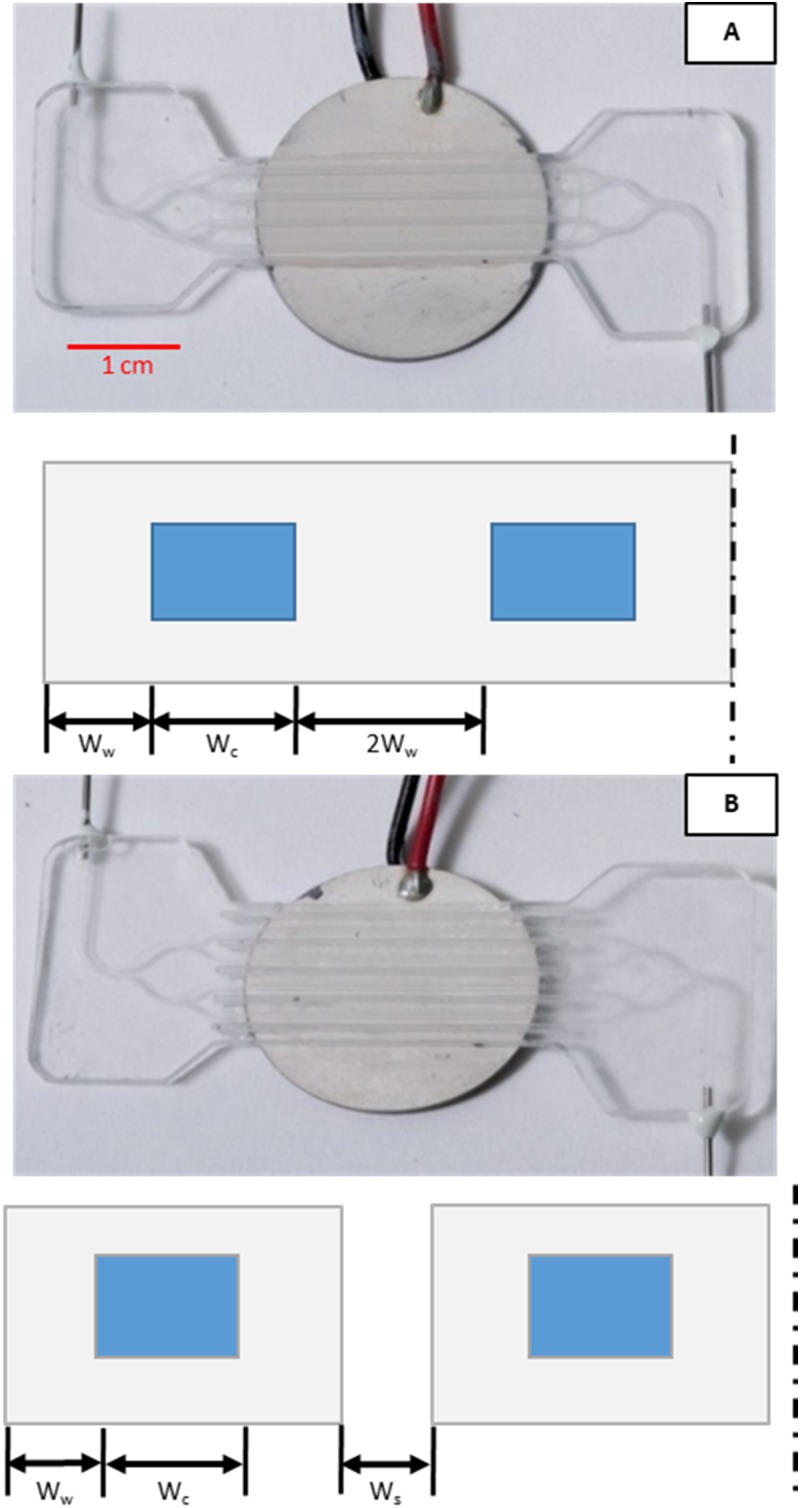
Four-channel test devices were fabricated as shown in Fig. 3 with and without air gaps (slots) between channels. The two designs were compared for the uniformity of optimum tuning frequency among the four channels, using RBCs as the test solution, and the image analysis as described in Sec. II. Power to the transducer was held constant. Table II shows the optimal focusing frequency for each channel as well as the corresponding height of the peak in RBC focusing as measured by image analysis. The listed frequency is that at which the RBCs are observed to most strongly migrate to a single pressure node along the center axis of the channel.
FIG. 3.
Photographs of four-channel test device mounted to transducer and cross-section diagrams below to show relative dimensions (not to scale). (a) No-slot design with width of the wall, width of the fluid cavity, and dashed line indicating symmetry plane. (b) Slotted design with gap of width between neighboring channels. All other dimensions are the same as in (a).
TABLE II.
Resonant frequencies and degree of RBC focusing (as measured by peak height in image analysis) in intensity units (i.u.) from four-channel devices with and without slots.
| No slot (design 4.1) | Slotted (design 4.2) | |||
|---|---|---|---|---|
| Frequency (kHz) | Peak height (peak i.u.) | Frequency (kHz) | Peak height (peak i.u.) | |
| Channel 1 | 550 | 19 586 | 590 | 62 024 |
| Channel 2 | 640 | 9213.4 | 590 | 28 529 |
| Channel 3 | 610 | 7123.7 | 600 | 18 006 |
| Channel 4 | 540 | 10 224 | 610 | 40 748 |
| Mean | 585 | 11 537 | 597.5 | 37 327 |
| Std. dev. | 48 | 5519 | 9.6 | 18 906 |
The results show that the slots improved uniformity of optimum frequency from channel to channel. The slotted, 4.2 design, resulted in a tighter distribution, 9.6 kHz standard deviation, of resonant frequencies compared to 48 kHz observed in the no-slot, 4.1 design. Additionally, the mean peak height of the focused RBCs in the slotted design was higher than that of the no-slot design, 37327 vs 11537, suggesting that the slots may result in a device that induces stronger acoustophoresis for a given transducer power; however, this latter result was not statistically significant.
We next tested the separation performance directly for the four-channel devices, with and without slots, by measuring RBC depletion. Devices were mounted and coupled to a piezoelectric transducer with glycerol and driven with a constant sinusoidal signal at 4.5 W. Packed RBCs were prepared to 10% hematocrit and pumped at three flow rates, and cell counts were obtained for each test as described in Sec. II. Three replicates were performed with each device, including dismounting and remounting the device to the transducer.
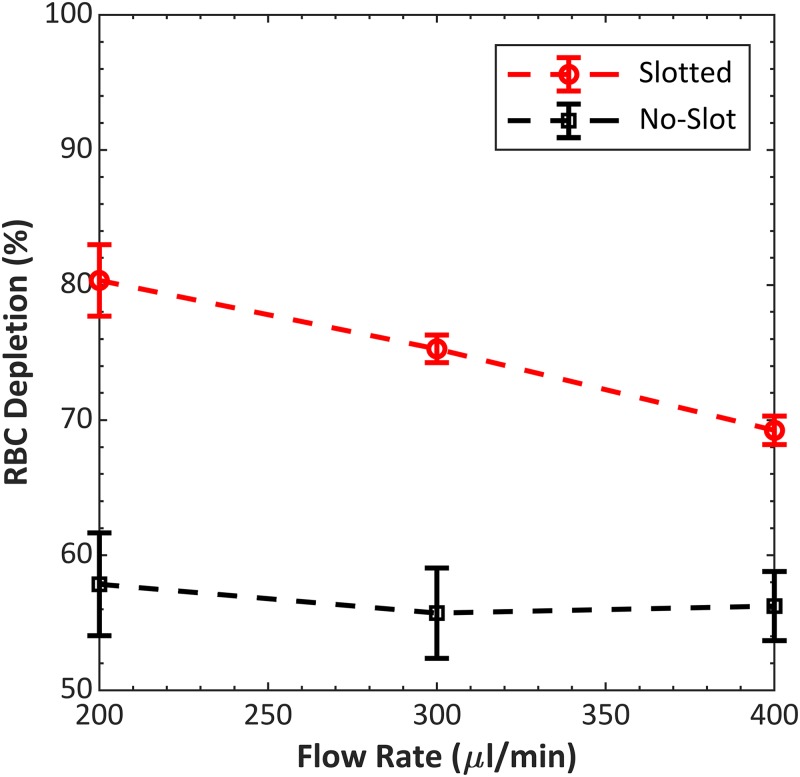
The results of the separation tests (Fig. 4) indicate that the slots improved the performance of devices that were otherwise similar. At all flow rates, the 4.2 device achieved higher RBC depletion than the 4.1 device. RBC depletion decreased with increasing flow rate, as is expected because of decreased residence time with increasing flow rate. Based on these results, all 12-channel devices described in this paper were designed with slots between channels.
FIG. 4.
Performance comparison between no-slot, 4.1 and slotted, 4.2, four-channel devices. Both devices had the same channel dimensions and total wall width (see Table I and Fig. 3 for dimensions). RBC depletion was averaged from three replicates. The average zero-voltage (transducer off) RBC depletion for design 4.1 and design 4.2 were 49.6% and 50.7%, respectively. Operating frequencies for designs 4.1 and 4.2 were 605 and 597 kHz, respectively.
B. Fabrication and dimensional tolerances
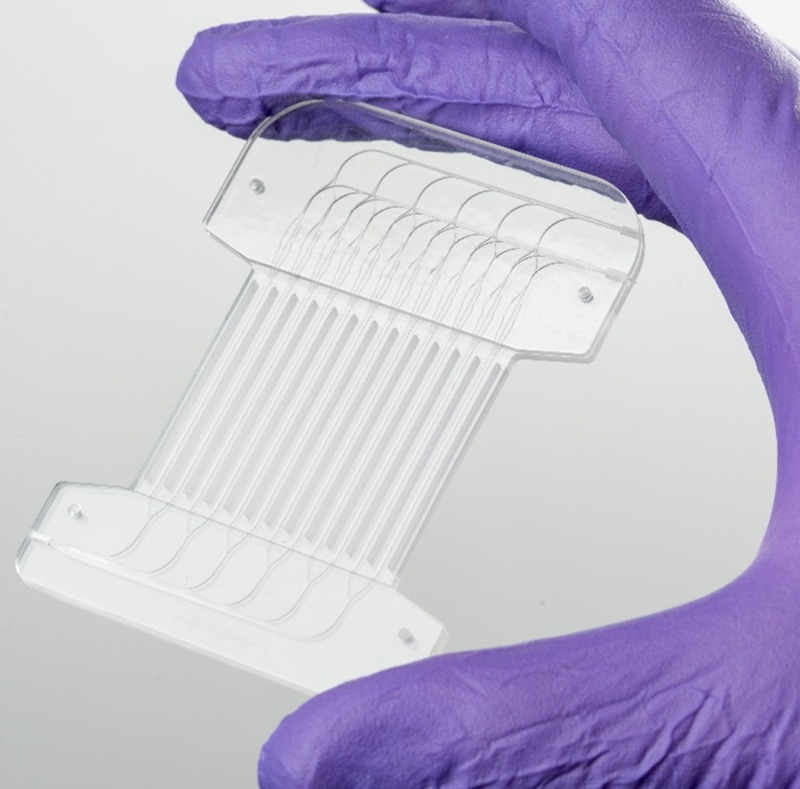
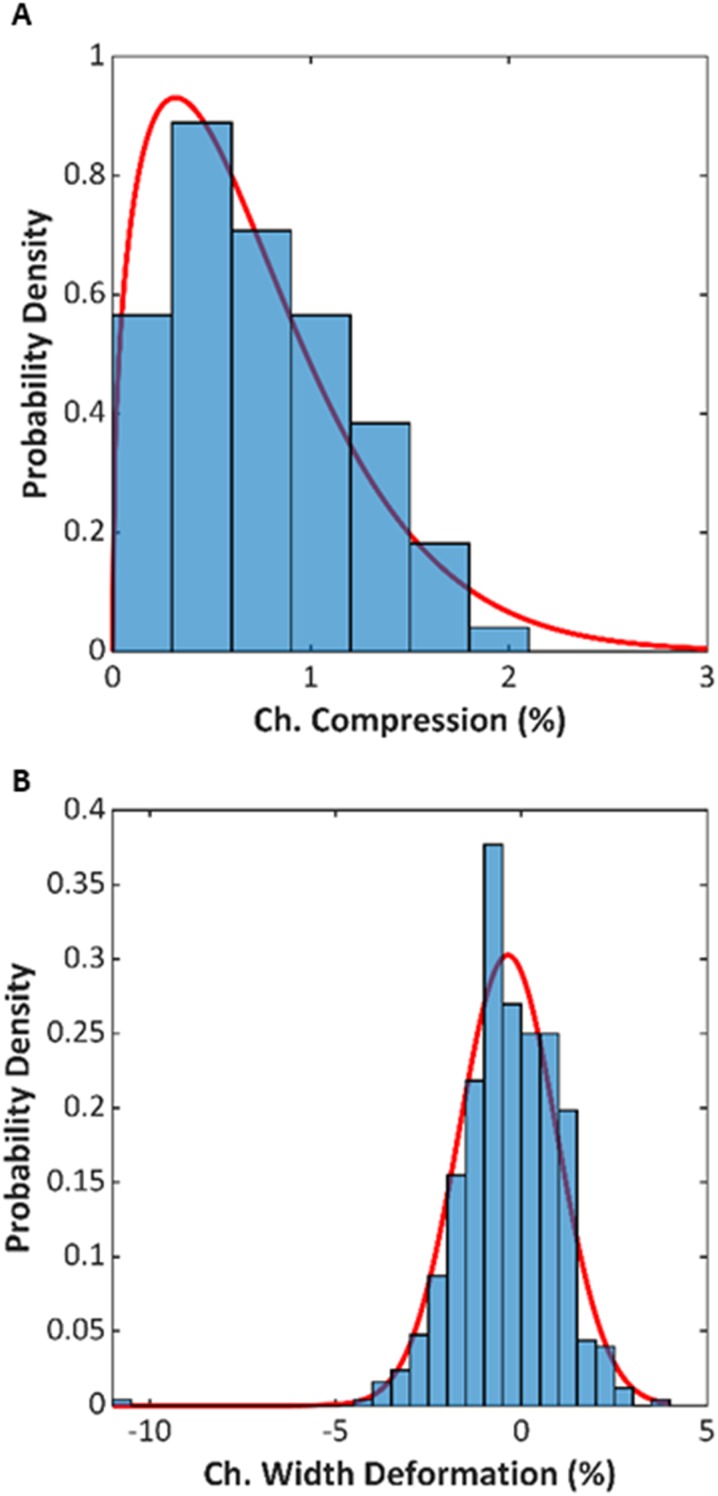
The 12-channel devices were machined and bonded as described in Sec. II. Figure 5 shows a photograph after bonding. The devices were measured for any dimensional changes due to the thermal bonding, since variability in channel dimensions could result in variability in resonant frequency and in the acoustic separation performance. A total of 168 thickness measurements and 504 channel width dimensions were collected from 14 devices. Specifically, three points at the sidewalls along the length of four different channels were measured with a drop gauge to compute the channel compression, and three locations on each channel were imaged prebond and postbond to measure the channel width. The distribution of these measurements is presented in Fig. 6. The compression distribution resembled a Weibull distribution with the following probability density function coefficients and equal to 0.790 and 1.392, respectively. The mean percent compression was 0.73%, which equates to approximately of compression. The fit to the Weibull distribution is useful because outliers in compression usually indicate errors in process bond temperature; thus, the distribution can be used to set quality control standards. The percentage of channel width deformation followed a normal distribution with a mean value of and standard deviation of 1.318%. Across the devices tested during this study, the average channel width was .
FIG. 5.
Photograph of fabricated 12-channel device. In this view, the inlet port is at lower left and outlet ports are at upper right, with the “center” outlet (merged from center outlets of each channel) positioned distal to the inlet.
FIG. 6.
(a) Distribution of channel compression for the fourteen 12-channel devices fabricated for this study. (b) Distribution of channel width deformation for the same fourteen devices. The red lines are fits of continuous distributions.
C. Comparison of devices having different channel cross-section dimensions
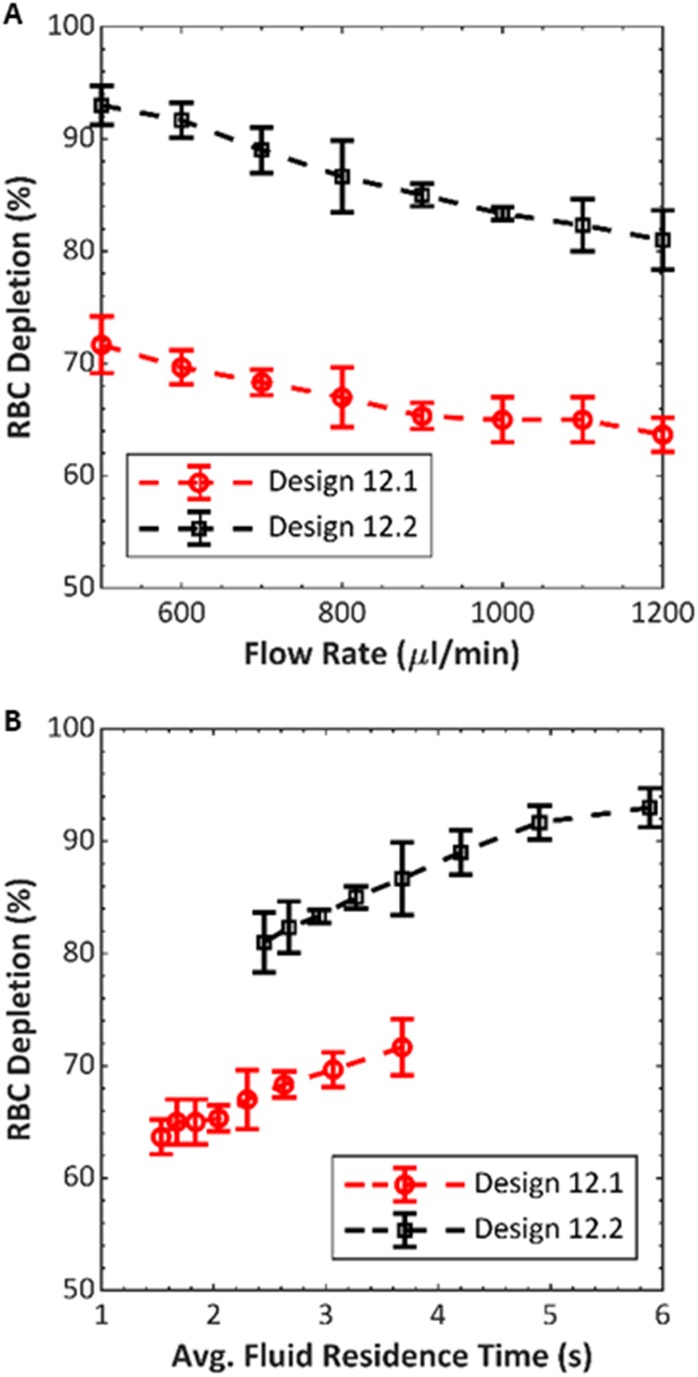
We wished to test if differences in the performance due to channel geometry, previously observed in single-channel devices, would also occur in 12-channel devices. We compared designs 12.1 and 12.2 (dimensions in Table I) by measuring RBC depletion in three of each type, while keeping all other system parameters fixed. We used packed RBCs (diluted to 10% HCT), and average dissipative power and flow fraction were kept constant at 12 W and 45%, respectively. Flow rate was swept from 500 to in increments. Figure 7 shows RBC depletion as a function of flow rate for the two different device designs. For both devices, the depletion decreases as the flow rate increases. This behavior is expected because, at larger flow rates, the time spent in the acoustic field is reduced, and there is less time for RBCs to migrate toward the center outlet. Across the range of flow rates tested, we observed an average RBC depletion improvement of 19.5% (standard deviation of 1.7%) when using design 12.2, relative to design 12.1. Because of the different channel dimensions, the two designs had different operating frequencies: design 12.1 devices were driven at , while design 12.2 devices were driven at .
FIG. 7.
Performance comparison between 12-channel devices having channels of two different cross-section dimensions, 12.1 and 12.2 (see Table I for dimensions). RBC depletion was averaged across the three different devices fabricated of each design. The average zero-voltage (transducer off) RBC depletion for design 12.1 and design 12.2 were 57.7% and 56.3%, respectively. (a) RBC depletion vs flow rate and (b) the same data as (a) plotted vs average fluid residence time.
Because the cross section of the fluid channels in the 12.2 design is larger than that of the 12.1 design for a fixed flow rate, the average fluid velocity is lower in the 12.2 design. This would be expected to improve RBC depletion because of the corresponding greater residence time in the channel, even if the acoustic energy density were equal in the two devices. Therefore, Fig. 7 also compares RBC depletion vs the calculated residence time for the two designs, where the residence time is defined as channel cross-section area times channel length, divided by flow rate. The 12.2 design shows greater depletion than 12.1 at each flow rate and each residence time, suggesting that the 12.2 design is more efficient at converting the mechanical actuation of the transducer to the acoustic mode in the channel.
These results corroborate our previous comparison in single-channel devices using the same two cross-sectional dimensions,24 where the dimensions of design 12.2 were observed to produce superior separation. Specifically, in that study, we compared RBC depletion in what may be referred to as 1.1 and 1.2 designs, each consisting of a single microchannel and having the same channel and wall cross-section dimensions as those of the corresponding 12.1 and 12.2 devices presented here. RBC depletion vs transducer power was compared at three flow rates. Similar to the observations here, the 1.2 device achieved higher RBC depletion in all cases. For example, at flow rate (corresponding to in a 12-channel device) and comparable electrical power, the 1.2 device depleted about 88% of RBCs, while the 1.1 device depleted only about 57% of RBCs. The results support the hypothesis that the parallel channels behave comparably to single-channel devices, despite the configuration that couples their ends at the manifold.
D. Electrical drive optimization
We tested parameters of the excitation frequency for repeatability and impact on RBC depletion among three replicate devices. The purpose of these studies was to examine how adjustments in frequency might be used to compensate for nonuniformities in the system, such as fabrication variability in channel dimensions or differences in the coupling to the transducer. Packed RBCs at 10% HCT were pumped through each device at with 50% flow fraction for all of these tests. The optimal constant frequency was determined by measuring RBC depletion while operating at 795–870 kHz in 5 kHz increments. Voltage across the transducer, average dissipated power, and flow rate were constant at 150 Vpp, 18 W, and , respectively. The average optimal frequency was 833 kHz with a standard deviation of 5.8 kHz (Fig. 8). The devices averaged a RBC depletion of 87.9% with a standard deviation of 3.6%. Having established the optimal frequency for each device, we tested if frequency modulation (FM) about this optimal frequency could further improve the performance. The rate of variation was swept from 10 Hz to 10 kHz using a 15 kHz frequency variation about the center frequency. No clear distinction was observed when comparing the effect of rate of variation except toward the extreme values tested, shown in Fig. 8. Henceforward, 100 Hz was chosen as the rate of variation for the FM deviation testing. Frequency variation was tested from 0.1% to 5.0% of center frequency. We observed a peak RBC depletion around 2.0% variation, with a gradual drop off in the performance as the variation increased toward 5.0%, shown in Fig. 8. By modulating the frequency 2.0% of the center frequency at 100 Hz, we are able to improve RBC depletion by 3.4% compared to constant frequency excitation. We hypothesize that the frequency modulation is beneficial because the deviation allows channels having differing optimal frequencies to be optimally excited at least part of the time, and therefore, there should be a correlation between the variability in resonant frequency among individual channels and the optimal frequency variation. Interestingly, the preferred 2% frequency variation found here is in close agreement with the standard deviation of resonant frequency measured in the four-channel design 4.2 (Table II), where the standard deviation of 9.6 kHz was 1.7% of the 598 kHz mean.
FIG. 8.
Effects of transducer drive parameters on RBC depletion for three design 12.2 devices. (a) RBC depletion vs frequency, with no frequency modulation. (b) Average RBC depletion vs the rate of modulation, with center frequency selected for each device according to panel at left; and deviation of . (c) RBC depletion difference vs deviation. Deviation is shown as percent of center frequency and RBC depletion as relative to result with constant frequency.
E. Optimization of lymphocyte purification
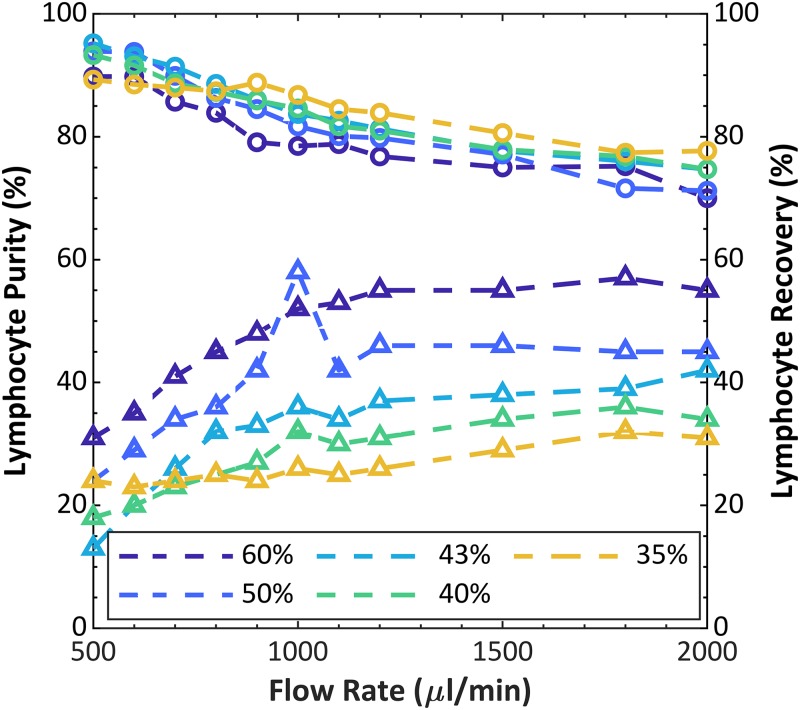
Using the 12.2 device and the conditions optimized above, we tested the purification of lymphocytes from fresh leukapheresis product under varying conditions of flow rate and (side) flow fraction, shown in Fig. 9. We previously demonstrated acoustophoretic purification of lymphocytes from dilute whole blood, unpurified buffy coat, and leukapheresis product, using single-channel devices.22 Lymphocyte purification by acoustophoresis may be understood by comparing the average sizes and densities of the major types of blood cells and recalling that the largest and most dense cells will experience the greatest acoustophoretic force. Among white blood cells, lymphocytes are the smallest at , whereas granulocytes and monocytes are and , respectively; and furthermore, lymphocyte density is whereas granulocyte density is . Meanwhile, red blood cells, though, closer to lymphocytes in diameter, also are higher in density at .31 For this study, leukapheresis product was diluted to a density of 1.06 g/ml with the net dilution being 1:1, sample:diluent. Input dilute cell concentrations were WBC, lymphocytes, RBCs, and platelets. HCT was 2.7%. The trends show an expected trade-off between purity and recovery, which depends on flow rate and side flow fraction. Higher flow rates result in shorter residence time within the acoustic field, which results in less particle transport across the channel width. In the limiting case at a very high flow rate (neglecting any inertial effects), the purity should decrease to approach the input purity, and the recovery should increase to approach the side flow fraction. Conversely, at very low flow rate and high residence time, the acoustophoresis will have displaced most cells of all types away from the side outlets, hence low recovery, and leave a high purity of only the least responsive cell types that had a starting position toward the sides of the input stream. Similarly, considering the laminar flow streams, a higher side flow fraction is expected to reduce purity but increase recovery, because this condition collects more cells that are only partially displaced toward the center stream. For example, at up to 95.2% purity of lymphocytes was achieved from a starting purity of 63%, but with a recovery of 13%. Choosing a more moderate balance, 90% purity was achieved with recovery up to 32% at . In control tests with the transducer off, the purity ranged between 69 and 72%, and the recovery between 39 and 59% depending on the flow fraction selected.
FIG. 9.
Lymphocyte purity (circles), as percentage of WBCs, and recovery (triangles) vs flow rate at varying flow fraction, using leukapheresis product as the input sample. Percentage values in the legend represent the flow fraction. Initial lymphocyte purity was 63.1%.
F. Continuous purification of 100 ml leukapheresis product
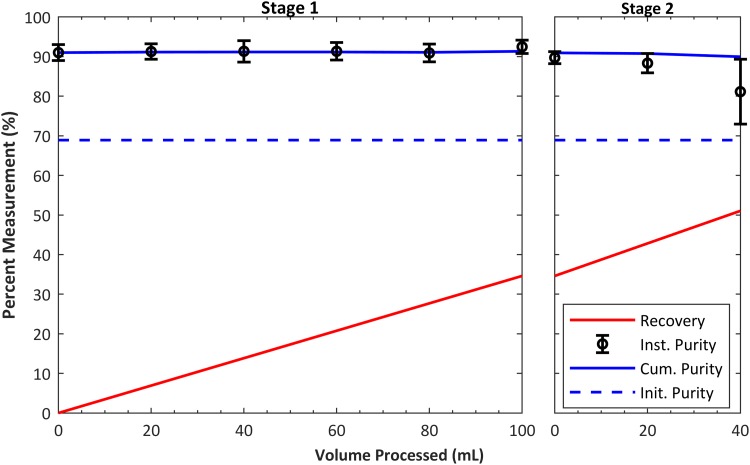
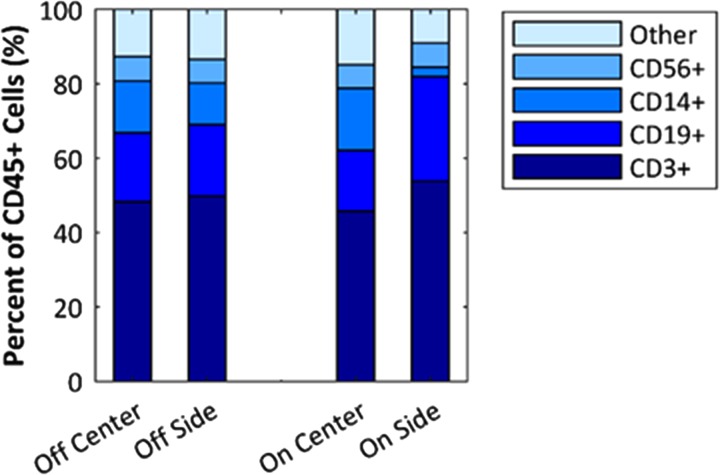
To show that the system can purify a sample on the scale of a clinical leukapheresis collection (i.e., a “leukopak”), we processed 100 ml of leukapheresis product under continuous conditions with no operator intervention. Three runs were performed from three different donor samples prepared as described in Sec. II (with dilution 4:1, leukapheresis:diluent). Two different devices were used for these three experiments (i.e., one twice, the other once). Flow rate was 1 ml/min, and input and output aliquots were taken in 20-min intervals. The voltage and power to the transducer were approximately 150 V and 17.9 W, respectively, for all experiments. Additionally, to increase the recovery of lymphocytes, we reprocessed the center waste product from the initial separation. The input into this second stage separation was not modified or diluted, and the system used the same settings as the initial separation. As shown in Fig. 10, the average initial purity of unprocessed sample was 68.9%, the final average purity was 91.4%, and the average recovery was 34.6% after stage 1 and 51% for stage 2. Lymphocyte recovery per milliliter processed was calculated using the final lymphocyte recovery measured and is shown on the plot. The average number of WBCs processed in the three runs was WBCs at a rate of WBCs/h. Including RBCs, the rate of cells processed was cells/h. As a control, we measured the lymphocyte purity in the zero-voltage (transducer off) condition and the average between the three tests was 72.4%. To further inspect the acoustophoretic response of the mononuclear cell subtypes (lymphocytes and monocytes), flow cytometry measurements were performed on a sample processed as in Fig. 10. In current cell therapies, the T-cells are the lymphocytes that are most commonly the target of separation; hence, it is important to ensure that the above results of lymphocyte purification reflect the T-cell population. The results, shown in Fig. 11, suggest that the system enriches lymphocytes mainly by depleting monocytes (CD14+). The relative proportion of T-cells (CD3+) to other lymphocytes, the B-cells (CD19+), and natural killer (NK) cells (CD56+) is not significantly changed. This could be expected because monocytes are typically larger than lymphocytes. In addition to measuring the distribution of the cell types, the counts were recorded, which allowed us to calculate the CD3+ recovery to be 30% compared to a total lymphocyte recovery of 32%.
FIG. 10.
Results of continuous purification of 100 ml solution of leukapheresis product at 1 ml/min. The plot shows average cumulative purity (blue solid line) and recovery (red line) of lymphocytes from 3 experiments. Left graph shows results from stage 1 experiment, while right graph shows results including the stage 2 experiment. The stage 2 input sample was center (waste) output from stage 1 without any additional dilutions. Including both RBCs and WBCs, the device processed over cells per run.
FIG. 11.
Flow cytometry analysis of leukapheresis product purification under conditions identical to those shown in Fig. 10. Off refers to transducer off, and on is at operating power. “Center” and “Side” refer to device outlets from which the sample was collected. CD3+, CD19+, CD14+, and CD56+ were the markers used to identify T-cells, B-cells, monocytes, and NK-cells, respectively. Results are shown as percent of CD45+ cells, which is approximately comparable to percent WBCs. Final lymphocyte purity according to the hematology analyzer was 90%, which includes T-cells, B-cells, and NK-cells, but counts monocytes separately.
IV. DISCUSSION
The results presented in this work demonstrate that a thermoplastic device consisting of a parallel array of 12 channels can provide the performance necessary to achieve separation in blood solutions for high-throughput applications. The array is driven by a single piezoelectric transducer and features air gaps (slots) between the sidewalls of each channel. The benefit of the slots (design 4.2) was measured in a device containing four parallel channels when compared against a no-slot design (4.1 design). To distribute the sample uniformly to each of the parallel channels and to collect the separated fractions, the manifold leveraged branched and bifurcating designs developed previously by others for optimal flow of blood.30 We compared constant vs frequency-modulated oscillating drive of the transducer and found that the modulation of the frequency by 2% gave improved results. We used the device and the optimized drive conditions to purify lymphocytes from leukapheresis product at constant rate of 1 ml/min for 100 ml of sample, a rate and quantity that approaches the scale needed for use in breakthrough cell therapy processes.
We designed and compared two versions of the 12-channel device, based on channel cross-section dimensions we had used previously in single-channel acoustic separators. The cross-section dimensions that had performed better in a single channel device also performed better in the 12-channel array, where the performance was characterized by measuring the focusing (collective displacement) of RBCs vs throughput, with the transducer power held constant. This correspondence between the single-channel and 12-channel devices promises an efficient development method henceforth, where designs can be optimized or simulated as a single channel and then scaled out to parallel arrays. It also suggests that the coupling of the two ends of the channel to its neighbors, necessitated by the inlet and outlet manifolds, does not dramatically alter the acoustic resonance when compared to a single-channel device with free ends.
The mechanics of acoustic resonance in the plastic channels are still an area of experimental and theoretical investigation, and simplified design rules applicable for rigid materials such as silicon are not sufficient for plastic, where the acoustic impedance contrast is low between the plastic walls and the liquid.23,24,32 For example, the optimum frequency we identified for cell separation in these devices, as in the cited preceding publications, can be nearly a factor of two lower than what would be predicted by calculating the half wave resonance in the fluid in an idealized one-dimensional model. Therefore, we constrained this study to previously established plastic channel dimensions, but more efficient channel designs may perhaps be achieved once the fundamental mechanics of the plastic are further elucidated.
Along with channel cross-section dimensions, the width of the slots between them could prove to be a parameter for future optimization. Here, the slot width was chosen as the minimum that could be conveniently milled with our equipment, with the goal of keeping the overall dimensions of the device to a minimum. Although acoustic transmission across the air may be presumed to be negligible, in our design, the channels are still coupled to their neighbors by the continuous material at each end making up the manifold. This coupling could affect the resonance, and a future three-dimensional optimization of the entire system would be revealing.
We used a single plate transducer to excite all 12 channels. This has the advantage of simple construction of the transducer stage, simple electrical source requirements, and an excellent planarity (flatness) for uniform coupling with the device. A concern in constructing a multichannel device operated by a single transducer is the need for uniformity of the optimum focusing frequency among each of the channels. A device that had large variation in its resonance from one channel to the next would be impossible to tune for good separation. We addressed this by (1) the air gaps between channels, which may act to reduce spurious modes (Table II); (2) tight fabrication tolerances in channel cross section (Fig. 6); and (3) frequency modulation to compensate for the variation that did occur (Fig. 8). Others have noted benefits from FM in the bulk acoustic separation.33,34
Microfluidic blood cell separators have been reported previously to achieve high throughput.35 Direct comparisons of throughput among them are difficult due to variability in conditions and design such as outlet flow ratio, channel length, and starting sample concentration. However, to provide context for our device relative to others, the following examples are helpful. Mutlu et al. used a series of microscale islands in an array of wide channels for inertial separation and isolated WBCs from RBCs at a rate of about RBCs/h.36 Ohlsson et al. isolated bacterial cells from dilute whole blood using acoustophoresis in coflow with a single-channel silicon device at RBCs/h.37 Jonsson et al. developed an 8-channel parallel acoustic separator out of silicon that processed bovine RBCs/h and separated them from suspended lipids by means of 8 independent outlets.38 Additionally, Adams et al. designed a wide single channel coflow device with the acoustophoretic force acting out of plane, relative to the transducer surface, and deflected RBCs/h;39 however, it is unclear if the cells were separated from their media or if the whole sample was deflected. In comparison with these previous results, using the data from Fig. 7, here we process approximately RBCs/h at similar separation efficiency.
Though these devices show excellent separation of RBCs at high throughput, none address the more subtle discrimination of lymphocytes from the remaining WBCs. This separation is the objective of this paper because of its high value for blood processing in cell therapy. Currently, in autologous cell therapies such as chimeric antigen receptor T-cell (CAR-T) therapy, peripheral blood WBCs collected by leukapheresis are further purified by one or more of density gradient centrifugation, centrifugal elutriation, or magnetic separation. This purification step is often cited as both critical to the success of the final cell product and at the same time suffering from variability and poor yield.18,19 Acoustophoresis has previously shown success in purifying lymphocytes and high viability post process (98%), but at much lower flow rates (), in single-channel devices.17,22,26 Moreover, all of the compared acoustic separation devices use silicon and/or glass channel walls, which provide an advantage in acoustic efficiency, but could limit their applicability to high-volume manufacture of medical disposables because of cost of fabrication, especially where parallel arrays are needed for throughput.
The performance of the 12-channel device described here supports the concept that acoustophoretic microfluidic devices can be arrayed into parallel channels of still larger numbers and that the resulting throughput will be more or less a direct multiple of the throughput obtained in a single channel. The practical upper limits on throughput are more likely found in design of the inlet and outlet manifolds and in operating a transducer of large surface area. The transducer acts as a large capacitive load with low impedance, and conventional RF amplifiers are poorly matched to this load. In our case, even using a step-down transformer between the amplifier and the transducer, the actual electrical power delivered to the transducer was only about 10% of the amplifier output. We envision in the future a custom amplifier designed for this type of load. Where very large arrays of channels are desirable, a single transducer may no longer be practical, and arrays of individual transducers could be configured on a substrate to divide the load into smaller units and to avoid unused transducer surface area beneath the air gaps.
V. CONCLUSION
A high-throughput acoustic separation device having 12 parallel channels was fabricated from polystyrene and was used to purify lymphocytes from blood samples at flow rates and cell concentrations relevant for medical applications. Specifically, 100 ml of fresh leukapheresis product was processed to increase purity of lymphocytes from about 69% to over 91% at a rate of 1 ml/min. In other tests, purity as high as 95.2% was achieved, although with lower recovery. The method of arraying channels separated by air gaps between their sidewalls and exciting all of them with a single transducer appears sufficient for scaling bulk acoustophoretic separators. Employing frequency modulation allowed for a 3.4% enhancement in the separation performance, compared to constant frequency drive. These results suggest that an acoustic separator of this type could be developed into an instrument that would aid in laboratory purification of autologous blood samples for cell therapy applications.
SUPPLEMENTARY MATERIAL
See the supplementary material for further description of the image processing methods.
ACKNOWLEDGMENTS
We are grateful to our Draper colleagues Veronica Newlin, Chris Dibiasio, James Truslow, and Corey Juarez for assistance in the design of the inlet and outlet manifolds, and Kenneth Kotz and Jenna Balestrini for helpful discussions on cell therapy applications and blood processing.
REFERENCES
- 1.Hawkes J. J., Barber R. W., Emerson D. R., and Coakley W. T., Lab Chip 4, 446 (2004). 10.1039/b408045a [DOI] [PubMed] [Google Scholar]
- 2.Petersson F., Nilsson A., Holm C., Jonsson H., and Laurell T., Analyst 129, 938 (2004). 10.1039/B409139F [DOI] [PubMed] [Google Scholar]
- 3.Carugo D., Octon T., Messaoudi W., Fisher A. L., Carboni M., Harris N. R., Hill M., and Glynne-Jones P., Lab Chip 14, 3830 (2014). 10.1039/C4LC00577E [DOI] [PubMed] [Google Scholar]
- 4.Leibacher I., Schatzer S., and Dual J., Lab Chip 14, 463 (2014). 10.1039/C3LC51109J [DOI] [PubMed] [Google Scholar]
- 5.Evander M., Johansson L., Lilliehorn T., Piskur J., Lindvall M., Johansson S., Almqvist M., Laurell T., and Nilsson J., Anal. Chem. 79, 2984 (2007). 10.1021/ac061576v [DOI] [PubMed] [Google Scholar]
- 6.Hultstrom J., Manneberg O., Dopf K., Hertz H. M., Brismar H., and Wiklund M., Ultrasound Med. Biol. 33, 145 (2007). 10.1016/j.ultrasmedbio.2006.07.024 [DOI] [PubMed] [Google Scholar]
- 7.Iranmanesh I., Ramachandraiah H., Russom A., and Wiklund M., RSC Adv. 5, 74304 (2015). 10.1039/C5RA16865A [DOI] [Google Scholar]
- 8.Garg N., Westerhof T. M., Liu V., Liu R., Nelson E. L., and Lee A. P., Microsyst. Nanoeng. 4, 17085 (2018). 10.1038/micronano.2017.85 [DOI] [Google Scholar]
- 9.Shi J., Mao X., Ahmed D., Colletti A., and Huang T. J., Lab Chip 8, 221 (2008). 10.1039/B716321E [DOI] [PubMed] [Google Scholar]
- 10.Collins D. J., Morahan B., Garcia-Bustos J., Doerig C., Plebanski M., and Neild A., Nat. Commun. 6, 8686 (2015). 10.1038/ncomms9686 [DOI] [PMC free article] [PubMed] [Google Scholar]
- 11.Wu M., Ouyang Y., Wang Z., Zhang R., Huang P.-H., Chen C., Li H., Li P., Quinn D., Dao M., Suresh S., Sadovsky Y., and Huang T. J., Proc. Natl. Acad. Sci. 114, 10584–10589 (2017). 10.1073/pnas.1709210114 [DOI] [PMC free article] [PubMed] [Google Scholar]
- 12.Townsend R. J., Hill M., Harris N. R., and White N. M., Ultrasonics 42, 319 (2004). 10.1016/j.ultras.2004.01.025 [DOI] [PubMed] [Google Scholar]
- 13.Augustsson P., Barnkob R., Wereley S. T., Bruus H., and Laurell T., Lab Chip 11, 4152 (2011). 10.1039/c1lc20637k [DOI] [PubMed] [Google Scholar]
- 14.Hagsater S. M., Jensen T. G., Bruus H., and Kutter J. P., Lab Chip 7, 1336 (2007). 10.1039/b704864e [DOI] [PubMed] [Google Scholar]
- 15.Barnkob R., Augustsson P., Grenvall C., Deierborg T., Brundin P., Bruus H., and Laurell T., in Proceedings of 14th MicroTAS 2010 (Chemical and Biological Microsystems Society, 2010), pp. 1337–1339.
- 16.Barnkob R., Augustsson P., Laurell T., and Bruus H., Lab Chip 10, 563 (2010). 10.1039/b920376a [DOI] [PubMed] [Google Scholar]
- 17.Augustsson P., Karlsen J. T., Su H. W., Bruus H., and Voldman J., Nat. Commun. 7, 11556 (2016). 10.1038/ncomms11556 [DOI] [PMC free article] [PubMed] [Google Scholar]
- 18.Fesnak A. D., Hanley P. J., and Levine B. L., Curr. Hematol. Malig. Rep. 12, 335 (2017). 10.1007/s11899-017-0395-9 [DOI] [PMC free article] [PubMed] [Google Scholar]
- 19.Sadelain M., Riviere I., and Riddell S., Nature 545, 423 (2017). 10.1038/nature22395 [DOI] [PMC free article] [PubMed] [Google Scholar]
- 20.Settnes M. and Bruus H., Phys. Rev. E 85, 016327 (2012). 10.1103/PhysRevE.85.016327 [DOI] [PubMed] [Google Scholar]
- 21.Barnkob R. and Bruus H., Proc. Meet. Acoust. 6, 020001 (2009). 10.1121/1.3186746 [DOI] [Google Scholar]
- 22.Lissandrello C., Dubay R., Kotz K. T., and Fiering J., SLAS Technol. 23, 352 (2018). 10.1177/2472630317749944 [DOI] [PubMed] [Google Scholar]
- 23.Mueller A., Lever A., Nguyen T. V., Comolli J., and Fiering J., J. Micromech. Microeng. 23, 125006 (2013). 10.1088/0960-1317/23/12/125006 [DOI] [Google Scholar]
- 24.Silva R., Dow P., Dubay R., Lissandrello C., Holder J., Densmore D., and Fiering J., Biomed. Microdevices 19, 70 (2017). 10.1007/s10544-017-0210-3 [DOI] [PubMed] [Google Scholar]
- 25.Grenvall C., Magnusson C., Lilja H., and Laurell T., Anal. Chem. 87, 5596 (2015). 10.1021/acs.analchem.5b00370 [DOI] [PMC free article] [PubMed] [Google Scholar]
- 26.Urbansky A., Ohlsson P., Lenshof A., Garofalo F., Scheding S., and Laurell T., Sci. Rep. 7, 17161 (2017). 10.1038/s41598-017-17200-9 [DOI] [PMC free article] [PubMed] [Google Scholar]
- 27.Barber R. W. and Emerson D. R., Microfluid. Nanofluidics 4, 179 (2007). 10.1007/s10404-007-0163-6 [DOI] [Google Scholar]
- 28.Emerson D. R., Cieslicki K., Gu X., and Barber R. W., Lab Chip 6, 447 (2006). 10.1039/b516975e [DOI] [PubMed] [Google Scholar]
- 29.Zografos K., Barber R. W., Emerson D. R., and Oliveira M. S. N., Microfluid. Nanofluidics 19, 737 (2015). 10.1007/s10404-015-1598-9 [DOI] [Google Scholar]
- 30.Kniazeva T., Epshteyn A. A., Hsiao J. C., Kim E. S., Kolachalama V. B., Charest J. L., and Borenstein J. T., Lab Chip 12, 1686 (2012). 10.1039/c2lc21156d [DOI] [PMC free article] [PubMed] [Google Scholar]
- 31.Sethu P., Sin A., and Toner M., Lab Chip 6, 83 (2006). 10.1039/B512049G [DOI] [PubMed] [Google Scholar]
- 32.Moiseyenko R. P. and Bruus H., Phys. Rev. Appl. 11, 014014 (2019). 10.1103/PhysRevApplied.11.014014 [DOI] [Google Scholar]
- 33.Iranmanesh I., Barnkob R., Bruus H., and Wiklund M., in Proceedings of 17th MicroTAS (Chemical and Biological Microsystems Society, 2013) pp. 1400–1402.
- 34.Leibacher I., Schoendube J., Dual J., Zengerle R., and Koltay P., Biomicrofluidics 9, 024109 (2015). 10.1063/1.4916780 [DOI] [PMC free article] [PubMed] [Google Scholar]
- 35.Antfolk M. and Laurell T., Anal. Chim. Acta 965, 9 (2017). 10.1016/j.aca.2017.02.017 [DOI] [PubMed] [Google Scholar]
- 36.Mutlu B. R., Smith K. C., Edd J. F., Nadar P., Dlamini M., Kapur R., and Toner M., Sci. Rep. 7, 9915 (2017). 10.1038/s41598-017-10295-0 [DOI] [PMC free article] [PubMed] [Google Scholar]
- 37.Ohlsson P., Petersson K., Augustsson P., and Laurell T., Sci. Rep. 8, 9156 (2018). 10.1038/s41598-018-25551-0 [DOI] [PMC free article] [PubMed] [Google Scholar]
- 38.Jonsson H., Holm C., Nilsson A., Petersson F., Johnsson P., and Laurell T., Ann. Thorac. Surg. 78, 1572 (2004). 10.1016/j.athoracsur.2004.04.071 [DOI] [PubMed] [Google Scholar]
- 39.Adams J. D., Ebbesen C. L., Barnkob R., Yang A. H. J., Soh H. T., and Bruus H., J. Micromech. Microeng. 22, 075017 (2012). 10.1088/0960-1317/22/7/075017 [DOI] [Google Scholar]
Associated Data
This section collects any data citations, data availability statements, or supplementary materials included in this article.
Supplementary Materials
See the supplementary material for further description of the image processing methods.


