

Summary
In mitosis, cells inactivate DNA double-strand break (DSB) repair pathways to preserve genome stability. However, some early signaling events still occur, such as recruitment of the scaffold protein MDC1 to phosphorylated histone H2AX at DSBs. Yet, it remains unclear whether these events are important for maintaining genome stability during mitosis. Here, we identify a highly conserved protein-interaction surface in MDC1 that is phosphorylated by CK2 and recognized by the DNA-damage response mediator protein TOPBP1. Disruption of MDC1-TOPBP1 binding causes a specific loss of TOPBP1 recruitment to DSBs in mitotic but not interphase cells, accompanied by mitotic radiosensitivity, increased micronuclei, and chromosomal instability. Mechanistically, we find that TOPBP1 forms filamentous structures capable of bridging MDC1 foci in mitosis, indicating that MDC1-TOPBP1 complexes tether DSBs until repair is reactivated in the following G1 phase. Thus, we reveal an important, hitherto-unnoticed cooperation between MDC1 and TOPBP1 in maintaining genome stability during cell division.
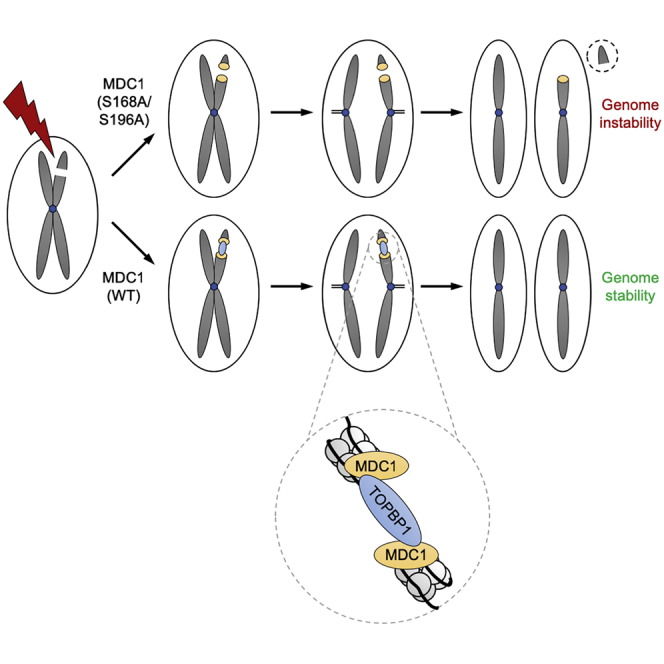
Graphical Abstract
Highlights
-
•
MDC1 recruits TOPBP1 to DNA double-strand breaks specifically in mitosis
-
•
MDC1, when phosphorylated on S168 and S196, directly binds TOPBP1 BRCT domains 1 and 2
-
•
Loss of MDC1-TOPBP1 binding causes mitotic radiosensitivity and genome instability
-
•
TOPBP1 forms filamentous assemblies that can bridge MDC1 foci in mitosis
Leimbacher et al. reveal that two DNA damage-response mediator proteins, MDC1 and TOPBP1, form a complex required for maintaining chromosome stability when DNA double-strand breaks occur during mitosis, possibly by tethering broken chromosomes together until DNA-repair pathways are reactivated in the following G1 phase.
Introduction
DNA double-strand breaks (DSBs) are particularly toxic DNA lesions that must be repaired accurately in order to avoid genome instability, cell death, or cancer (Jackson and Bartek, 2009). Interphase cells respond to DSBs by triggering a signaling cascade to activate cell-cycle checkpoints and DNA repair. In contrast, in mitotic cells there is no DNA damage checkpoint after prophase (Rieder and Cole, 1998), and DSBs are transmitted into the following G1 phase for repair to avoid chromosomal instability (Lee et al., 2014, Orthwein et al., 2014).
The cellular response to DSBs is regulated by three related protein kinases, ataxia-telangiectasia mutated (ATM), ATM and Rad3-related (ATR), and DNA-dependent protein kinase (DNA-PK) (Blackford and Jackson, 2017). Upon DNA damage, one of the earliest substrates of these kinases is the histone variant H2AX, which is phosphorylated at DSB sites on Ser139 and then referred to as γH2AX (Rogakou et al., 1999). γH2AX is recognized by MDC1 (Stucki et al., 2005), a scaffold protein that acts as a platform for recruitment of various DNA damage response factors to mediate DNA repair. One of these is the MRE11-RAD50-NBS1 (MRN) complex, which binds to MDC1 via a direct interaction between the NBS1 subunit of MRN and multiple acidic sequence motifs near the N terminus of MDC1 (Chapman and Jackson, 2008, Hari et al., 2010, Melander et al., 2008, Spycher et al., 2008, Wu et al., 2008). Another is RNF8, an E3 ubiquitin ligase with an FHA domain that binds to a cluster of conserved threonine residues in MDC1 that are phosphorylated by ATM in response to DSBs to promote chromatin ubiquitylation events required for recruitment of DNA damage response mediator proteins such as 53BP1 and BRCA1 (Huen et al., 2007, Kolas et al., 2007, Mailand et al., 2007). Recruitment of these factors to chromatin-flanking DSB sites channels DNA repair into either the non-homologous end-joining pathway or homology-directed repair via mechanisms that are still not completely understood (Hustedt and Durocher, 2016).
γH2AX and MDC1 form foci at DSBs throughout the cell cycle, but recruitment of downstream factors such as RNF8 and 53BP1 is blocked during mitosis (Giunta et al., 2010, Nakamura et al., 2010, Nelson et al., 2009, van Vugt et al., 2010, Lee et al., 2014, Orthwein et al., 2014). However, given that inhibition of ATM and DNA-PK activity in mitosis causes radiosensitivity, it is possible that DNA damage signaling as well as recruitment of MDC1 and potentially some of its downstream factors, play an as-yet unidentified role in dealing with DNA damage in this cell-cycle phase.
Here, we identify two highly conserved motifs in MDC1 and show that they are phosphorylated by casein kinase 2 (CK2). We identify the DNA damage response mediator protein TOPBP1 as the binding partner for these motifs and demonstrate that the MDC1-TOPBP1 interaction is specifically required for TOPBP1 recruitment to DSBs in mitosis. Loss of MDC1-TOPBP1 binding leads to radiosensitivity in mitotic cells, as well as increased micronuclei formation, chromosome/chromatid breaks, and chromosome end-to-end fusions.
Results
A Conserved Acidic Sequence Motif near the N Terminus of MDC1 Binds to TOPBP1
Previously, we and others identified six conserved acidic sequence motifs near the N terminus of MDC1 that directly interact with NBS1 and are required for MRN foci formation at sites of DSBs (Chapman and Jackson, 2008, Melander et al., 2008, Spycher et al., 2008, Wu et al., 2008). These motifs contain Ser-Asp-Thr residues embedded in an acidic sequence environment; hence, they have been named SDT motifs (Figure 1A). The serine and threonine residues within the SDT motifs are constitutively phosphorylated by CK2, and the unique bivalent N-terminal FHA/BRCT2 phospho-binding module of NBS1 specifically recognizes and binds to the doubly phosphorylated MDC1 SDT motifs (Hari et al., 2010, Lloyd et al., 2009).
Figure 1.

A Conserved Acidic Sequence Motif near the N Terminus of MDC1 Binds to TOPBP1
(A) Schematic showing the layout of conserved domains and motifs in MDC1. Names of the known MDC1 binding partners, NBS1, RNF8, and H2AX, are shown below the motifs with which they interact. The FHA domain promotes MDC1 dimerization; hence, its binding partner is MDC1. Key phosphorylated residues are highlighted in bold.
(B) Identification of TOPBP1 as a specific interactor for the MDC1-S196 phosphopeptide by LC-MS/MS and label-free quantification. Scatterplot depicts log2 fold enrichment of MDC1-S196 versus MDC1-pS196 peptide-binding proteins from 2 independent experiments. See Table S1 for raw MS data.
(C) Peptide pull-downs from HeLa nuclear extracts using biotinylated peptides corresponding to residues surrounding MDC1-S196, either native (S196) or phosphorylated (pS196).
(D) HA immunoprecipitations from 293FT cells transfected with the indicated HA-tagged MDC1 variants.
As part of an ongoing screen to identify and characterize short evolutionarily conserved linear peptide motifs mediating protein-protein interactions in the DNA damage response, we noticed one such potentially novel sequence in MDC1. Centered around S196, it is located downstream of the FHA domain and just upstream of the first SDT repeat (Figure 1A). This motif is highly conserved in MDC1 orthologs and is composed of a Val/Ile-Pro-Glu-Ser consensus followed by a stretch of acidic amino acids in vertebrate MDC1. Given that S196 is phosphorylated in human cells (Yi et al., 2014), we considered the possibility that the S196 motif constitutes a previously uncharacterized interaction surface for a DNA damage response factor with phosphopeptide-binding activity.
To test this possibility, we designed a synthetic biotinylated peptide corresponding to human MDC1 residues 180–205, bearing a phospho-serine at the S196 position. This phosphopeptide and its native equivalent were conjugated to streptavidin-coupled beads and incubated in HeLa nuclear extracts, and potential interacting partners were identified from two independent experiments by liquid chromatography-tandem mass spectrometry (LC-MS/MS; Table S1). When we examined proteins present only in the phospho-MDC1 peptide pull-downs, TOPBP1 was identified as the top hit (Figure 1B), which, given that it contains multiple BRCT domains that specifically recognize and bind phosphorylated proteins and was previously implicated in MDC1 binding (Blackford et al., 2015, Leung and Glover, 2011, Wang et al., 2011), we decided to pursue further.
Western blotting confirmed that TOPBP1 was specifically pulled down by the phosphorylated S196 peptide (Figure 1C). NBS1, on the other hand, previously shown to interact efficiently with doubly phosphorylated SDT phosphopeptides (Chapman and Jackson, 2008, Lloyd et al., 2009, Spycher et al., 2008), was not pulled down by either S196 peptide. These findings reveal a hitherto unnoticed TOPBP1 interaction site near the N terminus of MDC1 that is functionally distinct from the SDT repeats.
We next investigated whether S196 is required for MDC1-TOPBP1 interaction in the context of full-length MDC1. To do this, we mutated S196 to alanine in constructs expressing hemagglutinin (HA)-tagged wild-type (WT) MDC1 or a mutant MDC1 that cannot bind NBS1 due to alanine substitutions in all six SDT repeats (12A; Melander et al., 2008). Immunoprecipitation with HA affinity beads showed that the MDC1-S196A mutation abolished TOPBP1 binding whereas interaction with NBS1 remained intact (Figure 1D). In contrast, the MDC1-12A mutant was completely defective for NBS1 binding but could still interact with TOPBP1, whereas the double MDC1-S196A+12A mutant could bind to neither. We conclude from these results that MDC1 binding to TOPBP1 and NBS1 can be functionally separated, and that MDC1-TOPBP1 binding is mediated by the novel MDC1-S196 motif and not by the SDT repeats.
BRCT Domains 1 and 2 of TOPBP1 Interact with MDC1
TOPBP1 contains 9 BRCT domains, some of which occur in tandem, whereas others appear to function as single domains (Figure 2A). Of the BRCT domains in TOPBP1, only 1, 2, 5, and 7 contain the necessary lysine residues required for phosphopeptide binding (Leung and Glover, 2011). In line with this, BRCT0–2 interact with phosphorylated RAD9 or Treslin (Delacroix et al., 2007, Kumagai et al., 2010, Lee et al., 2007), BRCT4+5 bind to phosphorylated 53BP1 or BLM (Blackford et al., 2015, Cescutti et al., 2010), and BRCT7+8 interact with phosphorylated FANCJ (Gong et al., 2010).
Figure 2.

BRCT Domains 1 and 2 of TOPBP1 Interact with MDC1 via Two Phosphorylated Residues, Ser168 and Ser196
(A) Schematic showing the layout of conserved domains and motifs in TOPBP1. Numbered boxes represent BRCT domains, with phosphopeptide-binding domains in green and domains lacking phosphopeptide-binding activity in gray. Names of known TOPBP1 binding partners are shown below the domains they interact with. AAD = ATR-activation domain.
(B) GFP pull-downs from 293FT cells transfected with the indicated GFP-tagged TOPBP1 constructs.
(C) Sequence alignment showing the conservation of Ser168, Ser196, and surrounding residues in MDC1 in vertebrates. Key phospho-serines are highlighted in bold.
(D) HA-immunoprecipitations from 293FT cells transfected with the indicated HA-tagged MDC1 variants.
(E) Fluorescence polarization with recombinant TOPBP1 BRCT domains 0–2 and MDC1-pS168 phosphopeptide. K155E is a mutation in TOPBP1 BRCT domain 1; K250E is a mutation in BRCT domain 2. ND = not determined. Dotted line indicates threshold for specific protein-protein interactions.
(F) Fluorescence polarization with recombinant TOPBP1 BRCT domains 0–2 and MDC1-pS196 phosphopeptide.
See also Figure S1.
Previously, we found that TOPBP1 interacts with MDC1 in a manner dependent on BRCT1 but not BRCT5 or BRCT7 (Blackford et al., 2015). However, the requirement for BRCT2 was not tested. Therefore, we mutated K250 in BRCT2 to alanine in GFP-tagged full-length TOPBP1 and compared it in co-immunoprecipitation experiments to the BRCT1 mutant we generated previously. As a control in these assays, we also included a mutant BRCT5 construct, because this domain interacts with BLM but not MDC1 (Blackford et al., 2015). As demonstrated previously, mutation of TOPBP1 BRCT1 abolished interaction with MDC1 and RAD9 but not BLM, whereas mutation of BRCT5 had no effect on MDC1 but BLM binding was lost (Figure 2B). Surprisingly, mutation of BRCT2 also abolished MDC1 binding, while leaving BLM and RAD9 unaffected. This suggested the existence of an additional TOPBP1 binding site in MDC1. Indeed, a conserved motif consisting of a serine residue (S168 in human MDC1) embedded in an acidic sequence environment is located just upstream of S196 (Figure 2C). Like S196, S168 was previously shown to be phosphorylated (Beausoleil et al., 2004). As this sequence motif strikingly resembles the TOPBP1-BRCT1 interaction site in RAD9 (Delacroix et al., 2007, Lee et al., 2007) (Figure S1A), we tested whether it functions as an additional TOPBP1 binding site in MDC1. Indeed, MDC1-S168A mutants were completely defective for TOPBP1 interaction and no further decrease in binding was observed for a S168A/S196A double mutant (Figure 2D). This suggested that the two phospho-binding sites in BRCT1 and BRCT2 of TOPBP1 directly contact phosphorylated S168 and S196 in MDC1. However, it remained unclear which BRCT domain of TOPBP1 contacts which phospho-epitope in MDC1. To fine-map the TOPBP1 interaction sites in MDC1, we assessed the binding affinity of S168 and S196 phosphopeptides for purified TOPBP1 BRCT0–2 by fluorescence polarization. This quantitative biophysical analysis revealed that purified TOPBP1 BRCT0–2 strongly binds to S168 and S196 phosphopeptides with an apparent dissociation constant (Kd) of less than 1 μM (Figure 2E). Interestingly, a K155E (BRCT1) mutant did not bind to the S168 phosphopeptide, indicating that BRCT1 mainly contacts the phosphorylated S168 motif. In contrast, both K155E and K250E (BRCT2) mutants were partially defective for binding to the phosphorylated S196 peptide, suggesting reduced specificity for TOPBP1 binding to this motif (Figure 2F). In contrast, MDC1-SDT phosphopeptides did not bind with significant affinity to either purified BRCT0–2 or BRCT4+5 (Figure S1B). These data support a model in which TOPBP1 BRCT1 interacts with phosphorylated S168 of MDC1, whereas BRCT2 most likely docks with phosphorylated S196.
MDC1 Phosphorylation and TOPBP1 Binding Are Mediated by CK2
Next, we wished to determine the kinase responsible for phosphorylation of MDC1 on S168 and S196. Both motifs are highly acidic and conform to the preferred Ser/Thr-x-x-Asp/Glu consensus sequence for CK2 (Meggio and Pinna, 2003). Therefore, we generated antibodies that specifically recognize phosphorylated MDC1-pS168 or MDC1-pS196 (Figure 3A) and then used them to examine the effect on MDC1 phosphorylation of treating cells with the selective CK2 inhibitor CX-4945 (Siddiqui-Jain et al., 2010). Results from this experiment indicated that S168 and S196 phosphorylation are CK2 dependent, because phosphorylation of both sites was abolished upon CX-4945 treatment (Figure 3B) but still occurred in cells treated with inhibitors of ATM, ATR, DNA-PK, or PLK1 (Figures S2A–S2D). Furthermore, CX-4945 did not affect DNA damage signaling events mediated by these kinases (Figure S2E). In addition, the interaction between MDC1 and TOPBP1 was undetectable in cells treated with the CK2 inhibitor (Figure 3C). To confirm the CK2-dependent interaction in vitro, we established that recombinant CK2 could directly phosphorylate a GST-tagged MDC1 fragment purified from E. coli, specifically on S168 and S196 (Figure 3D). Next, GST-pull-down experiments were carried out with this fragment and its mutant derivatives. The WT MDC1 fragment (containing the S168 and S196 motifs as well as two SDT repeats) pulled down significant quantities of TOPBP1 and NBS1 from HeLa nuclear extract only when pre-incubated with recombinant CK2 and ATP. In line with our data above, incorporation of the S196A mutation into the GST-MDC1 fragment abolished interaction with TOPBP1 (Figure 3E). Furthermore, mutation of the SDT repeats (SDT > ADA) abolished NBS1 but not TOPBP1 binding. Taken together, we conclude that CK2 phosphorylation of MDC1 on both S168 and S196 is required for direct binding to TOPBP1.
Figure 3.

MDC1 Phosphorylation and TOPBP1 Binding Are Mediated by CK2
(A) HA-immunoprecipitations from 293FT cells transfected with the indicated constructs.
(B) 293FT cells treated with 10 μM CK2 inhibitor CX-4945 were harvested for western blotting with the indicated antibodies. AKT-pS129 is a positive control as AKT is a known CK2 substrate (Siddiqui-Jain et al., 2010).
(C) GFP pull-downs from 293FT cells transfected with the indicated GFP-tagged TOPBP1 constructs and treated with 10 μM CK2 inhibitor CX-4945 or DMSO vehicle control.
(D) Western blots of an in vitro kinase assay with recombinant CK2 as the kinase, and GST-tagged MDC1 fragment (encompassing residues 109–330) or GST alone as substrates.
(E) GST pull-downs from HeLa nuclear extracts with WT and mutant versions of GST-tagged MDC1 fragment (encompassing residues 109–330), preincubated or not with recombinant CK2 and ATP.
See also Figure S2.
Direct Interaction with MDC1 Is Essential for TOPBP1 Recruitment to DSBs in Mitotic Cells
Next, we sought to investigate the biological role of the MDC1-TOPBP1 interaction. To this end, we knocked out endogenous MDC1 in the human osteosarcoma cell line U2OS using CRISPR-Cas9 (henceforth termed ΔMDC1; Figures 4A and 4B). ΔMDC1 cells do not display a general ATM or ATR signaling defect in response to ionizing radiation (IR) but are, as expected, unable to recruit NBS1 and 53BP1 to IR-induced foci (Figures 4B and 4C). In addition, γH2AX foci intensity is reduced in ΔMDC1 cells (Figure 4D), consistent with previous reports (Lou et al., 2006, Stewart et al., 2003, Stucki et al., 2005). We also found that western blot signals from our phospho-specific MDC1-pS168 and -pS196 antibodies were absent in ΔMDC1 cells, as expected (Figure 4E).
Figure 4.

MDC1 Is Required for TOPBP1 Recruitment to Sites of DSBs in G1 Phase Cells
(A) Schematic representation of the human MDC1 gene locus, illustrating the hybridization site of the gRNA selected for the generation of ΔMDC1 cell line used in this study (gRNA sequence in the Key Resources Table).
(B) Western blots of total cell extract of irradiated WT U2OS cells and ΔMDC1 cells showing that the ATM and ATR pathways are normally activated in the knock-out cell line in response to IR (3 Gy).
(C) Immunofluorescence experiment of irradiated WT U2OS cells and ΔMDC1 cells stained with NBS1 and 53BP1 antibodies. Cells were co-stained with MDC1 antibodies to show lack of MDC1 expression in the knock-out cell line.
(D) Quantitative assessment of γH2AX foci in irradiated WT U2OS cells and ΔMDC1 cells (box and whiskers represent minimum to maximum and individual data points are also shown; t test, α = 0.05, at least 130 cells per condition).
(E) Western blot showing no signal with the MDC1-pS168 and -pS196 phospho-specific antibodies in ΔMDC1 cells. NBS1 is a loading control.
(F) Immunofluorescence experiment of WT U2OS cells, ΔMDC1 cells, and Δ53BP1 cells stained with TOPBP1 antibodies 3 h after IR (3 Gy). Cells were co-stained with Cyclin A antibodies to distinguish G1 phase from S/G2 phase cells.
(G) Immunofluorescence experiment of irradiated WT U2OS cells and Δ53BP1 G1 cells stained with MDC1 and TOPBP1 antibodies 3 h after IR (3 Gy).
All scale bars represent 10 μm. See also Figure S3.
Using WT U2OS, ΔMDC1, and Δ53BP1 cells (Orthwein et al., 2015), we found that the TOPBP1 foci pattern induced by IR varies during the cell cycle (Figure 4F), with large foci that colocalize with γH2AX forming in G1 phase cells, and smaller foci that colocalize with the single-stranded DNA (ssDNA)-binding protein complex RPA forming in S/G2 phase cells. Moreover, the large TOPBP1 foci in G1 phase cells, but not the small S/G2 phase foci, were dependent on both MDC1 and 53BP1 (Figures 4F and S3A; Cescutti et al., 2010). Next, we addressed the question of whether MDC1 can recruit TOPBP1 in the absence of 53BP1 in G1 phase cells. While all IR-induced TOPBP1 foci were absent from MDC1-deficient G1 phase cells, TOPBP1 foci that colocalize with MDC1 could still be observed in Δ53BP1 cells, although they are much smaller than those observed in WT cells (Figure 4G).
To assess the contribution of the MDC1-TOPBP1 interaction to TOPBP1 foci formation, we stably transfected ΔMDC1 cells with GFP-tagged WT MDC1, three TOPBP1 interaction mutants (S168A, S196A, and a S168A/S196A double mutant), and the RNF8 interaction mutant TQXF > AQXF that cannot promote 53BP1 recruitment (Huen et al., 2007, Kolas et al., 2007, Mailand et al., 2007; Figure S3B). Visual inspection of these cells revealed IR-dependent accumulation of MDC1 and TOPBP1 in foci but did not show any apparent difference between cells expressing WT MDC1 and cells expressing the TOPBP1 binding mutants. In contrast, cells expressing the MDC1 TQXF > AQXF mutant were defective in forming TOPBP1 foci in G1 phase cells (Figure 5A). This indicated that TOPBP1 binding to MDC1 is not required for its efficient recruitment to sites of DSBs in interphase and suggested that TOPBP1 is predominately recruited by the RNF8-RNF168-53BP1 pathway. However, a more quantitative assessment of TOPBP1 foci formation by computer-aided segmentation and quantification of subcellular shapes (SQUASSH; Rizk et al., 2014) revealed a mild but significant reduction in MDC1-TOPBP1 colocalization in cells expressing the TOPBP1 binding mutants (Figures 5B, S3C, and S3D). These data suggest that while interaction with MDC1 mildly contributes to TOPBP1 accumulation in G1 phase cells, the RNF8-RNF168-53BP1 axis plays a much more dominant role. In addition, these data also suggest that despite its ability to form a stable complex with TOPBP1 in vitro, MDC1 is not able to substitute fully for 53BP1 as a TOPBP1 adaptor in G1 phase cells.
Figure 5.

Direct Interaction with MDC1 Is Essential for TOPBP1 Recruitment to DSBs in Mitotic Cells
(A) Confocal microscopy of U2OS cells expressing GFP-tagged MDC1 WT and mutants 3 h after treatment with 3 Gy IR.
(B) Quantitative analysis of GFP-MDC1 and TOPBP1 colocalization by SQUASSH. Upper graph: object number colocalization (fraction of objects in each channel that overlap ≥50%). Lower graph: object size colocalization (area of object overlap divided by total object area). Each data point represents one cell (n = 10); bars represent the mean. One-way ANOVA and Dunnett’s multiple comparison test were performed to test for difference of WT versus mutants. All mutant cell lines are significantly different from WT (p ≤ 0.0006).
(C) Confocal microscopy of U2OS cells arrested in mitosis by nocodazole (100 ng/mL) and treated with 0.5 Gy IR.
(D) Confocal microscopy of U2OS ΔMDC1 and Δ53BP1 cells arrested in mitosis by nocodazole (100 ng/mL) and treated with 0.5 Gy IR.
(E) Quantitative analysis of TOPBP1-γH2AX colocalization in ΔMDC1 and Δ53BP1 cells by SQUASSH. Each data point represents one cell (n = 8); bars represent the mean.
(F) Confocal microscopy of U2OS cells expressing GFP-tagged MDC1 WT and mutants, arrested in mitosis by nocodazole (100 ng/mL) 1 h after treatment with 0.5 Gy IR.
(G) Quantitative analysis of GFP-MDC1 and TOPBP1 colocalization by SQUASSH. Upper graph: object number colocalization. Lower graph: object size colocalization. Each data point represents one cell (n = 10); bars represent the mean.
All scale bars represent 10 μm. See also Figure S3.
Next, because 53BP1 foci do not form during mitosis (Giunta et al., 2010, Nakamura et al., 2010, Nelson et al., 2009, van Vugt et al., 2010), we explored TOPBP1 recruitment to DSB sites in mitotic cells. After IR, TOPBP1 readily accumulates in foci that colocalize with γH2AX and MDC1 on mitotic chromosomes, both in U2OS cells and in the non-transformed human retinal pigmented epithelial cell line RPE-1 (Figures 5C and S3E). Significantly, while TOPBP1 foci formation on mitotic chromosomes was still dependent on γH2AX and MDC1, it occurred independently of 53BP1 (Figures 5D, 5E, and S3E). These observations suggested that, in contrast to G1 phase cells, MDC1 may recruit TOPBP1 to sites of DSBs directly in mitosis, through phosphorylation-dependent interactions with the S168 and S196 motifs. Indeed, foci containing the MDC1 mutant versions that are defective for TOPBP1 interaction were devoid of TOPBP1 on mitotic chromosomes, while expression of WT MDC1 in ΔMDC1 cells fully restored TOPBP1 foci (Figures 5F and 5G). Consistent with our observation that TOPBP1 foci on mitotic chromosomes form independently of 53BP1, the TQXF > AQXF RNF8 binding mutant also rescued TOPBP1 foci in mitosis (Figures 5F and 5G). Finally, in line with our interpretation that MDC1 recruits TOPBP1 by direct interaction predominantly in mitosis, mutation of BRCT1 or BRCT2, but not BRCT5 or BRCT7, in GFP-tagged full-length TOPBP1 led to defective foci formation in mitosis (Figure S3F). In summary, these data reveal an unexpected complexity in the TOPBP1 recruitment mechanism to sites of DSBs: MDC1 controls TOPBP1 foci both in G1 phase and in mitosis, but only in mitosis does it primarily mediate TOPBP1 recruitment through direct interaction, as in G1 phase cells MDC1 predominantly controls TOPBP1 accumulation indirectly via the RNF8-RNF168-53BP1 axis.
MDC1-TOPBP1 Interaction Is Required for Maintenance of Chromosomal Stability during Mitosis
Next, we addressed the physiological consequences for cells lacking MDC1-TOPBP1 binding. First, given its specific role in the recruitment of TOPBP1 to sites of DSBs in mitosis, we sought to test whether protecting cells from the killing effects of DSBs acquired during mitosis may be a major physiological role of the MDC1-TOPBP1 interaction. Therefore, we synchronized parental U2OS, ΔMDC1 cells, and ΔMDC1 cells stably expressing GFP-tagged WT MDC1 or TOPBP1 binding mutants in mitosis and treated them with IR. ΔMDC1 and MDC1-S168A/S196A-expressing mitotic cells, but not interphase cells, displayed marked radiosensitivity compared to WT MDC1-expressing cells (Figures 6A and S4A). To explore whether disruption of the MDC1-TOPBP1 interaction negatively affects DSB repair in the subsequent interphase after irradiation in mitosis, we synchronized parental U2OS, ΔMDC1 cells, and ΔMDC1 cells stably expressing WT MDC1 or TOPBP1 binding mutants in mitosis before irradiating them. As a marker for unrepaired DSBs, γH2AX foci were quantified 20 min, 6 h, and 24 h post-irradiation. There was a significant increase in residual γH2AX foci in cells expressing no MDC1 or the TOPBP1 binding mutants 24 h post-irradiation compared to cells expressing WT MDC1, indicating that in the absence of TOPBP1 recruitment in mitosis, a substantial number of DSBs are not repaired within this time period (Figure 6B).
Figure 6.

The MDC1-TOPBP1 Interaction Promotes Genome Stability during Mitosis
(A) Clonogenic survival assay of mitotic and interphase U2OS, ΔMDC1, and ΔMDC1 cells stably transfected with MDC1 WT and TOPBP1 binding mutants (mean of 3 independent experiments; error bars: ±SD).
(B) Quantification of background γH2AX (−IR) and residual γH2AX foci 20 min, 6 h, and 24 h after irradiation of mitotic cells and subsequent release from mitotic arrest (red bars represent the mean; n = 3). One-way ANOVA and Dunnett’s multiple comparison test were performed for the 24 h time point to test for difference of the mean of ΔMDC1 versus complemented cell lines.
(C) Quantification of micronuclei formation 4 h after irradiation of mitotic cells and subsequent release from mitotic arrest (bars represent mean ± SD, n = 3, unpaired t test, α = 0.05, at least 1,000 cells per condition).
(D) Quantification of micronuclei formation in untreated U2OS cell lines after staining of micronuclei for CENPA (stacked bars represent means of two independent experiments of at least 700 cells assessed per condition).
All scale bars represent 10 μm. See also Figure S4.
During mitosis, untethered DNA breaks lead to the formation of acentric chromatin fragments that fail to segregate because they cannot interact with the mitotic spindle. These acentric fragments are randomly segregated to the cytoplasm of one of the daughter cells and are converted into micronuclei after nuclear envelope reformation (Bizard and Hickson, 2018). To test whether MDC1 and TOPBP1 act to prevent this, cells were first arrested in pro-metaphase and DSBs were induced by IR, followed by release from the mitotic block. Populations of parental U2OS and ΔMDC1 cells expressing WT MDC1 contained few cells with micronuclei 4 h after release (Figure 6C). In contrast, ΔMDC1 cells and ΔMDC1 cells expressing TOPBP1 binding mutants showed significantly elevated numbers of cells with micronuclei, with more than 10% of cells in the population being accompanied by one or several micronuclei. This suggests that MDC1-mediated TOPBP1 recruitment to broken mitotic chromosomes may serve to stabilize clastogen-induced DSBs during mitosis for repair in the subsequent interphase. Next, given that a small number of γH2AX foci can be detected in almost every metaphase even in the absence of exogenous sources of genotoxic stress (Lukas et al., 2011), we addressed the consequences of loss of MDC1 and disruption of the MDC1-TOPBP1 interaction in unperturbed cells. ΔMDC1 cell populations showed a significantly increased fraction of cells with micronuclei as compared to parental U2OS cells (Figure 6D). The majority of these micronuclei contained acentric chromatin fragments as they stained negative for the centromeric protein CENPA. Stable expression of WT MDC1, but not the TOPBP1-binding mutants, reduced the number of micronuclei to the level observed in parental U2OS cells, indicating that MDC1-TOPBP1 complex formation is important to stabilize spontaneous chromosome breaks during mitosis, possibly by bridging and tethering DNA ends (Figure 6D). The increase in spontaneous micronuclei formation upon disruption of the γH2AX-MDC1 cascade was even more pronounced in non-transformed RPE-1 cells, which generally feature much lower numbers of spontaneous micronuclei than cancer cells (Figure S4B). In line with this, we observed that a significantly increased number of chromosomes in metaphase spreads of ΔMDC1 cells and S196A-expressing cells displayed abnormal structures, including, but not limited to, chromatid breaks, chromosome breaks, and dicentric chromosomes (Figures 7A, 7B, S5A, and S5B).
Figure 7.

TOPBP1 Can Bridge MDC1-Bound DSBs Acquired during Mitosis
(A) Examples of chromosomal aberrations in metaphase spreads derived from U2OS ΔMDC1 cells and ΔMDC1 cells stably transfected with TOPBP1 binding mutants, hybridized with a telomere Cy3-labeled PNA probe. Scale bar represents 10 μm.
(B) Quantification of chromosomal aberrations: chromosome breaks, chromatid breaks, fragments, and chromosome fusions were scored (bars represent mean ± SD; n = 18, unpaired t test, α = 0.05).
(C) Airyscan high-resolution confocal single slice images of GFP-TOPBP1 and MDC1 foci in mitosis 1 h after 0.5 Gy IR. “Intra” indicates an intrachromosomal TOPBP1 filament; “inter” indicates an interchromosomal TOPBP1 filament.
(D) Quantification of TOPBP1 foci structures induced by IR in mitotic cells (100 foci scored). Foci structures were determined manually by inspecting images slice by slice in ZEN. Filaments were defined by >1 diffraction-limited spot connected within a TOPBP1 focus.
See also Figures S5 and S6.
To obtain evidence for a DNA-end bridging role for MDC1 and TOPBP1, we performed Airyscan high-resolution confocal imaging of MDC1 and GFP-TOPBP1 foci in mitotic U2OS cells. Strikingly, using this technique, many IR-induced TOPBP1 structures in mitosis no longer resembled diffraction-limited spots but instead resembled filamentous assemblies (Figures 7C and 7D). In contrast, most MDC1 foci did not appear to form such structures but instead resembled cloud-like diffraction-limited spots. We also observed in all irradiated cells incidences of a TOPBP1 filament bridging two MDC1 foci, either within (intra) or occasionally between (inter) chromosomes (Figure 7C). In contrast, we observed few TOPBP1 foci colocalizing with or bridging MDC1 foci in unirradiated mitotic cells (Figure S6A). Nonetheless, we did occasionally observe TOPBP1 filaments in mitotic cells in the absence of exogenous DNA damage, but these did not colocalize with condensed chromatin (Figure S6A) and may represent structures that give rise to ultra-fine DNA bridges in anaphase, as observed previously (Broderick et al., 2015, Pedersen et al., 2015). TOPBP1 filaments were not observed in interphase cells, regardless of DNA damage.
In summary, our data show that the MDC1-TOPBP1 interaction is required for the maintenance of chromosomal stability and suggest that it does so by tethering broken chromosomes during mitosis.
Discussion
The findings reported here reveal a previously unrecognized but highly conserved bi-partite protein interaction surface near the N terminus of MDC1 that is phosphorylated by CK2. An unbiased search for factors that interact with this region uncovered TOPBP1 as the primary phosphorylation-dependent interaction partner of this region of MDC1 and BRCT0–BRCT2 of TOPBP1 as the interacting domains.
Binding affinity of the phosphorylated S168 peptide to TOPBP1 BRCT0–BRCT2 is similar to the phosphorylated RAD9-S387 association with TOPBP1, with a Kd ranging between ∼0.5 μM (MDC1; this study) and 2.0 μM (RAD9; Rappas et al., 2011), which is in the same order of magnitude of typical affinities between BRCT tandem domains and their phosphorylated interaction partners (see e.g., Lloyd et al., 2009, Stucki et al., 2005, Sun et al., 2017). A direct physical and phosphorylation-dependent association between the MDC1 SDT region and TOPBP1 BRCT4+5 was previously reported and implicated in the replication checkpoint (Wang et al., 2011). However, in our hands and in another recent study (Choi and Yoo, 2016), mutation of TOPBP1-BRCT5 had no effect on MDC1-TOPBP1 binding, and we could not detect any measurable association between the phosphorylated MDC1-SDT region and TOPBP1 in our in vitro binding assays and co-immunoprecipitation experiments. Based on these findings, we propose that the NBS1 and TOPBP1 binding sites on MDC1 are structurally and functionally distinct and that the weak association between the MDC1 SDT region and TOPBP1 BRCT4+5 previously reported (Kd 94 ± 15 μM; Leung et al., 2013), is not physiologically relevant (as recently suggested by the authors of the original studies; Sun et al., 2017).
Our data demonstrate that the direct recruitment of TOPBP1 to DSBs via MDC1 is specifically important during mitosis. Interestingly, MDC1 phosphorylation on S168 and S196 did not detectably change in mitotic cells and was not induced by DNA damage (Figure S6B). These data are consistent with CK2 being constitutively active throughout the cell cycle. In line with this, the MDC1-TOPBP1 interaction also did not appear to change in response to these events (Figure S6C), and CK2 inhibition does not inhibit mitotic entry (Figure S6D). Thus, while MDC1-TOPBP1 complexes are present throughout the cell cycle, their physiologically relevant role seems to be confined to mitosis. Since MDC1 cannot substitute for 53BP1 in the accumulation of TOPBP1 in G1 foci, it is also unlikely that the mere exclusion of 53BP1 from mitotic chromatin could explain the switch in the TOPBP1 recruitment mechanism during mitosis. In this context, it is interesting to note that TOPBP1 also changes its foci pattern and recruitment mechanism at the G1/S transition. A possible mechanistic explanation for this switch in foci pattern came from recruitment studies carried out with full-length TOPBP1 and isolated TOPBP1 BRCT modules (Cescutti et al., 2010). Recruitment of TOPBP1 to foci in interphase cells consistently depends on two pairs of BRCT domains: G1 foci are dependent on BRCT0–2 and BRCT4+5 and colocalize with γH2AX, while S/G2 phase foci are dependent on BRCT0–2 and BRCT7+8 and colocalize with RPA-coated ssDNA. Here, we show that only one set of BRCT domains (BRCT0–2) is required for efficient accumulation of TOPBP1 on damaged mitotic chromosomes (Figure S3F). This suggests a switch in the recruitment mode of TOPBP1 in mitosis that may also be associated with a switch in its physiological function.
Thus, we propose that distinct modes of recruitment to sites of DSBs may have evolved to enable TOPBP1 to engage in diverse cellular response processes, depending on the cell-cycle stage. In G1, TOPBP1 has been implicated in G1/S checkpoint activation in response to irradiation via 53BP1 (Cescutti et al., 2010). In S/G2, TOPBP1 functions in multiple processes, including checkpoint signaling (via ATR), DNA replication initiation (via Treslin), and regulation of homologous recombination (via BLM). Mitotic cells are distinct from interphase cells in their ability to progress through M phase without activating a DNA damage checkpoint response (Rieder and Cole, 1998). Thus, it is unlikely that TOPBP1 fulfils the same roles at sites of mitotic DSBs as it does in G1 and in S/G2 phase. Furthermore, there is ample evidence that either DSBs are not repaired or that DSB repair pathways are extensively rewired in mitosis (reviewed in Heijink et al., 2013). Yet, DSBs do not go unnoticed in mitosis. ATM is activated, H2AX is efficiently phosphorylated, and MDC1 recognizes and is recruited to γH2AX-marked chromatin in mitosis. Therefore, it was suggested that γH2AX and MDC1 participate in a mechanism to mark and stabilize DSBs during mitosis for efficient repair in the subsequent cell cycle (Giunta and Jackson, 2011). Based on the observations reported here, we propose that MDC1 performs this task predominantly by recruiting TOPBP1 to damaged chromosomes in mitosis, and we present direct evidence that these two proteins act together to form intra- and inter-chromosomal bridging structures that may help to tether and stabilize broken chromosomes until they can be repaired in the following G1 phase. Consistent with this idea, we found that loss of MDC1 or disruption of the MDC1-TOPBP1 interaction leads to increased radiosensitivity specifically in mitotic cells and increased formation of micronuclei that contain mostly acentric chromatin fragments. This suggests that DSBs are not properly stabilized in the absence of MDC1 and TOPBP1 recruitment, and acentric fragments are not segregated into the daughter cells along with the chromosome from which they have broken off. Additionally, we observed that, upon disruption of the MDC1-TOPBP1 complex, a subset of DSBs remain unrepaired 24 h after DNA damage induction, suggesting that these persistent lesions would have benefited from marking and/or end-tethering during mitosis. A similar role was recently proposed for the MRN complex based on the observation that its NBS1 subunit forms small foci on mitotic chromosomes in response to IR (Giunta et al., 2010). We reproduced these data and found that, similar to the situation in interphase cells, the mitotic NBS1 foci are also dependent on the SDT repeat region in MDC1 (Figure S7A). However, mutation of the SDT repeats did not render cells hypersensitive to IR in mitosis, nor did it negatively affect the stabilization of mitotic DSBs (Figures 6B, 6D, and S7B). Therefore, we conclude that the MDC1-MRN interaction is not critically implicated in the maintenance of genome stability during mitosis.
More than three decades ago, an IR-dependent, female-specific mutator (mu2a) on chromosome 3 in Drosophila was described that specifically increases the recovery of terminal deficiencies (i.e., chromosomes that have lost a natural telomere; Mason et al., 1984). MU2 was later shown to be the Drosophila ortholog of vertebrate MDC1 (Dronamraju and Mason, 2009). The prevalence of female-specific terminal deficiencies would be consistent with post-irradiation deposition of single-ended broken chromosomes into the zygote after the meiotic cell divisions, because acentric fragments would not move to the pole at anaphase in the absence of MU2 (MDC1) and would be lost. Based on this and on our own findings reported here, we propose that tethering of broken chromosomes during mitosis and meiosis may be an ancient and highly conserved function of MDC1. In this context, it is interesting to note that Mdb1, the S. pombe MDC1 ortholog, was recently shown to interact with the TOPBP1 ortholog Rad4 (Day et al., 2018). Whether the Mdb1-Rad4 complex performs functions similar to the MDC1-TOPBP1 complex in mammals remains to be determined.
Finally, it has been reported that TOPBP1 is capable of oligomerizing to form higher-order protein assemblies, although previous work has implicated multiple TOPBP1 motifs in this process (Bang et al., 2013, Liu et al., 2006). Nonetheless, an attractive hypothesis is that the TOPBP1 filamentous assemblies we observe bridging MDC1 foci represent large homo-oligomers containing many molecules of TOPBP1. Further work will be needed in the future to determine the mechanistic basis of higher-order TOPBP1 complex formation, what other proteins are present in such assemblies (if any), and what role they play in the response to mitotic DNA damage.
STAR★Methods
Key Resources Table
| REAGENT or RESOURCE | SOURCE | IDENTIFIER |
|---|---|---|
| Antibodies | ||
| Rabbit polyclonal anti-53BP1 (IF) | Santa Cruz | sc-22760; RRID: AB_2256326 |
| Rabbit polyclonal anti-AKT (WB) | Cell Signaling Technology | 9272; RRID: AB_329827 |
| Rabbit monoclonal anti-AKT-pS129 (WB) | Abcam | ab133458; RRID: AB_10895993 |
| Rabbit monoclonal anti-ATM-pS1981 (WB) | Epitomics | 2152-1; RRID: AB_991678 |
| Rabbit polyclonal anti-Biotin (WB) | Abcam | ab53494; RRID: AB_867860 |
| Goat polyclonal anti-BLM (WB) | Abcam | ab5446; RRID: AB_304894 |
| Mouse monoclonal anti-Cyclin A (IF) | BD Biosciences | 611269; RRID: AB_398797 |
| Mouse monoclonal anti-CENPA (IF) | Abcam | ab13939; RRID: AB_300766 |
| Mouse monoclonal anti-CHK1 (WB) | Santa Cruz | sc-8408; RRID: AB_627257 |
| Rabbit polyclonal anti-CHK1-pS317 (WB) | Cell Signaling Technology | 2344; RRID: AB_331488 |
| Rabbit monoclonal anti-CHK1-pS345 (WB) | Cell Signaling Technology | 2348; RRID: AB_331212 |
| Rabbit polyclonal anti-CHK2 (WB) | Cell Signaling Technology | 2662; RRID: AB_2080793 |
| Rabbit polyclonal anti-CHK2-pT68 (WB) | Cell Signaling Technology | 2661; RRID: AB_331479 |
| Mouse monoclonal anti-CENPA (IF) | Abcam | ab13939; RRID: AB_300766 |
| Mouse polyclonal anti-GFP (WB) | Roche | 11814460001; RRID: AB_390913 |
| Mouse monoclonal anti-GST (WB) | Santa Cruz | sc-138; RRID: AB_627677 |
| Rabbit polyclonal anti-H2A (WB) | Merck | 07-146; RRID: AB_11212920 |
| Rabbit polyclonal anti-H2AX (WB) | Novus Biologicals | NB100-383; RRID: AB_10002060 |
| Mouse monoclonal anti-γH2AX (IF/WB) | Merck | 05-636; RRID: AB_309864 |
| Rabbit polyclonal anti-H3 (WB) | Abcam | ab1791; RRID: AB_302613 |
| Mouse monoclonal anti-H3-pS10 (FACS/WB) | Abcam | ab14955; RRID: AB_443110 |
| Mouse monoclonal anti-HA (WB) | Santa Cruz | sc-57592; RRID: AB_629568 |
| Rabbit polyclonal anti-KAP1 (WB) | Abcam | ab10483; RRID: AB_297222 |
| Rabbit polyclonal anti-KAP1-pS824 (WB) | Bethyl Laboratories | IHC-00073; RRID: AB_577234 |
| Mouse monoclonal anti-MDC1 (IF) | Abcam | ab50003; RRID: AB_881103 |
| Rabbit polyclonal anti-MDC1 (WB) | Abcam | ab11171; RRID: AB_297810 |
| Rabbit polyclonal anti-MDC1-pS168 (WB) | AMS Biotechnology | N/A |
| Rabbit polyclonal anti-MDC1-pS196 (WB) | 21st Century Biochemicals | N/A |
| Rabbit polyclonal anti-NBS1 (IF) | Novus Biologicals | NB100-143; RRID: AB_10078050 |
| Rabbit monoclonal anti-NBS1 (WB) | Abcam | ab32074; RRID: AB_777007 |
| Mouse monoclonal anti-PLK1 (WB) | Merck | 05-844; RRID AB_310836 |
| Rabbit polyclonal anti-RAD9 (WB) | Abcam | ab70810; RRID: AB_1270159 |
| Mouse monoclonal anti-RPA2 (WB) | Abcam | ab2175; RRID: AB_302873 |
| Rabbit monoclonal anti-RPA2-pS4/pS8 (WB) | Bethyl Laboratories | A700-009; RRID: AB_2765278 |
| Rabbit polyclonal anti-SMC1 (WB) | Abcam | ab9262; RRID: AB_307121 |
| Rabbit polyclonal anti-SMC1-pS966 (WB) | Abcam | ab1276; RRID: AB_299409 |
| Rabbit polyclonal anti-TOPBP1 (IF) | Bethyl Laboratories | A300-111A; RRID: AB_2272050 |
| Rabbit polyclonal anti-TOPBP1 (WB) | Abcam | ab2402; RRID: AB_303044 |
| Alexa Fluor 488 goat anti-rabbit IgG H&L (IF) | Abcam | ab150077; RRID: AB_2630356 |
| Alexa Fluor 568 goat anti-rabbit IgG H&L (IF) | Abcam | ab175471; RRID: AB_2576207 |
| Alexa Fluor 647 goat anti-mouse IgG H&L (IF) | Abcam | ab150115; RRID: AB_2687948 |
| Alexa Fluor 647 goat anti-mouse IgG1 (FACS) | Thermo Fisher Scientific | A-21240; RRID: AB_2535809 |
| Biological Samples | ||
| HeLa nuclear extract | Ipracell | CC-01-20-25 |
| Chemicals, Peptides, and Recombinant Proteins | ||
| Alexa Fluor 488-labeled PNA CENPB probe | PNA Bio | F3004 |
| Aphidicolin | Merck | 178273 |
| ATM inhibitor AZD0156 | Selleck Chemicals | S8375 |
| ATR inhibitor AZD6738 | Cayman Chemical | 21035 |
| Camptothecin | Cayman Chemical | 11694 |
| CDK inhibitor RO-3306 | Merck | 217699 |
| CK2 inhibitor CX-4945 | Selleck Chemicals | S2248 |
| cOmplete EDTA-free Protease Inhibitor Cocktail | Merck | 5056489001 |
| DAPI solution | BD Biosciences | 564907 |
| DNA-PK inhibitor NU7741 | Cayman Chemical | 14881 |
| EZview Red Anti-HA Affinity Gel | Merck | E6779 |
| GFP-Trap_MA | Chromotek | gtma-100 |
| Glutathione Sepharose 4B | GE Healthcare | 17075601 |
| Karyomax Colcemid Solution In PBS | Thermo Fisher Scientific | 15212012 |
| Lipofectamine 2000 | Thermo Fisher Scientific | 11668019 |
| MDC1-S196 peptide (Biotin-GGSGSRTTSSSVIVPESDEEGHSPV-NH2) | Genosphere Biotechnologies | N/A |
| MDC1-pS196 peptide (Biotin-GGSGSRTTSSSVIVPE[pS]DEEGHSPV-NH2) | Genosphere Biotechnologies | N/A |
| MDC1-pS168 peptide (Flu-GYGRLLLAED[pS]EEEVDFL) | Peptide Protein Research | N/A |
| MDC1-pS196 peptide (Flu-GYGGSVIVPE[pS]DEEGHSP) | Peptide Protein Research | N/A |
| MDC1 SDT motif 1 peptide (Flu-GYGFAFNLN[pS]D[pT]DVEEGQ) | Peptide Protein Research | N/A |
| MDC1 SDT motif 2 peptide (Flu-GYGQPPGED[pS]D[pT]DVDDDS) | Peptide Protein Research | N/A |
| MDC1 SDT motif 3 peptide (Flu-GYGPFGFID[pS]D[pT]DAEEER) | Peptide Protein Research | N/A |
| MDC1 SDT motif 4 peptide (Flu-GYGQESQAG[pS]D[pT]DVEEGK) | Peptide Protein Research | N/A |
| MDC1 SDT motif 5 peptide (Flu-GYGASMVIN[pS]D[pT]DDEEEV) | Peptide Protein Research | N/A |
| MDC1 SDT motif 6 peptide (Flu-GYGTTTERD[pS]D[pT]DVEEEE) | Peptide Protein Research | N/A |
| Nocodazole | Merck | M1404 |
| PLK1 inhibitor BI 2536 | Cayman Chemical | 17385 |
| SuperSignal West Femto Maximum Sensitivity Substrate | Thermo Fisher Scientific | 34095 |
| VECTASHIELD Antifade Mounting Media with DAPI | Vector Laboratories | H-1200 |
| Critical Commercial Assays | ||
| Bolt 4%–12% Bis-Tris Plus Gels | Thermo Fisher Scientific | NW04120BOX |
| Fixation/Permeabilization Solution Kit | BD Biosciences | 554714 |
| GenElute HP Endotoxin-Free Plasmid Maxiprep Kit | Merck | NA0410 |
| Mini-PROTEAN 4%–15% TGX Stain-Free Protein Gels | Bio-Rad | 4568086 |
| Novex 10%–20% Tricine Protein Gels | Thermo Fisher Scientific | EC6625BOX |
| QuickLyse Miniprep Kit | QIAGEN | 27405 |
| QuikChange II Site-Directed Mutagenesis Kit | Agilent Technologies | 200524 |
| Telomere PNA FISH Kit/Cy3 | Agilent Technologies | K5326 |
| Deposited Data | ||
| Mass spectrometry | This paper and PRIDE | PXD011850 |
| Raw image files | This study, Mendeley Data | https://data.mendeley.com/datasets/26pch2jvzh.1 |
| Experimental Models: Cell Lines | ||
| 293FT human embryonic kidney cell line | Thermo Fisher Scientific | R70007 |
| U-2 OS (U2OS) human bone osteosarcoma cell line | ATCC | HTB-96 |
| U2OS Δ53BP1 | Daniel Durocher lab | Orthwein et al., 2015 |
| U2OS ΔMDC1 | This paper | N/A |
| U2OS ΔMDC1 +GFP-MDC1 | This paper | N/A |
| U2OS ΔMDC1 +GFP-MDC1-S168A | This paper | N/A |
| U2OS ΔMDC1 +GFP-MDC1-S196A | This paper | N/A |
| U2OS ΔMDC1 +GFP-MDC1-S168A/S196A | This paper | N/A |
| U2OS ΔMDC1 +GFP-MDC1-AQXF | This paper | N/A |
| U2OS ΔMDC1 +GFP-MDC1-12A | This paper | N/A |
| RPE-1 human retinal pigmented epithelium cell line | Stephen Jackson lab | Chiang et al., 2016 |
| RPE-1 H2AXS139A/S139A | Stephen Jackson lab | Chiang et al., 2016 |
| RPE-1 ΔMDC1 | Stephen Jackson lab | Chiang et al., 2016 |
| Oligonucleotides | ||
| Mutagenesis primer MDC1-S168A forward: CTGTTGGCTGAGGACGCGGAGGAGGAAGTAG |
Microsynth | N/A |
| Mutagenesis primer MDC1-S168A reverse: CTACTTCCTCCTCCGCGTCCTCAGCCAACAG |
Microsynth | N/A |
| Mutagenesis primer MDC1-S196A forward: CTCTGTGATAGTTCCAGAGGCTGATGAAGAGGGGCATTCC |
Microsynth | N/A |
| Mutagenesis primer MDC1-S196A reverse: GGAATGCCCCTCTTCATCAGCCTCTGGAACTATCACAGAG |
Microsynth | N/A |
| Mutagenesis primer TOPBP1-BRCT2 (K250A) forward: GCAAGAACCAAAAGGTCAGGCGTATGAGTGTGCCAAGAGA |
Eurofins Genomics | N/A |
| Mutagenesis primer TOPBP1-BRCT2 (K250A) reverse: TCTCTTGGCACACTCATACGCCTGACCTTTTGGTTCTTGC |
Eurofins Genomics | N/A |
| sgRNA primer forward: CACCCACCTCGGGAAGAATGTGGT |
Microsynth | N/A |
| sgRNA primer reverse: AAACACCACATTCTTCCCGAGGTG |
Microsynth | N/A |
| Recombinant DNA | ||
| pcDNA3-MDC1-HA-12A | Jiri Lukas lab | Melander et al., 2008 |
| pcDNA3.1-GFP-MDC1-WT | Stephen Jackson lab | Kolas et al., 2007 |
| pcDNA3.1-GFP-MDC1-12A | This paper | N/A |
| pcDNA3.1-GFP-MDC1-AQXF | Stephen Jackson lab | Kolas et al., 2007 |
| pcDNA3.1-GFP-MDC1-S168A | This paper | N/A |
| pcDNA3.1-GFP-MDC1-S196A | This paper | N/A |
| pcDNA3.1-GFP-MDC1-S168A/S196A | This paper | N/A |
| pcDNA3.1-HA-MDC1-WT | Stephen Jackson lab | Kolas et al., 2007 |
| pcDNA5/FRT/TO | Thermo Fisher Scientific | V6520-20 |
| pcDNA5/FRT/TO-MDC1-HA-WT | This paper | N/A |
| pcDNA5/FRT/TO-MDC1-HA-12A | This paper | N/A |
| pcDNA5/FRT/TO-MDC1-HA-S196A-12A | This paper | N/A |
| pcDNA5/FRT/TO-MDC1-HA-S196A | This paper | N/A |
| pcDNA5/FRT/TO-MDC1-HA-S168A | This paper | N/A |
| pcDNA5/FRT/TO-MDC1-HA-S168/S196A | This paper | N/A |
| pGEX-4T-3-MDC1109-330 | Manuel Stucki lab | Spycher et al., 2008 |
| pGEX-4T-3-MDC1109-330 S196A | This paper | N/A |
| pGEX-4T-3-MDC1109-330 ADA | This paper | N/A |
| pGEX-4T-3-MDC1109-330 ADA+S196A | This paper | N/A |
| pIRESneo2-TOPBP1 | Thanos Halazonetis lab | Cescutti et al., 2010 |
| pIRESneo2-TOPBP1-K154A/K155A (BRCT1) | Wojciech Niedzwiedz lab | Blackford et al., 2015 |
| pIRESneo2-TOPBP1-K250A (BRCT2) | This paper | N/A |
| pIRESneo2-TOPBP1-K704A (BRCT5) | Wojciech Niedzwiedz lab | Blackford et al., 2015 |
| pX330-U6-Chimeric_BB-CBh-hSpCas9 | Feng Zhang lab | Addgene plasmid #42230; Cong et al., 2013 |
| Software and Algorithms | ||
| Boxshade | ExPASy Bioinformatics Resource Portal | https://embnet.vital-it.ch/software/BOX_form.html |
| CellProfiler | Carpenter et al., 2006 | http://cellprofiler.org |
| Fiji | Schindelin et al., 2012 | https://imagej.net/Fiji |
| GraphPad Prism v7.00 | GraphPad Prism version 7.00 GraphPad Software, La Jolla California USA | http://graphpad.com |
| R | R Development Core Team | http://r-project.org |
| SQUASSH segmentation algorithm | Rizk et al., 2014 | https://imagej.net/Squassh |
| T-Coffee multiple sequence alignment tool | Notredame et al., 2000 | http://tcoffee.crg.cat |
| ZEN Black v2.1 | ZEISS | https://www.zeiss.com |
Contact for Reagent and Resource Sharing
Further information and requests for reagents should be directed to the Lead Contact, Manuel Stucki (manuel.stucki@uzh.ch).
Experimental Model and Subject Details
Cell lines and cell culture conditions
Source of all the cell lines used in this study is provided in the key resource table. 293FT, U2OS and RPE-1 cells were cultured in Dulbecco’s modified Eagle’s medium (DMEM), supplemented with 10% fetal calf serum (FCS), 2 mM L-glutamine and penicillin-streptomycin antibiotics under standard cell culture conditions in a CO2 incubator (37°C; 5% CO2). Stably transfected U2OS cell lines were cultured in the presence of 400 μg/mL Geneticin. Cells were regularly tested for mycoplasma contamination.
Method Details
Cloning and Mutagenesis
pcDNA5/FRT/TO-MDC1-HA-WT was generated by subcloning MDC1-HA-WT from pcDNA3.1-MDC1-HA-WT (gift from Steve Jackson; (Kolas et al., 2007)) into a modified pcDNA5/FRT/TO vector (Invitrogen). pcDNA5/FRT/TO-MDC1-HA-12A was generated by excision of a SmaI/AvrII restriction fragment containing the SDT region from pcDNA3-MDC1-HA-12A (gift from Jiri Lukas; (Melander et al., 2008)) and ligating it into pcDNA5/FRT/TO-MDC1-HA-WT that was previously digested with SmaI and AvrII. pcDNA5/FRT/TO-MDC1-HA-S168A, -S196A and -S168/S196A and pcDNA5/FRT/TO-MDC1-HA-S196A-12A were generated by site directed mutagenesis of pcDNA5/FRT/TO- MDC1-HA-WT and pcDNA5/FRT/TO-MDC1-HA-12A, respectively, using QuikChange II Site-Directed Mutagenesis kit (Agilent Technologies). Sequences of the mutagenesis primers are in the key resource table. pGEX4T3-MDC1109-330 fragment (“M2”) was described elsewhere (Spycher et al., 2008). pGEX-4T-3-MDC1-M2-S196A, pGEX-4T-3-MDC1-M2-ADA-S196A and pGEX-4T-3-MDC1-M2-ADA were generated by PCR amplification of the M2 fragment using the pcDNA5/FRT/TO-MDC1-HA-12A and pcDNA5/FRT/TO-MDC1-HA-S196A-12A plasmids as templates, respectively. Fragments were then ligated into the pGEX-4T-3 vector. pcDNA3.1-GFP-MDC1-WT and pcDNA3.1-GFP-MDC1-AQXF plasmids were a gift from Steve Jackson and are described elsewhere (Kolas et al., 2007). S168A, S196A and S168A/S196A mutations were introduced in pcDNA3.1-GFP-MDC1-WT as described above for pcDNA5/FRT/TO-MDC1-HA plasmids. pcDNA3.1-GFP-MDC1-12A was generated by replacing an ApaI restriction fragment within the MDC1 coding sequence that contains all the six SDT repeats with a custom synthesized DNA fragment (BioCat GmbH), designed to have all six SDT motifs changed to ADA.
Peptide pull-downs
Biotinylated peptides (Genosphere Biotechnologies) were bound to streptavidin-coupled Dynabeads M-280 (Life Technologies). HeLa nuclear extracts (Ipracell) were diluted 1:1 with 2X dilution buffer (100 mM NaCl, 10 mM NaF, 0.2 mM EDTA, 0.4% Igepal CA-630, 20 mM HEPES-KOH, pH 7.4) supplemented with cOmplete protease inhibitor cocktail (Roche), and cleared by centrifugation. Dynabead-conjugated peptides were incubated with clarified extracts with end-to-end mixing at 4°C for 2 hr. Beads were washed with peptide pull-down buffer (50 mM NaCl, 50 mM KCl, 5 mM NaF, 0.1 mM EDTA, 0.2% Igepal CA-630, 10% glycerol, 20 mM HEPES-KOH, pH 7.4) supplemented with cOmplete protease inhibitor cocktail (Roche), before elution in 2X SDS sample buffer for mass spectrometry or SDS-PAGE. Peptide sequences were as follows: Biotin-GGSGSRTTSSSVIVPESDEEGHSPV-NH2 (MDC1-S196) and Biotin-GGSGSRTTSSSVIVPE[pS]DEEGHSPV-NH2 (MDC1-pS196).
Mass spectrometry
Precipitated material in SDS sample buffer was subjected to two rounds of chloroform-methanol precipitation followed by in-solution trypsin digestion as described previously (Fischer and Kessler, 2015). Digested and desalted samples were resuspended in 20 μL 2% acetonitrile and 0.1% formic acid and analyzed by nano-flow liquid chromatography tandem mass spectrometry (LC-MS/MS) as described previously (Davis et al., 2017). Samples were analyzed on an Orbitrap Fusion Lumos instrument, coupled to an Ultimate 3000 nUPLC with an EASY-Spray column (50 cm). MS1 scans were acquired at a resolution of 120000 in the Orbitrap and MS2 scan were acquired in the ion trap in rapid mode. Selected precursors were excluded for 60 s. MS data was processed with MaxQuant (Version 1.6.2.3) and searched against the UniProt/Swissprot database (human, retrieved 18/07/2017). We used the FastLFQ algorithm for quantitation and the match between runs feature for identification transfer. Proteomics data have been deposited to the ProteomeXchange Consortium via the PRIDE (Vizcaíno et al., 2016) partner repository (PRIDE: PXD011850).
SDS-PAGE and western blotting
SDS-PAGE and western blotting were performed using 7% Tris-Bicine gels with the SE400 and TE42 systems from Hoefer, or Bolt 4%–12% Bis-Tris Plus gels from Thermo Fisher Scientific. Biotinylated peptides were resolved using Novex 10%–20% Tricine gels from Thermo Fisher Scientific. Additional SDS-PAGE and western blotting were performed using BioRad 4%–15% Mini-PROTEAN TGXTM Precast Gels. The following antibodies were used at the indicated dilutions: AKT (9272, Cell Signaling, 1/1000), AKT-pS129 (ab133458, Abcam, 1/3000), ATM-pS1981 (2152-1, Epitomics, 1/5000), Biotin (ab53494, Abcam, 1/100), BLM (ab5446, Abcam, 1/500), CHK1 (sc-8408, Santa Cruz Biotechnology, 1/1000), CHK1-pS317 (2344, Cell Signaling, 1/500), CHK1-pS345 (2348, Cell Signaling, 1/10,000), CHK2 (2662, Cell Signaling, 1/1000), CHK2-pT68 (2661, Cell Signaling, 1/1000), GFP (11814460001, Roche, 1/5000), GST (sc-138, Santa Cruz Biotechnology, 1/500), H2A (01-146, Merck, 1/2500), H2AX (NB100-383, Novus Biologicals, 1/5000), γH2AX (05-636, Merck, 1/1000), H3 (ab1791, Abcam, 1/30,000), H3-pS10 (ab14955, Abcam, 1/5000), HA (sc-57592, Santa Cruz Biotechnology, 1/1000), KAP1 (ab10483, Abcam, 1/5000), KAP1-pS824 (IHC-00073, Bethyl Laboratories, 1/500), MDC1 (ab11171, Abcam, 1/5000), MDC1-pS168 (1/500), MDC1-pS196 (1/2000), NBS1 (ab32074, Abcam, 1/2000), RAD9 (ab70810, Abcam, 1/3000), RPA2 (ab2175, Abcam, 1/10,000), RPA2-pS4/pS8 (A700-009, Bethyl Laboratories, 1/1000), SMC1 (ab9262, Abcam, 1/5000), SMC1-pS966 (ab1267, Abcam, 1/2500), TOPBP1 (ab2402, Abcam, 1/1500). To generate the MDC1-pS168 affinity purified rabbit polyclonal antibody, the synthetic peptide sequence RLLLAED[pS]EEEVDFL, was conjugated to keyhole limpet hemocyanin (KLH) via a non-native N-terminal cysteine residue and used for immunization (AMS Biotechnology). MDC1 pS196 affinity purified polyclonal antibody was custom made by 21st Century Biochemicals (Marlboro), using the synthetic peptide sequence SVIVPE[pS]DEEGHSP for immunization.
Immunoprecipitations
For preparation of lysates for immunoprecipitations (IPs), cells were washed twice in phosphate-buffered saline (PBS), and lysed in IP buffer (100 mM NaCl, 0.2% Igepal CA-630, 1 mM MgCl2, 10% glycerol, 5 mM NaF, 50 mM Tris-HCl, pH 7.5), supplemented with cOmplete EDTA-free protease inhibitor cocktail and 25 U/mL Benzonase (Novagen). After nuclease digestion, NaCl and EDTA concentrations were adjusted to 200 mM and 2 mM, respectively, and lysates were cleared by centrifugation. Lysates were then incubated with 15 μL of either GFP-Trap magnetic agarose beads (ChromoTek) or EZview Red Anti-HA Affinity Gel (Sigma-Aldrich) for 2 h with end-to-end mixing at 4°C. Immunoglobulin- antigen complexes were washed five times with IP buffer before elution in 2X SDS sample buffer.
Fluorescence polarization
For source and sequence information of fluorescein-labeled (Flu) peptides see key resource table. Recombinant human TOPBP1 BRCT0-2 and BRCT4+5 were expressed and purified as follows: GST-tagged BRCT0-2 or His-SUMO-tagged BRCT4+5 were transformed into Escherichia coli expression strain Rosetta 2 (DE3)pLysS (Merck). Single transformed colonies were used to inoculate a 250 mL flask containing 100 mL of Luria–Bertani broth (LB) supplemented with carbenicillin (100 μg/mL) and chloramphenicol (34 μg/mL). Inoculated cultures were grown overnight at 37°C, at 220 rpm in an orbital shaking incubator. The following day, 20 mL of overnight culture was used to inoculate a 2-l flask containing 1 l of LB, supplemented with antibiotics as above. Cultures were grown at 37°C, 220 rpm, until the optical density at 600 nm reached 0.6–0.8. They were then removed from the incubator, and rapidly cooled on ice for 30 min. Recombinant protein expression was induced by the addition of 0.4 mM isopropyl β-D-1-thiogalactopyranoside (IPTG), and the cultures incubated for a further 16 h at 220 rpm at 16°C. Cells were then harvested by centrifugation, and the resulting pellet was stored at −80°C until required. The cell pellet arising from 6 l of culture was resuspended in 100 mL of 25 mM HEPES (pH 7.5), 1 M NaCl, 5% glycerol, 0.1% Tween-20, supplemented with protease inhibitors (Roche), then lysed on ice by sonication delivered by a Jencons Ultrasonic Processor (18 × 5 s bursts at 50% amplitude). Cell debris and precipitated material were removed by high-speed centrifugation at 48,834 x g for 60 min. For GST-tagged BRCT0-2, the supernatant was applied to a 5 mL HiTrap GST column (GE Healthcare), then washed with buffer containing 50 mM HEPES pH 7.5, 1 M NaCl, 250 μM TCEP. Retained protein was eluted by application of the lysis buffer supplemented with 20 mM glutathione. For His- SUMO-tagged BRCT4+5, the supernatant was applied to a 5 mL HiTrap TALON crude column (GE Healthcare), washed first with buffer containing 50 mM HEPES pH 7.5, 1 M NaCl, 250 μM TCEP, and then again with buffer containing 50 mM HEPES pH 7.5, 200 mM NaCl, 250 μM TCEP and 10 mM imidazole. Retained protein was eluted by application of the same buffer supplemented with 250 mM imidazole. Rhinovirus 3C PreScission protease (GE Healthcare) was added to the eluate and incubated overnight at 4°C to cleave the affinity tag. Both eluted TOPBP1 proteins were concentrated to a final volume of 5 mL (Vivaspin 20, 10 kDa MWCO, Sartorius Stedim Biotech) then applied to a HiLoad Superdex 200 16/60 size exclusion chromatography column (GE Healthcare) pre-equilibrated in 25 mM HEPES pH 7.5, 200 mM NaCl, 1 mM EDTA, 250 μM TCEP, 0.02% Tween-20. Flu-labeled peptides at a concentration of 100 nM were incubated at room temperature with increasing concentrations of TOPBP1 BRCT0-2 or BRCT4+5 in 25 mM HEPES (pH 7.5), 200 mM NaCl, 1 mM EDTA, 0.5 mM TCEP, 0.02% Tween-20. Fluorescence polarization was measured using a CLARIOstar multimode microplate reader (BMG Labtech). Data were analyzed using GraphPad Prism by non-linear fitting with a one-site total binding model. Any non-specific binding component was subtracted from the data for presentation purposes only. All data represent the mean of four separate experiments, and error bars represent one standard deviation.
In vitro kinase assays and GST-pull-downs
GST fusion proteins were expressed in the competent Escherichia coli expression strain BL21(DE3)pLysS (Promega) followed by protein purification with glutathione–Sepharose beads. GST fusion proteins were mock treated or treated with 120 U recombinant CK2 (New England Biolabs) with 10 mM ATP in NEB PK buffer (New England Biolabs) and incubated at 30°C for 45 min. For GST-pull-downs, 5 μg of the GST-MDC1 fusion proteins were then mixed with 250 μg HeLa nuclear extract and incubated for 1 h at 4°C. Glutathione–Sepharose beads (GE Healthcare) were added and the suspension was incubated at 4°C for 2 h on a rotating wheel. The beads were washed three times with wash buffer (50 mM Tris, pH 7.5, 120 mM NaCl, 1 mM DTT, and 0.3% NP-40) and bound proteins were eluted by addition of 2X SDS sample buffer.
Generation of CRISPR/Cas9 MDC1 knock-out cell lines
The U2OS ΔMDC1 cell line was generated as follows, according to a protocol published previously (Ran et al., 2013). Sources and sequences of the reagents used are provided in the key resource table. The sgRNA target sequence was cloned into the pX330-U6-Chimeric_BB-CBh-hSpCas9 vector (a gift from Feng Zhang; Addgene plasmid #42230; http://n2t.net/addgene/42230; RRID:Addgene 42230) and verified by sequencing. Transfection of U2OS cells was done by electroporation of 106 cells with 5 μg of plasmid DNA on a NEON transfection system (Invitrogen), using the following electroporation parameters: pulse voltage 1230 V; pulse width 10 ms; pulse number 4. Clonal cell lines were isolated by dilution in 96-well plates. Total extract of single clones was prepared and analyzed by western blotting, using rabbit polyclonal anti-MDC1 antibody (Abcam). Total deletion of the MDC1 gene was verified in one of the clonal cell lines by Sanger sequencing of a PCR-amplified genomic fragment that was cloned in the pCR II Blunt TOPO plasmid (sequences available upon request).
Generation of stably transfected ΔMDC1 cell lines
For generation of the GFP-MDC1 expressing stable cell lines, U2OS ΔMDC1 cells were transfected with the indicated plasmids using Lipofectamine 2000, following the standard protocol provided by the supplier. The media was changed 10 h post-transfection. Two days post-transfection, cell colonies were grown in the presence of 400 μg/mL Geneticin G418 for 10 days with a media change every 3 days. Single colonies were picked using cloning rings and expanded. Clones were analyzed for GFP-MDC1 expression by western blotting and immunofluorescence, respectively. To improve homogeneous GFP-MDC1 expression, positive clones were sorted using a BD FACSAria III 4L cell sorter.
Immunofluorescence
Cells were grown on glass coverslips and fixed with either ice-cold methanol for 10 min (for staining with TOPBP1 antibody), or with 4% buffered formaldehyde (for staining with all other antibodies) for 15 min at room temperature, and subsequently permeabilized for 5 min in PBS containing 0.2% Triton X-100. Following 1 h of blocking in blocking buffer (10% FBS, 3% BSA in PBS), primary antibody incubations were performed at room temperature for 2 h. Coverslips were washed three times with PBS and secondary antibody incubations were performed for 1 h at room temperature in the dark. After washing with PBS three times, coverslips were mounted on glass microscopy slides with VECTASHIELD mounting medium containing 0.5 μg/mL 4’,6-diamidino-2-phenylindole dihydrochloride (DAPI). The following antibodies were used at the indicated dilutions: 53BP1 (sc-22760, Santa Cruz, 1/500), CENPA (ab13939, Abcam, 1/200), Cyclin A (611269, BD Biosciences, 1/100), γH2AX (05-636, Millipore, 1/500), MDC1 (ab50003, Abcam, 1/300), NBS1 (NB100-143, Novus, 1/200), RPA2 (ab2175, Abcam, 1:250), TOPBP1 (A300-111A, Bethyl, 1/500).
Widefield microscopy
Widefield image acquisition was done on a ZEISS AxioObserver Z1 widefield microscope, equipped with a Lumencor SpectraX illumination system and a Hamamatsu Orca Flash 4.0 V2, sCMOS, cooled fluorescence camera (16-bit, 2048 × 2048 pixel (4 MP), pixel size 6.5 μm). A 63x, 1.4-NA, i-plan apochromat oil-immersion objective was used. For three-emission wavelength detection we combined DAPI with EGFP or Alexa Fluor 488 and Alexa Fluor 568. For optimal representation in figures, images were adjusted for brightness and exported as RGB TIF files using Fiji (Schindelin et al., 2012). Images in Figure S2G were deconvoluted with Huygens software (Scientific Volume Imaging) using a computed theoretical PSF based on known microscopic parameters.
Confocal microscopy
Confocal images were acquired with a Leica SP8 inverse confocal laser scanning microscope with a 63x, 1.4-NA Plan-Apochromat oil-immersion objective. For four-emission wavelength detection we combined DAPI with EGFP, Alexa Fluor 568 and Alexa Fluor 647. For three- emission wavelength detection we combined DAPI with EGFP and Alexa Fluor 568. The sequential scanning mode was used and the number of overexposed pixels was kept at a minimum. At least 10 single cells were recorded per condition with 10-15 z sections and a resolution of 512 × 512 pixels (voxel size 100 × 100 × 298 nm), 8-bit depth. For optimal representation in figures, maximum intensity projections were calculated and images were adjusted for brightness and exported as RGB TIF files using Fiji. For quantitative assessment of protein colocalization, the SQUASSH plugin (part of the MosaicSuite) for ImageJ and Fiji was used (Rizk et al., 2014). SQUASSH combines the image-segmentation task with biological reality through prior knowledge about the imaged objects (in this case DNA damage foci), the image-formation process and the noise present in the image. Maximum intensity projections of two channel confocal micrographs of single cells (EGFP and Alexa Fluor 568) were used for the SQUASSH analysis. Segmentation parameters were as follows: regularization ch1: 0.05, regularization ch2: 0.05, minimum object intensity ch1: 0.55, minimum object intensity ch2: 0.55, include subpixel segmentation: yes, exclude z edge: yes. Noise model: Poisson, standard deviation xy: 0.8 pixels, standard deviation z: 0.8 pixels. A script for the free open-source statistical software R is automatically generated by the SQUASSH plugin, which calculates object number colocalization (number of objects that overlap ≥ 50% divided by total number of objects) and object size colocalization (area of object colocalization divided by total object area). Due to slight heterogeneity of the GFP signal in the stably transfected cells we excluded signal co-localization from the analysis.
Quantification of γH2AX foci
For quantification of γH2AX foci in Figure 5B, cells were grown on coverslips, synchronized using RO-3306 and released for 40 min to allow cells to enter mitosis. Mitotic cells were irradiated at 0.5 Gy and subsequently released in fresh medium and left to grow for 24 h in the cell culture incubator. Cells were then fixed and stained with mouse monoclonal anti-γH2AX antibody as described above. Quantification was done manually. For quantification of γH2AX foci in Figure S3D, unsynchronized cells were irradiated with 3 Gy, followed by incubation at 37°C for 1 h. Cells were then fixed and stained with mouse monoclonal anti-γH2AX antibody as described above. Image acquisition was done using widefield microscopy. Quantification was done using CellProfiler (Carpenter et al., 2006) and R (CellProfiler analysis pipeline and R script available upon request).
Quantification of micronuclei
For quantification of micronuclei formation after irradiation of mitotic cells, cells where either untreated or irradiated with 0.5 Gy in prometaphase after a nocodazole arrest and subsequently released from the cell cycle arrest by washing twice with PBS and adding fresh medium for 4 h to allow cells to enter G1 phase. Cell were then fixed and stained with DAPI as described above. For quantification of spontaneous micronuclei formation, asynchronous and untreated cell populations were grown on coverslips, fixed and stained with DAPI as described above. Images were captured by widefield microscopy. Micronuclei were counted manually and nuclei were counted using the CellProfiler software. To assess the presence of centromeres in the micronuclei, fixed cells were stained with CENPA antibodies (see above). To probe for the presence of telomeric repeats in the micronuclei, fluorescence in situ hybridization (FISH) was done using Telomere PNA FISH Kit/Cy3 (Agilent Technologies) according to the protocol provided by the supplier.
Clonogenic survival assay
For clonogenic survival assay of interphase cells, 5 × 10⁵ cells were counted and plated, followed by irradiation with the indicated doses and replating in 6-well plates. For mitotic cells, 2.5 × 10⁶ cells were counted, plated and arrested in prometaphase using 100 ng/mL nocodazole for 16 h, followed by irradiation with the indicated doses. Following a mitotic shake off, cells were counted and re-plated in 6-well plates. For both interphase and mitotic assays, cells were grown with medium change every 3 days for 12 days. Plates were washed twice with PBS and incubated for 1 h in methylene blue fixation/staining solution (80% EtOH, 1% methylene blue powder) at room temperature. After rigorous washing with warm tap water, plates where left to dry overnight and colonies were counted manually using an eCountTM colony counter pen.
Metaphase analysis
Cells were grown to 90% confluency on a 10-cm plate and were treated with 0.1 μg/mL KaryoMax Colcemid (Thermo Fisher Scientific) for 2 h. Cells were trypsinized and transferred to a 15 mL Falcon tube, centrifuged at 1000 rpm for 5 min and carefully resuspended in 5 mL hypotonic buffer (15% FBS, 75 mM KCl) and incubated for 15 min at 37°C. Cells were again pelleted at 1000 rpm for 5 min, the supernatant was discarded and the cell pellet was resuspended in 200 μL of hypotonic buffer. Cells were fixed by adding drop-wise 7 mL of EtOH:acetic acid 3:1 while slowly vortexing followed by incubation for 20 min. After centrifugation at 1000 rpm for 5 min, supernatant was discarded and cells were re-suspended in remaining 200 μL of the fixation buffer. 20-25 μL of the cell suspension was then dropped in a 45° angle onto a wet glass slide and air-dried for 10 min. Metaphases were stained with DAPI (VECTASHIELD with DAPI), covered with a glass coverslip and sealed with nail varnish. Telomere FISH was conducted using the Telomere PNA FISH Kit/Cy3 (Agilent Technologies) according to the protocol provided by the supplier. For telomere/centromere co-FISH, the same protocol as above was applied with the following adjustments: fixation of metaphase spreads was done with 3:1 MeOH:acetic acid for 20 min on ice. The CENPB probe (Alexa 488-labeled PNA CENPB probe from PNA Bio) was dissolved in formamide and combined with the telomere PNA probe to a final concentration of 5 μM. The hybridization time and temperature were adjusted to 8 min at 70°C.
Airyscan high-resolution confocal microscopy
Cells were grown in 35-mm #1.5H glass bottom dishes (IB-81158, Thistle Scientific). Cells were washed once in PBS before fixing for 10 min in 4% paraformaldehyde (PFA; Santa Cruz Biotechnology sc-281692) at room temperature. PBS was added simultaneously during PFA removal to prevent samples from drying due to PFA evaporation. Cells were washed once in PBS, before permeabilization in 0.2% Triton X-100 (Thermo Fisher Scientific) in PBS for 5 min. Samples were washed once in PBS before incubation with primary antibodies diluted in antibody buffer (DMEM supplemented with 10% FCS and 0.05% sodium azide; filtered) for 1 h. Cells were washed three times in 0.2% Tween 20 (Sigma-Aldrich) in PBS, before incubation with secondary antibodies diluted in antibody buffer containing 0.5 μg/mL DAPI in the dark for 30 min. Samples were washed three times in 0.2% Tween 20 in PBS and once in PBS before imaging in glass bottom dishes. Airyscan confocal imaging was carried out using an LSM 880 Airyscan inverted microscope (ZEISS) equipped with a 63x/1.4 numerical aperture (NA) Plan Apochromat objective and an Airyscan 32-pinhole detector unit. DAPI was detected using a 405-nm diode laser and 420-480 nm plus 495-550 nm band pass emission filters, Alexa 488 and GFP were detected with the 488-nm line of an argon laser and 420-480 nm plus 495-550 nm band pass emission filters, and Alexa 568 was detected using a 561-nm diode-pumped solid-state laser and 495-550 nm band pass plus 570 nm long pass emission filters. Z stacks of entire cells were acquired using 0.16 μm step size. Raw data were processed using Airyscan processing with Wiener Filter strength 6 using ZEN Black software version 2.1, yielding 16-bit images with approximately 180 nm lateral resolution. Display of images was adjusted for intensity for optimal display of structures of interest. 3D data were visualized and analyzed using Imaris 9.1.2 (Bitplane, Oxford Instruments) in-built animation tool. Intensities were adjusted for optimal display purposes.
Flow cytometry analysis of mitotic cells
Cells were treated with 10 μM CX-4945 or DMSO vehicle control for 16 h before harvesting by trypsinisation. Cells were washed with 1 mg/mL BSA in PBS, before fixation and permeabilization using Fixation/Permeabilization Solution Kit (BD Biosciences) according to the manufacturer’s instructions. Cells were stained with H3-pS10 primary antibody (ab14955, Abcam, 1/100) for 1 h at RT, followed by Alexa Fluor 647 goat anti-mouse IgG1 (A-21240, Thermo Fisher Scientific, 1/200) for 1 h at RT. Cells were resuspended in 250 μg/mL RNase A, 2 μg/mL DAPI and 0.02% sodium azide in PBS, incubated at 37°C in the dark for 30 min before being analyzed using an Attune NxT flow cytometer (Thermo Fisher Scientific).
Quantification and Statistical Analysis
Each experiment was repeated at least twice, and representative experiments are depicted. Statistical calculations were done using GraphPad Prism 7 (GraphPad Software Inc.). Unpaired t tests were used to compare two populations. One-way ANOVA was used to compare more than two populations. Linear regression was used to compare clonogenic survival data. Sample sizes and α levels are indicated in the Figure Legends. In all cases: ns indicates p > 0.05.
Acknowledgments
We thank Daniel Durocher, Thanos Halazonetis, Steve Jackson, Jiri Lukas, Wojciech Niedzwiedz, and Feng Zhang for providing reagents. We are grateful to Steve Jackson and Madalena Tarsounas for critical reading of the manuscript and to Fena Ochs for help with Airyscan imaging. Imaging was performed with equipment maintained by the Center for Microscopy and Image Analysis, University of Zurich or the Wolfson Imaging Centre, Medical Research Council (MRC) Weatherall Institute of Molecular Medicine (WIMM), University of Oxford (supported by the MRC WIMM Strategic Alliance (G0902418), the MRC Molecular Haematology Unit (MC_UU_12009), the MRC Human Immunology Unit (MC_UU_12010), and the Wolfson Foundation (grant 18272). Cell sorting was carried out by the Flow Cytometry Core Facilities at the University of Zurich or MRC WIMM. The Blackford lab is supported by a Cancer Research UK Career Development Fellowship (C29215/A20772) to A.N.B. and an MRC WIMM DPhil Studentship (MR/N013468/1) to A.-M.K.S. and A.N.B. Work in the Pearl and Oliver lab is supported by Cancer Research UK Programme Grant C302/A24386. The Stucki lab is supported by the Forschungskredit Candoc program of the University of Zurich (FK-18-024) to P.-A.L., by a project grant from the Swiss National Foundation (31003A_163141), and by the Kanton of Zurich.
Author Contributions
The project was conceived and supervised by A.N.B. and M.S. Biochemical experimental work was carried out by P.-A.L., S.E.J., and A.-M.K.S. Cell biological experimental work was carried out by P.-A.L., A.-M.K.S., and M.d.M.Z. Experimental tools and reagents were generated and characterized by P.-A.L., S.E.J., J.B., M.d.M.Z., and D.B. D.F. supervised D.B. Mass spectrometry data were contributed by S.B., R.F., and B.M.K. Fluorescence polarization data and the pSer168 phospho-specific antibody were contributed by M.D., A.W.O., and L.H.P. The paper was written by A.N.B. and M.S. with contributions from other authors.
Declaration of Interests
The authors declare no competing interests.
Published: February 18, 2019
Footnotes
Supplemental Information can be found with this article online at https://doi.org/10.1016/j.molcel.2019.02.014.
Contributor Information
Andrew N. Blackford, Email: andrew.blackford@oncology.ox.ac.uk.
Manuel Stucki, Email: manuel.stucki@uzh.ch.
Supplemental Information
References
- Bang S.W., Kim G.S., Hwang D.S. Oligomerization of TopBP1 is necessary for the localization of TopBP1 to mitotic centrosomes. Biochem. Biophys. Res. Commun. 2013;436:31–34. doi: 10.1016/j.bbrc.2013.05.034. [DOI] [PubMed] [Google Scholar]
- Beausoleil S.A., Jedrychowski M., Schwartz D., Elias J.E., Villén J., Li J., Cohn M.A., Cantley L.C., Gygi S.P. Large-scale characterization of HeLa cell nuclear phosphoproteins. Proc. Natl. Acad. Sci. USA. 2004;101:12130–12135. doi: 10.1073/pnas.0404720101. [DOI] [PMC free article] [PubMed] [Google Scholar]
- Bizard A.H., Hickson I.D. Anaphase: a fortune-teller of genomic instability. Curr. Opin. Cell Biol. 2018;52:112–119. doi: 10.1016/j.ceb.2018.02.012. [DOI] [PubMed] [Google Scholar]
- Blackford A.N., Jackson S.P. ATM, ATR, and DNA-PK: the trinity at the heart of the DNA damage response. Mol. Cell. 2017;66:801–817. doi: 10.1016/j.molcel.2017.05.015. [DOI] [PubMed] [Google Scholar]
- Blackford A.N., Nieminuszczy J., Schwab R.A., Galanty Y., Jackson S.P., Niedzwiedz W. TopBP1 interacts with BLM to maintain genome stability but is dispensable for preventing BLM degradation. Mol. Cell. 2015;57:1133–1141. doi: 10.1016/j.molcel.2015.02.012. [DOI] [PMC free article] [PubMed] [Google Scholar]
- Broderick R., Nieminuszczy J., Blackford A.N., Winczura A., Niedzwiedz W. TOPBP1 recruits TOP2A to ultra-fine anaphase bridges to aid in their resolution. Nat. Commun. 2015;6:6572. doi: 10.1038/ncomms7572. [DOI] [PMC free article] [PubMed] [Google Scholar]
- Carpenter A.E., Jones T.R., Lamprecht M.R., Clarke C., Kang I.H., Friman O., Guertin D.A., Chang J.H., Lindquist R.A., Moffat J. CellProfiler: image analysis software for identifying and quantifying cell phenotypes. Genome Biol. 2006;7:R100. doi: 10.1186/gb-2006-7-10-r100. [DOI] [PMC free article] [PubMed] [Google Scholar]
- Cescutti R., Negrini S., Kohzaki M., Halazonetis T.D. TopBP1 functions with 53BP1 in the G1 DNA damage checkpoint. EMBO J. 2010;29:3723–3732. doi: 10.1038/emboj.2010.238. [DOI] [PMC free article] [PubMed] [Google Scholar]
- Chapman J.R., Jackson S.P. Phospho-dependent interactions between NBS1 and MDC1 mediate chromatin retention of the MRN complex at sites of DNA damage. EMBO Rep. 2008;9:795–801. doi: 10.1038/embor.2008.103. [DOI] [PMC free article] [PubMed] [Google Scholar]
- Chiang T.-W.W., le Sage C., Larrieu D., Demir M., Jackson S.P. CRISPR-Cas9(D10A) nickase-based genotypic and phenotypic screening to enhance genome editing. Sci. Rep. 2016;6:24356. doi: 10.1038/srep24356. [DOI] [PMC free article] [PubMed] [Google Scholar]
- Choi S.H., Yoo H.Y. Mdc1 modulates the interaction between TopBP1 and the MRN complex during DNA damage checkpoint responses. Biochem. Biophys. Res. Commun. 2016;479:5–11. doi: 10.1016/j.bbrc.2016.08.158. [DOI] [PubMed] [Google Scholar]
- Cong L., Ran F.A., Cox D., Lin S., Barretto R., Habib N., Hsu P.D., Wu X., Jiang W., Marraffini L.A., Zhang F. Multiplex genome engineering using CRISPR/Cas systems. Science. 2013;339:819–823. doi: 10.1126/science.1231143. [DOI] [PMC free article] [PubMed] [Google Scholar]
- Davis S., Charles P.D., He L., Mowlds P., Kessler B.M., Fischer R. Expanding proteome coverage with CHarge Ordered Parallel Ion aNalysis (CHOPIN) combined with broad specificity proteolysis. J. Proteome Res. 2017;16:1288–1299. doi: 10.1021/acs.jproteome.6b00915. [DOI] [PMC free article] [PubMed] [Google Scholar]
- Day M., Rappas M., Ptasinska K., Boos D., Oliver A.W., Pearl L.H. BRCT domains of the DNA damage checkpoint proteins TOPBP1/Rad4 display distinct specificities for phosphopeptide ligands. eLife. 2018;7:94. doi: 10.7554/eLife.39979. [DOI] [PMC free article] [PubMed] [Google Scholar]
- Delacroix S., Wagner J.M., Kobayashi M., Yamamoto K., Karnitz L.M. The Rad9-Hus1-Rad1 (9-1-1) clamp activates checkpoint signaling via TopBP1. Genes Dev. 2007;21:1472–1477. doi: 10.1101/gad.1547007. [DOI] [PMC free article] [PubMed] [Google Scholar]
- Dronamraju R., Mason J.M. Recognition of double strand breaks by a mutator protein (MU2) in Drosophila melanogaster. PLoS Genet. 2009;5:e1000473. doi: 10.1371/journal.pgen.1000473. [DOI] [PMC free article] [PubMed] [Google Scholar]
- Fischer R., Kessler B.M. Gel-aided sample preparation (GASP)--a simplified method for gel-assisted proteomic sample generation from protein extracts and intact cells. Proteomics. 2015;15:1224–1229. doi: 10.1002/pmic.201400436. [DOI] [PMC free article] [PubMed] [Google Scholar]
- Giunta S., Jackson S.P. Give me a break, but not in mitosis: the mitotic DNA damage response marks DNA double-strand breaks with early signaling events. Cell Cycle. 2011;10:1215–1221. doi: 10.4161/cc.10.8.15334. [DOI] [PMC free article] [PubMed] [Google Scholar]
- Giunta S., Belotserkovskaya R., Jackson S.P. DNA damage signaling in response to double-strand breaks during mitosis. J. Cell Biol. 2010;190:197–207. doi: 10.1083/jcb.200911156. [DOI] [PMC free article] [PubMed] [Google Scholar]
- Gong Z., Kim J.-E., Leung C.C.Y., Glover J.N.M., Chen J. BACH1/FANCJ acts with TopBP1 and participates early in DNA replication checkpoint control. Mol. Cell. 2010;37:438–446. doi: 10.1016/j.molcel.2010.01.002. [DOI] [PMC free article] [PubMed] [Google Scholar]
- Hari F.J., Spycher C., Jungmichel S., Pavic L., Stucki M. A divalent FHA/BRCT-binding mechanism couples the MRE11-RAD50-NBS1 complex to damaged chromatin. EMBO Rep. 2010;11:387–392. doi: 10.1038/embor.2010.30. [DOI] [PMC free article] [PubMed] [Google Scholar]
- Heijink A.M., Krajewska M., van Vugt M.A.T.M. The DNA damage response during mitosis. Mutat. Res. 2013;750:45–55. doi: 10.1016/j.mrfmmm.2013.07.003. [DOI] [PubMed] [Google Scholar]
- Huen M.S.Y., Grant R., Manke I., Minn K., Yu X., Yaffe M.B., Chen J. RNF8 transduces the DNA-damage signal via histone ubiquitylation and checkpoint protein assembly. Cell. 2007;131:901–914. doi: 10.1016/j.cell.2007.09.041. [DOI] [PMC free article] [PubMed] [Google Scholar]
- Hustedt N., Durocher D. The control of DNA repair by the cell cycle. Nat. Cell Biol. 2016;19:1–9. doi: 10.1038/ncb3452. [DOI] [PubMed] [Google Scholar]
- Jackson S.P., Bartek J. The DNA-damage response in human biology and disease. Nature. 2009;461:1071–1078. doi: 10.1038/nature08467. [DOI] [PMC free article] [PubMed] [Google Scholar]
- Kolas N.K., Chapman J.R., Nakada S., Ylanko J., Chahwan R., Sweeney F.D., Panier S., Mendez M., Wildenhain J., Thomson T.M. Orchestration of the DNA-damage response by the RNF8 ubiquitin ligase. Science. 2007;318:1637–1640. doi: 10.1126/science.1150034. [DOI] [PMC free article] [PubMed] [Google Scholar]
- Kumagai A., Shevchenko A., Shevchenko A., Dunphy W.G. Treslin collaborates with TopBP1 in triggering the initiation of DNA replication. Cell. 2010;140:349–359. doi: 10.1016/j.cell.2009.12.049. [DOI] [PMC free article] [PubMed] [Google Scholar]
- Lee J., Kumagai A., Dunphy W.G. The Rad9-Hus1-Rad1 checkpoint clamp regulates interaction of TopBP1 with ATR. J. Biol. Chem. 2007;282:28036–28044. doi: 10.1074/jbc.M704635200. [DOI] [PubMed] [Google Scholar]
- Lee D.-H., Acharya S.S., Kwon M., Drane P., Guan Y., Adelmant G., Kalev P., Shah J., Pellman D., Marto J.A., Chowdhury D. Dephosphorylation enables the recruitment of 53BP1 to double-strand DNA breaks. Mol. Cell. 2014;54:512–525. doi: 10.1016/j.molcel.2014.03.020. [DOI] [PMC free article] [PubMed] [Google Scholar]
- Leung C.C.Y., Glover J.N.M. BRCT domains: easy as one, two, three. Cell Cycle. 2011;10:2461–2470. doi: 10.4161/cc.10.15.16312. [DOI] [PMC free article] [PubMed] [Google Scholar]
- Leung C.C.Y., Sun L., Gong Z., Burkat M., Edwards R., Assmus M., Chen J., Glover J.N.M. Structural insights into recognition of MDC1 by TopBP1 in DNA replication checkpoint control. Structure. 2013;21:1450–1459. doi: 10.1016/j.str.2013.06.015. [DOI] [PMC free article] [PubMed] [Google Scholar]
- Liu K., Paik J.C., Wang B., Lin F.-T., Lin W.-C. Regulation of TopBP1 oligomerization by Akt/PKB for cell survival. EMBO J. 2006;25:4795–4807. doi: 10.1038/sj.emboj.7601355. [DOI] [PMC free article] [PubMed] [Google Scholar]
- Lloyd J., Chapman J.R., Clapperton J.A., Haire L.F., Hartsuiker E., Li J., Carr A.M., Jackson S.P., Smerdon S.J. A supramodular FHA/BRCT-repeat architecture mediates Nbs1 adaptor function in response to DNA damage. Cell. 2009;139:100–111. doi: 10.1016/j.cell.2009.07.043. [DOI] [PMC free article] [PubMed] [Google Scholar]
- Lou Z., Minter-Dykhouse K., Franco S., Gostissa M., Rivera M.A., Celeste A., Manis J.P., van Deursen J., Nussenzweig A., Paull T.T. MDC1 maintains genomic stability by participating in the amplification of ATM-dependent DNA damage signals. Mol. Cell. 2006;21:187–200. doi: 10.1016/j.molcel.2005.11.025. [DOI] [PubMed] [Google Scholar]
- Lukas C., Savic V., Bekker-Jensen S., Doil C., Neumann B., Pedersen R.S., Grøfte M., Chan K.L., Hickson I.D., Bartek J., Lukas J. 53BP1 nuclear bodies form around DNA lesions generated by mitotic transmission of chromosomes under replication stress. Nat. Cell Biol. 2011;13:243–253. doi: 10.1038/ncb2201. [DOI] [PubMed] [Google Scholar]
- Mailand N., Bekker-Jensen S., Faustrup H., Melander F., Bartek J., Lukas C., Lukas J. RNF8 ubiquitylates histones at DNA double-strand breaks and promotes assembly of repair proteins. Cell. 2007;131:887–900. doi: 10.1016/j.cell.2007.09.040. [DOI] [PubMed] [Google Scholar]
- Mason J.M., Strobel E., Green M.M. mu-2: mutator gene in Drosophila that potentiates the induction of terminal deficiencies. Proc. Natl. Acad. Sci. USA. 1984;81:6090–6094. doi: 10.1073/pnas.81.19.6090. [DOI] [PMC free article] [PubMed] [Google Scholar]
- Meggio F., Pinna L.A. One-thousand-and-one substrates of protein kinase CK2? FASEB J. 2003;17:349–368. doi: 10.1096/fj.02-0473rev. [DOI] [PubMed] [Google Scholar]
- Melander F., Bekker-Jensen S., Falck J., Bartek J., Mailand N., Lukas J. Phosphorylation of SDT repeats in the MDC1 N terminus triggers retention of NBS1 at the DNA damage-modified chromatin. J. Cell Biol. 2008;181:213–226. doi: 10.1083/jcb.200708210. [DOI] [PMC free article] [PubMed] [Google Scholar]
- Nakamura A.J., Rao V.A., Pommier Y., Bonner W.M. The complexity of phosphorylated H2AX foci formation and DNA repair assembly at DNA double-strand breaks. Cell Cycle. 2010;9:389–397. doi: 10.4161/cc.9.2.10475. [DOI] [PMC free article] [PubMed] [Google Scholar]
- Nelson G., Buhmann M., von Zglinicki T. DNA damage foci in mitosis are devoid of 53BP1. Cell Cycle. 2009;8:3379–3383. doi: 10.4161/cc.8.20.9857. [DOI] [PubMed] [Google Scholar]
- Notredame C., Higgins D.G., Heringa J. T-Coffee: A novel method for fast and accurate multiple sequence alignment. J. Mol. Biol. 2000;302:205–217. doi: 10.1006/jmbi.2000.4042. [DOI] [PubMed] [Google Scholar]
- Orthwein A., Fradet-Turcotte A., Noordermeer S.M., Canny M.D., Brun C.M., Strecker J., Escribano-Diaz C., Durocher D. Mitosis inhibits DNA double-strand break repair to guard against telomere fusions. Science. 2014;344:189–193. doi: 10.1126/science.1248024. [DOI] [PubMed] [Google Scholar]
- Orthwein A., Noordermeer S.M., Wilson M.D., Landry S., Enchev R.I., Sherker A., Munro M., Pinder J., Salsman J., Dellaire G. A mechanism for the suppression of homologous recombination in G1 cells. Nature. 2015;528:422–426. doi: 10.1038/nature16142. [DOI] [PMC free article] [PubMed] [Google Scholar] [Retracted]
- Pedersen R.T., Kruse T., Nilsson J., Oestergaard V.H., Lisby M. TopBP1 is required at mitosis to reduce transmission of DNA damage to G1 daughter cells. J. Cell Biol. 2015;210:565–582. doi: 10.1083/jcb.201502107. [DOI] [PMC free article] [PubMed] [Google Scholar]
- Ran F.A., Hsu P.D., Wright J., Agarwala V., Scott D.A., Zhang F. Genome engineering using the CRISPR-Cas9 system. Nat. Protoc. 2013;8:2281–2308. doi: 10.1038/nprot.2013.143. [DOI] [PMC free article] [PubMed] [Google Scholar]
- Rappas M., Oliver A.W., Pearl L.H. Structure and function of the Rad9-binding region of the DNA-damage checkpoint adaptor TopBP1. Nucleic Acids Res. 2011;39:313–324. doi: 10.1093/nar/gkq743. [DOI] [PMC free article] [PubMed] [Google Scholar]
- Rieder C.L., Cole R.W. Entry into mitosis in vertebrate somatic cells is guarded by a chromosome damage checkpoint that reverses the cell cycle when triggered during early but not late prophase. J. Cell Biol. 1998;142:1013–1022. doi: 10.1083/jcb.142.4.1013. [DOI] [PMC free article] [PubMed] [Google Scholar]
- Rizk A., Paul G., Incardona P., Bugarski M., Mansouri M., Niemann A., Ziegler U., Berger P., Sbalzarini I.F. Segmentation and quantification of subcellular structures in fluorescence microscopy images using Squassh. Nat. Protoc. 2014;9:586–596. doi: 10.1038/nprot.2014.037. [DOI] [PubMed] [Google Scholar]
- Rogakou E.P., Boon C., Redon C., Bonner W.M. Megabase chromatin domains involved in DNA double-strand breaks in vivo. J. Cell Biol. 1999;146:905–916. doi: 10.1083/jcb.146.5.905. [DOI] [PMC free article] [PubMed] [Google Scholar]
- Schindelin J., Arganda-Carreras I., Frise E., Kaynig V., Longair M., Pietzsch T., Preibisch S., Rueden C., Saalfeld S., Schmid B. Fiji: an open-source platform for biological-image analysis. Nat. Methods. 2012;9:676–682. doi: 10.1038/nmeth.2019. [DOI] [PMC free article] [PubMed] [Google Scholar]
- Siddiqui-Jain A., Drygin D., Streiner N., Chua P., Pierre F., O’Brien S.E., Bliesath J., Omori M., Huser N., Ho C. CX-4945, an orally bioavailable selective inhibitor of protein kinase CK2, inhibits prosurvival and angiogenic signaling and exhibits antitumor efficacy. Cancer Res. 2010;70:10288–10298. doi: 10.1158/0008-5472.CAN-10-1893. [DOI] [PubMed] [Google Scholar]
- Spycher C., Miller E.S., Townsend K., Pavic L., Morrice N.A., Janscak P., Stewart G.S., Stucki M. Constitutive phosphorylation of MDC1 physically links the MRE11-RAD50-NBS1 complex to damaged chromatin. J. Cell Biol. 2008;181:227–240. doi: 10.1083/jcb.200709008. [DOI] [PMC free article] [PubMed] [Google Scholar]
- Stewart G.S., Wang B., Bignell C.R., Taylor A.M.R., Elledge S.J. MDC1 is a mediator of the mammalian DNA damage checkpoint. Nature. 2003;421:961–966. doi: 10.1038/nature01446. [DOI] [PubMed] [Google Scholar]
- Stucki M., Clapperton J.A., Mohammad D., Yaffe M.B., Smerdon S.J., Jackson S.P. MDC1 directly binds phosphorylated histone H2AX to regulate cellular responses to DNA double-strand breaks. Cell. 2005;123:1213–1226. doi: 10.1016/j.cell.2005.09.038. [DOI] [PubMed] [Google Scholar]
- Sun L., Huang Y., Edwards R.A., Yang S., Blackford A.N., Niedzwiedz W., Glover J.N.M. Structural Insight into BLM Recognition by TopBP1. Structure. 2017;25:1582–1588.e1583. doi: 10.1016/j.str.2017.08.005. [DOI] [PMC free article] [PubMed] [Google Scholar]
- van Vugt M.A.T.M., Gardino A.K., Linding R., Ostheimer G.J., Reinhardt H.C., Ong S.-E., Tan C.S., Miao H., Keezer S.M., Li J. A mitotic phosphorylation feedback network connects Cdk1, Plk1, 53BP1, and Chk2 to inactivate the G(2)/M DNA damage checkpoint. PLoS Biol. 2010;8:e1000287. doi: 10.1371/journal.pbio.1000287. [DOI] [PMC free article] [PubMed] [Google Scholar]
- Vizcaíno J.A., Csordas A., del-Toro N., Dianes J.A., Griss J., Lavidas I., Mayer G., Perez-Riverol Y., Reisinger F., Ternent T. 2016 update of the PRIDE database and its related tools. Nucleic Acids Res. 2016;44(D1):D447–D456. doi: 10.1093/nar/gkv1145. [DOI] [PMC free article] [PubMed] [Google Scholar]
- Wang J., Gong Z., Chen J. MDC1 collaborates with TopBP1 in DNA replication checkpoint control. J. Cell Biol. 2011;193:267–273. doi: 10.1083/jcb.201010026. [DOI] [PMC free article] [PubMed] [Google Scholar]
- Wu L., Luo K., Lou Z., Chen J. MDC1 regulates intra-S-phase checkpoint by targeting NBS1 to DNA double-strand breaks. Proc. Natl. Acad. Sci. USA. 2008;105:11200–11205. doi: 10.1073/pnas.0802885105. [DOI] [PMC free article] [PubMed] [Google Scholar]
- Yi T., Zhai B., Yu Y., Kiyotsugu Y., Raschle T., Etzkorn M., Seo H.-C., Nagiec M., Luna R.E., Reinherz E.L. Quantitative phosphoproteomic analysis reveals system-wide signaling pathways downstream of SDF-1/CXCR4 in breast cancer stem cells. Proc. Natl. Acad. Sci. USA. 2014;111:E2182–E2190. doi: 10.1073/pnas.1404943111. [DOI] [PMC free article] [PubMed] [Google Scholar]
Associated Data
This section collects any data citations, data availability statements, or supplementary materials included in this article.