

Abstract
Ethanol causes dysregulated muscle protein homeostasis while simultaneously causing hepatocyte injury. Because hepatocytes are the primary site for physiological disposal of ammonia, a cytotoxic cellular metabolite generated during a number of metabolic processes, we determined whether hyperammonemia aggravates ethanol-induced muscle loss. Differentiated murine C2C12 myotubes, skeletal muscle from pair-fed or ethanol-treated mice, and human patients with alcoholic cirrhosis and healthy controls were used to quantify protein synthesis, mammalian target of rapamycin complex 1 (mTORC1) signaling, and autophagy markers. Alcohol-metabolizing enzyme expression and activity in mouse muscle and myotubes and ureagenesis in hepatocytes were quantified. Expression and regulation of the ammonia transporters, RhBG and RhCG, were quantified by real-time PCR, immunoblots, reporter assays, biotin-tagged promoter pulldown with proteomics, and loss-of-function studies. Alcohol and aldehyde dehydrogenases were expressed and active in myotubes. Ethanol exposure impaired hepatocyte ureagenesis, induced muscle RhBG expression, and elevated muscle ammonia concentrations. Simultaneous ethanol and ammonia treatment impaired protein synthesis and mTORC1 signaling and increased autophagy with a consequent decreased myotube diameter to a greater extent than either treatment alone. Ethanol treatment and withdrawal followed by ammonia exposure resulted in greater impairment in muscle signaling and protein synthesis than ammonia treatment in ethanol-naive myotubes. Of the three transcription factors that were bound to the RhBG promoter in response to ethanol and ammonia, DR1/NC2 indirectly regulated transcription of RhBG during ethanol and ammonia treatment. Direct effects of ethanol were synergistic with increased ammonia uptake in causing dysregulated skeletal muscle proteostasis and signaling perturbations with a more severe sarcopenic phenotype.
Keywords: proteostasis, signaling, autophagy, ammonia, skeletal muscle, RhBG, sarcopenia
Introduction
Skeletal muscle loss is a consistent manifestation of chronic alcohol use and in patients with alcoholic liver disease (ALD)4 (1–3). Clinical observations have suggested a more severe phenotype of skeletal muscle loss with ALD than in nonalcoholic liver disease, but the mechanistic basis of these observations is not known (1). We and others have reported impaired muscle protein synthesis and increased autophagy and unaltered proteasome-mediated proteolysis by ethanol (4–14). It is believed that the adverse consequences are primarily due to direct ethanol-mediated effects on the skeletal muscle with circulating acetaldehyde from hepatic metabolism of ethanol contributing to dysregulated proteostasis in the skeletal muscle (4, 11, 15–17). Even though ethanol is metabolized in a number of organs, it is not known whether ethanol is directly metabolized in the skeletal muscle, and the acetaldehyde generated locally contributes to the perturbed proteostasis (18, 19). Myotubes treated with ethanol alone as well in combination with chemical inhibitors of alcohol and acetaldehyde dehydrogenase demonstrated increased autophagy by acetaldehyde (4). These data suggest but do not directly show that ethanol is metabolized in the skeletal muscle. It is not known whether alcohol and acetaldehyde dehydrogenase expression or activity occurs in the muscle of mammals. To determine this, we quantified the expression of ethanol-metabolizing enzymes and their activity in skeletal muscle from ethanol-treated mice as well as murine myotubes and studied their responses to ethanol exposure.
In addition to ethanol-induced changes in proteostasis, ethanol also causes hepatocellular dysfunction with impaired ureagenesis (20–23). Impaired ureagenesis results in hyperammonemia in liver disease (24–26). It is not known whether hepatic ureagenesis is impaired in response to ethanol or its metabolite, acetaldehyde, but there is emerging data that acetaldehyde impairs hepatic ureagenesis (27). During hepatocellular dysfunction and hyperammonemia, the skeletal muscle becomes a metabolic partner to the liver with increased muscle uptake of ammonia (28–30). This is relevant because hyperammonemia results in dysregulated skeletal muscle proteostasis with impaired protein synthesis and increased autophagy and consequent sarcopenia (28, 31–36). These data suggest that, in addition to the direct effects of ethanol or acetaldehyde on muscle proteostasis, increased muscle ammonia uptake can perturb the molecular and metabolic responses with muscle loss. Expression of the RhBG ammonia transport protein has been reported in the skeletal muscle suggesting its involvement in muscle ammonia uptake.(37, 38). Limited data are available on the regulation of RhBG expression in the skeletal muscle. Additionally, in patients with alcoholic liver disease, muscle loss persists even after stopping drinking that may be due to persistent hepatocyte dysfunction and hyperammonemia. Whether prior ethanol exposure sensitizes the skeletal muscle to hyperammonemia of the underlying liver disease is a clinically relevant mechanistic question. To address this, we evaluated proteostasis and signaling responses in differentiated myotubes pretreated with ethanol followed by ethanol withdrawal and subsequent ammonia treatment. Finally, we also tested whether ethanol directly alters skeletal muscle ammonia uptake and alters the expression of the RhBG ammonia transporter.
In this study, we determined protein synthesis and autophagy markers in myotubes in response to ethanol, ammonium acetate, ethanol pretreatment followed by ammonium acetate, and combined ethanol and ammonium acetate treatment. Because translational control in protein homeostasis is critical for cellular function (39), a number of signaling pathways intersect at multiple regulatory levels. Therefore, focusing on a single regulatory pathway may not provide true mechanistic insights into the responses observed with interventions that alter muscle protein homeostasis. Critical regulators of muscle proteostasis include mTORC1 signaling (increases protein synthesis) and phosphorylation of the α subunit of eukaryotic initiation factor 2 (decreases protein synthesis) (28), both of which were quantified in myotubes and muscle tissue. We also quantified skeletal muscle alcohol and acetaldehyde dehydrogenase activity in myotubes and skeletal muscle from ethanol-fed mice because it is not yet known whether ethanol-metabolizing enzymes are expressed and are active in the muscle tissue, and if ethanol metabolism in the muscle can generate cytotoxic acetaldehyde locally. Finally, using RhBG luciferase reporters, including full-length and deletional constructs, we determined the regulation of the ammonia transporter in response to ethanol, ammonia, and both in combination. We also sought to identify the mechanistic basis for more severe muscle loss with ethanol exposure, and we determined whether ethanol or its metabolite, acetaldehyde, directly reduces muscle loss and, additionally via impaired ureagenesis in the liver, aggravates signaling and protein synthesis via hyperammonemia, a known mediator of the liver–muscle axis. Finally, even though RhBG is a TATA-less promoter, using a promoter pulldown with proteomics to identify transcription factors that bind to the RhBG promoter we noted that down-regulation of transcription/negative control 2 (DR1/NC2) indirectly regulated RhBG transcription in response to ethanol and ammonia in the muscle.
Results
Ethanol impairs ureagenesis in hepatocytes and results in more severe muscle hyperammonemia
In murine primary hepatocytes, ethanol exposure resulted in decreased urea synthesis measured by urea concentrations in the medium (Fig. 1A). Because ureagenesis in the hepatocytes is the major mechanism of ammonia metabolism, ammonia concentrations in the medium in response to ethanol were higher than in the medium from untreated controls (Fig. 1B). In AML12 cell lines, lower urea and higher ammonia concentrations were noted in response to ethanol treatment compared with controls (Fig. S1, A and B). However, in contrast to the response in primary hepatocytes, ureagenesis by AML12 was lower. We also observed that ammonia concentration in ethanol-treated myotubes and in the plasma and skeletal muscle of mice exposed to ethanol was significantly higher (p < 0.001) compared with appropriate controls (Fig. 1C). To determine how ethanol exposure and hyperammonemia cause an increase in muscle ammonia concentrations, we determined the expression of ammonia transporters, RhBG and RhCG mRNA and protein in myotubes and skeletal muscle from mice and human subjects.
Figure 1.
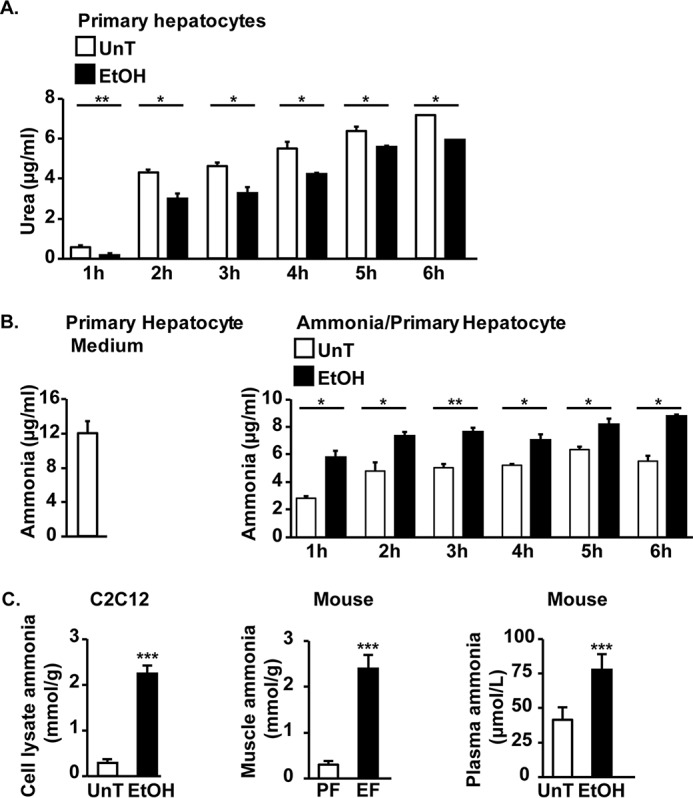
Ethanol exposure impairs ureagenesis in primary hepatocyte and increases plasma and muscle ammonia concentrations. A and B, concentrations of urea and ammonia in the medium from murine primary hepatocytes treated for different time points with 100 mm ethanol (EtOH). C, ammonia concentration in plasma and skeletal muscle from ethanol-fed (EF) or pair-fed (PF) mice and myotubes treated with 100 mm ethanol for 24 h. Data are expressed as mean ± S.E. from at least three biological replicates. *, p < 0.05; **, p < 0.01; ***, p < 0.001 versus untreated (UnT) controls.
Ethanol and hyperammonemia independently up-regulate skeletal muscle RhBG ammonia transporter expression
Ethanol treatment and hyperammonemia independently increased ammonia transporter, RhBG protein, and mRNA expression but not RhCG protein in myotubes (Fig. 2, A and B). A combination of ethanol and hyperammonemia also increased the expression of RhBG protein, but ethanol withdrawal followed by ammonia resulted in an even greater increase in RhBG expression (Fig. 2C). Skeletal muscle from ethanol-fed or ammonia-treated mice and human cirrhotic patients also showed increased expression of RhBG mRNA and protein but not RhCG in skeletal muscle compared with that in muscle from controls (Fig. 2, D and E).
Figure 2.
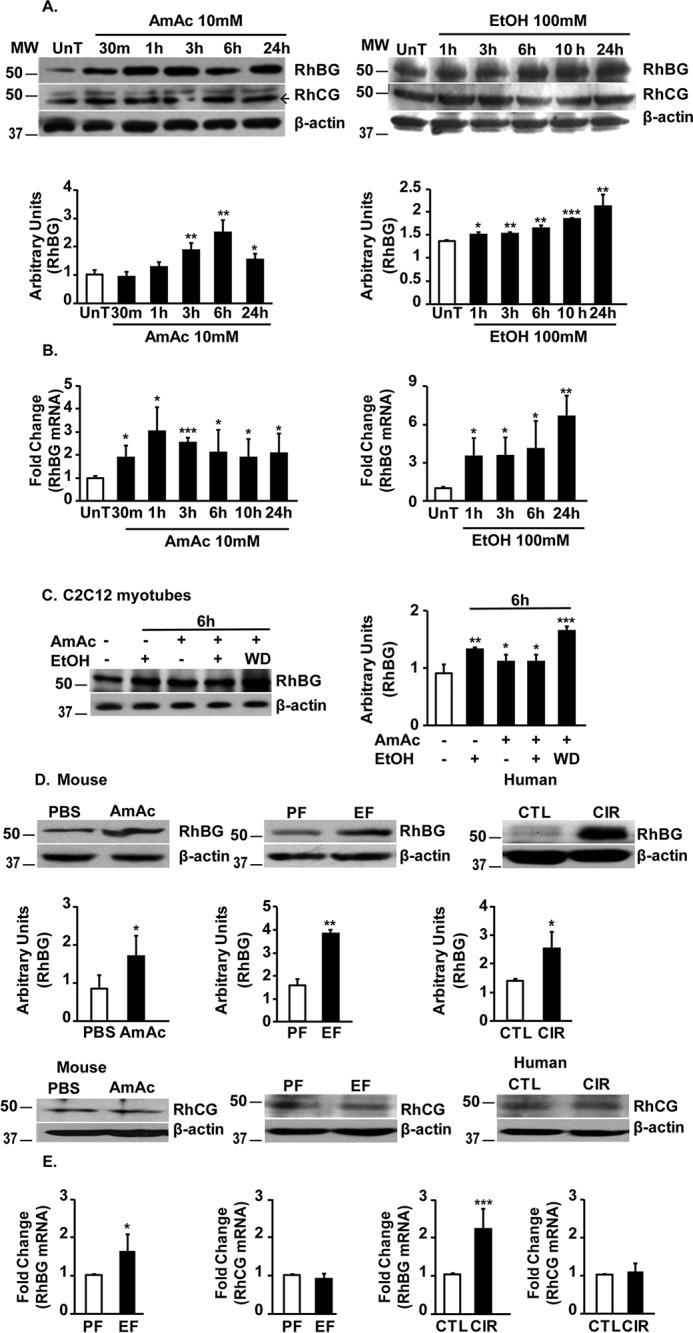
Ethanol and hyperammonemia independently increase skeletal muscle RhBG expression. A, representative immunoblots and densitometry for ammonia transporters, RhBG and RhCG, in C2C12 myotubes treated with 10 mm ammonium acetate (AmAc) or 100 mm ethanol (EtOH) for different time points. UnT, untreated. B, fold change in expression of RhBG mRNA by real-time PCR in C2C12 myotubes treated with 10 mm ammonium acetate or 100 mm ethanol for different time points. C, representative immunoblots and densitometry of ammonia transporter, RhBG, expression in murine C2C12 myotubes treated with 100 mm ethanol, 10 mm ammonium acetate, both, or 10 mm ammonium acetate for 6 h after ethanol withdrawal (WD). D, representative immunoblots and densitometry of RhBG expression and representative immunoblots of RhCG expression in gastrocnemius muscle from hyperammonemic and control (CTL) (n = 3 each), chronic ethanol-fed (EF) and pair-fed (PF) mice (n = 3 each) and skeletal muscle from patients with cirrhosis (CIR) and control subjects (n = 4 each). E, fold change in expression of ammonia transporters, RhBG mRNA and RhCG mRNA, by real-time PCR, in chronic ethanol- or pair-fed mice (n = 3 each) and patients with alcoholic cirrhosis and controls (n = 4 each). All data are expressed as mean ± S.D. *, p < 0.05; **, p < 0.01; ***, p < 0.001 versus controls.
Consistently, the reporter assay for RhBG showed that both ethanol and ammonia increased luciferase activity in myotubes (Fig. 3A). Interestingly, the combination of ethanol and ammonia resulted in greater luciferase reporter activity than either alone (Fig. 3A). Both ethanol and its key toxic metabolite, acetaldehyde, increased RhBG promoter activity (Fig. 3B). Consistent with our previous work that blocking the metabolism of ethanol using 4-methylpyrazole or acetaldehyde metabolism with cyanamide increased autophagy in myotubes, we also observed that both ethanol and acetaldehyde increased the ammonia transporter, RhBG, reporter activity (Fig. 3, C and D). Interestingly, we did not observe a similar increase in expression of RhBG protein in primary hepatocytes or AML12 cells in response to ethanol treatment (Fig. S1C).
Figure 3.
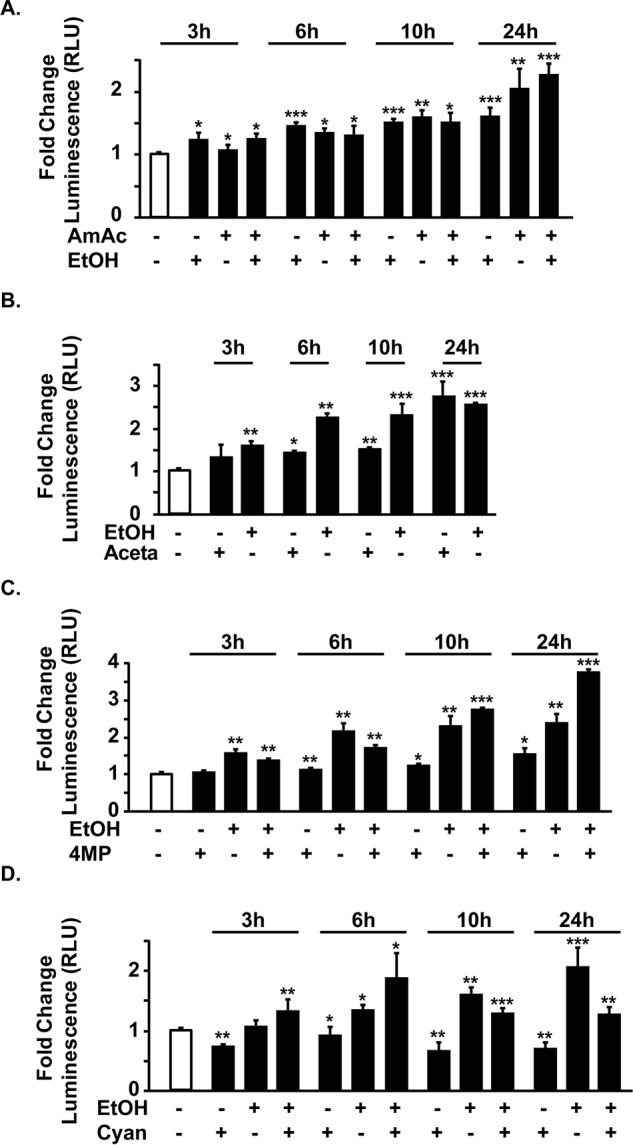
Transcriptional up-regulation of RhBG by ethanol and hyperammonemia. Murine C2C12 cells transfected with the empty plasmid (pGL3) or RhBG promoter (pGL3-RhBG) with Renilla plasmid and differentiated to myotubes and treated as below with different interventions for stated times. Data are expressed as relative luciferase units (RLU) of luminescence of luciferase/Renilla. A, RhBG transcriptional response by reporter assay in response to 10 mm ammonium acetate, 100 mm ethanol, or both. B, response of RhBG reporter in to 100 mm ethanol or 1 mm acetaldehyde. C, response of RhBG reporter to 100 mm ethanol with and without 1 mm 4-methylpyrazole, an alcohol dehydrogenase inhibitor. D, response of RhBG reporter in to 100 mm ethanol with and without 0.3 mm cyanamide, an acetaldehyde dehydrogenase inhibitor. All data are from at least three biological replicates expressed as mean ± S.E. of the pGL3-RhBG luciferase activity relative to pGL3-Basic. EtOH, ethanol; AmAc, ammonium acetate; Aceta, acetaldehyde; Cyana, cyanamide; 4-MP, 4-methylpyrazole. *, p < 0.05; **, p < 0.01; ***, p < 0.001 versus untreated controls.
Transfection of previously published full-length and deletional constructs of RhBG luciferase reporter (Fig. 4A) (40) in murine myotubes showed that, similar to that in HepG2 cells, deletion upstream of 22 bp from the transcription start site resulted in loss of reporter activity. However, unlike in HepG2 cells (40), deletion from −180 to −1499 resulted in attenuation of the reporter activity, but reporter activity increased in the constructs between −60 and −120 bp upstream of the TSS compared with the full-length promoter construct (Fig. 4D). These suggested possible context-specific repressors or enhancers specific to the skeletal muscle. Biotin-tagged promoter pulldown of DNA-binding proteins (Table S1) was then analyzed for transcription factors that were bound to the promoter. Of a total of 17 transcription factors that were bound in response to either hyperammonemia or ethanol exposure, three factors were identified that were bound to the RhBG promoter under all conditions (Fig. 4B) and included FoxPI, PBX1, and the general transcriptional repressor DR1/NC2. Analysis of the known RhBG promoter sequence showed multiple binding sites for FoxP1 and PBX1 with a high level of confidence (p < 0.001 cutoff) (Fig. 4C). Because DR1/NC2 does not bind directly to promoters (41, 42), the consensus sites for DR1/NC2 binding have not been identified, but DR1/NC2-dependent transcriptional regulation is mediated via TATA-binding proteins or other binding partners. Even though RhBG is a TATA-less promoter (40) and DR1/NC2 was initially identified to repress transcription of genes with TATA box–containing promoters (41, 42), subsequent investigations showed that DR1/NC2 can repress genes with TATA-less promoters (43). Although RhBG does not have a canonical element, it does have a TGAAA (at −30 from the TSS) that is a TATA-like element. These are much more frequent than canonical TATA elements and could be responsible for mediating the DR1/NC2 effects. Based on the putative binding sites of the two transcription factors identified to bind to the RhBG promoter, we used our reporter constructs to determine the response to ethanol, ammonia, and a combination of ethanol and ammonia (Fig. 4D). Compared with untreated control cells, the full-length reporter showed increased luciferase activity in response to hyperammonemia, ethanol, or a combination of ethanol and ammonia. However, with sequential deletion on the full-length promoter upstream of the transcription start site, there was a reduction in luciferase activity (−1499 to −240) followed by an increase in luciferase activity in response to the interventions with a marked reduction in luciferase activity in the construct only 22 bp upstream of the TSS. However, with the intervention, from −1499 to −180, there was increased luciferase activity compared with the response in the untreated control cells. Further deletion of promoter sites resulted in an increase in luciferase activity, but those constructs were not responsive to ethanol or ammonia. These suggest that regulation by ammonia or ethanol occurs at the sites from −1499 to −180 from the TSS on the RhBG promoter. Complementary studies using genetic depletion of the transcription factors were then performed with significant silencing efficiency (Fig. 4E). Depletion of DR1/NC2 and PBX1 resulted in an increase in luciferase activity in the untreated cells, suggesting that they functioned as repressors for promoter activity (Fig. 4F). We noted that depletion of the negative regulator of transcription, DR1/NC2, resulted in loss of response to ammonia or ethanol, whereas PBX1 depletion resulted in continued response, albeit at a higher basal activity in response to the interventions. Finally, depletion of FoxP1 did not affect either baseline response in untreated cells or the response to interventions and was similar to that observed with myotubes transfected with a random construct. These data suggested that DR1/NC2 regulated RhBG promoter activity. Our observations of an increased RhBG expression and reporter activity of the TATA-less promoter suggested that ethanol and ammonia regulate RhBG potentially by inhibiting RhBG repressors. This interpretation is consistent with the responses to ethanol and ammonia in the deletional constructs.
Figure 4.

Regulation of RhBG promoter in response to ethanol and hyperammonemia. A, RhBG full-length and deletion constructs were cloned in pGL3 basic vector. Arrow denotes TSS. B, Venn diagram of transcription factors bound to full-length RhBG promoter in response to 10 mm ammonium acetate (AmAc) or 100 mm ethanol for stated times in hours (h) identified by proteomics from biotin-tagged full-length promoter pulldown assay. C, bioinformatics analysis of the RhBG promoter to identify consensus sequences for the transcription factors that were identified by promoter pulldown assay. D, reporter assay in C2C12 myoblasts transfected with full-length RhBG promoter or the indicated construct subcloned in pGL3 with Renilla plasmid. Untr, luciferase activity with no treatment. 24 h of treatment with 100 mm ethanol (EtOH), 10 mm ammonium acetate (AmAc), or both ethanol and ammonium acetate (A+E) are shown. All data are expressed as fold change compared with untreated control cells. E, representative immunoblots of the three transcription factors that were bound to the RhBG promoter in C2C12 myotubes with mock or shRNA transfection. F, reporter activity of full-length RhBG promoter in myotubes with silencing of DR1, FoxP1, and PBX1 in response to 100 mm ethanol, 10 mm ammonium acetate, or both for 24 h. Luciferase activity was expressed as fold change compared with untreated (Untr) control cells for each group (shRandom, shDR1, shFoxP1, and shPBX1). Data are expressed as mean of at least three biological replicates expressed as mean ± S.E. of the pGL3-RhBG construct normalized with Renilla response. *, p < 0.05; **, p < 0.01; ***, p < 0.001.
Having identified putative binding sites and responses in promoter constructs and reporters, expression of the transcription factors was quantified by immunoblots. Expression of DR1 and FoxP1 was increased in whole-cell lysates, whereas PBX1 was unaltered in response to the interventions. Given the consistency in binding of DR1/NC2 to the promoter, increased expression of DR1 and FoxP1 during hyperammonemia and ethanol with ammonia was noted (Fig. 5, A and B), whereas PBX1 expression was unchanged in response to the interventions (Fig. 5C). Even though DR1/NC2 is a negative regulator of transcription, we investigated whether depletion of the general transcriptional repressor, DR1/NC2, alters RhBG expression (Fig. 5D). DR1/NC2 depletion resulted in only a mild increase in RhBG protein expression. However, consistent with the reporter activity data, depletion of DR1/NC2 resulted in loss of response to interventions. Interestingly, PBX1 depletion also increased baseline luciferase activity of the reporter for RhBG promoter, but the responses to ethanol and ammonia were maintained suggesting that PBX1 may negatively regulate the RhBG promoter, and the maintenance of responses to ethanol and ammonia despite depletion of PBX1 suggested that the increased RhBG was independent of this transcription factor. We then tested whether skeletal muscle hyperammonemia during ethanol exposure worsened the sarcopenic phenotype and dysregulated proteostasis by quantifying the myotube diameter, protein synthesis, and autophagy markers in myotubes.
Figure 5.
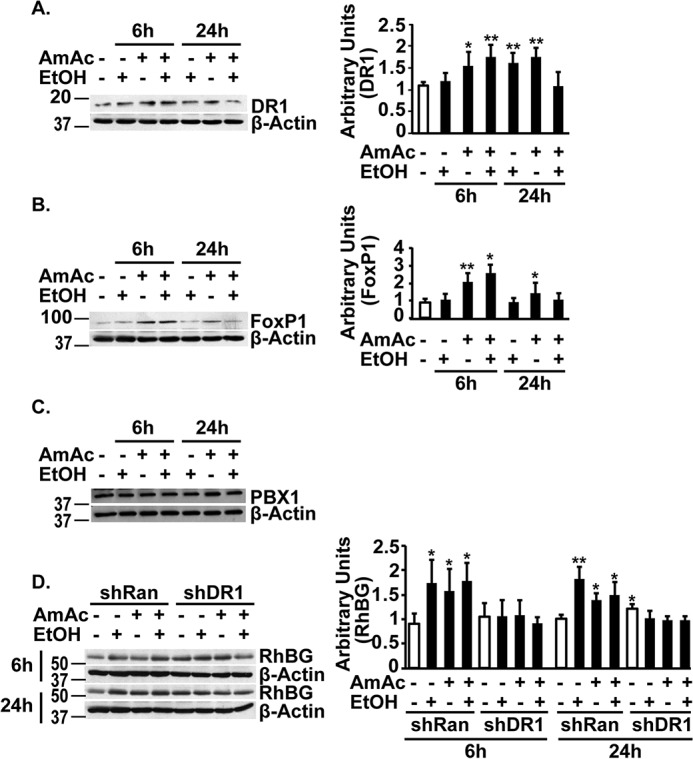
Expression of transcription factors in response to ethanol or ammonia. A–C, representative immunoblots and densitometry of transcription factor Dr1 and FoxP1 and immunoblots of PBX1 in murine C2C12 myotubes treated with 100 mm ethanol (EtOH), 10 mm ammonium acetate (AmAc), or both EtOH and ammonium acetate for 6 and 24 h. D, representative immunoblots and densitometry of RhBG protein in C2C12 myotubes with either mock transfection or shDR1 treated with 100 mm ethanol, 10 mm ammonium acetate, or both for 6 and 24 h. All data are expressed as mean ± S.D. from at least three biological replicates. *, p < 0.05; **, p < 0.01; ***, p < 0.001.
Ethanol-induced reduction in myotube diameter and proteostasis were worsened by ammonia
Myotube diameter and protein synthesis in myotubes were significantly decreased, and autophagy markers showed increased expression in response to ethanol exposure for 6 and 24 h (Fig. 6, A–C; Fig. S2). Consistent with our previous reports, ammonia exposure resulted in reduced protein synthesis, increased autophagy markers, and lower myotube diameter, all of which are characteristics of a sarcopenic phenotype in myotubes (29, 36). A combination of ethanol and ammonium acetate resulted in greater reduction in myotube diameter and protein synthesis and increased autophagy markers than either ethanol or ammonium acetate alone. Finally, ethanol withdrawal followed by ammonia exposure resulted in greater impairment of protein synthesis and increased autophagy markers than either treatment alone (Fig. 6C).
Figure 6.
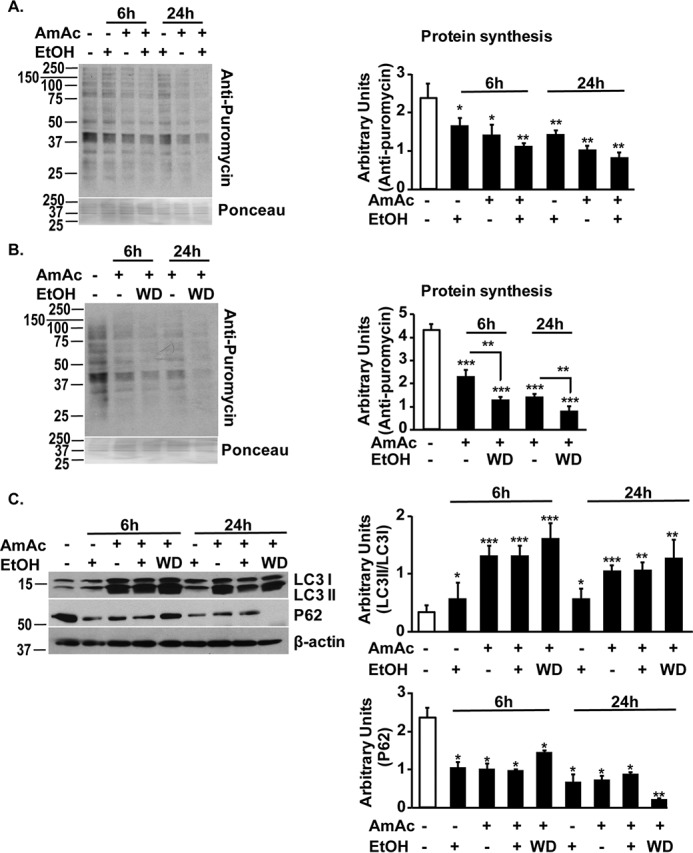
Ethanol and hyperammonemia independently cause dysregulated proteostasis. A, representative immunoblots and densitometry (from the entire lane) for puromycin incorporation in murine C2C12 myotubes treated with 100 mm ethanol, 10 mm ammonium acetate, or both for 6 and 24 h. B, representative immunoblots and densitometry for puromycin incorporation in murine C2C12 myotubes in response to treatment with 10 mm ammonium acetate following withdrawal of 100 mm ethanol. C, representative immunoblots and densitometries of LC3 lipidation and P62 showed increased autophagy in response to 10 mm ammonium acetate treatment for 6 and 24 h following withdrawal of 100 mm ethanol. Treatment with ethanol alone showed less autophagy compared with ethanol with hyperammonemia or hyperammonemia following ethanol withdrawal. All myotube data are from at least three biological replicates. EtOH, ethanol; AmAc, ammonium acetate; WD, ethanol withdrawal followed by ammonium acetate treatment. *, p < 0.05; **, p < 0.01; ***, p < 0.001 versus untreated controls.
Muscle proteostasis is regulated by multiple signaling molecules, including the TGFβ superfamily member myostatin, its downstream targets AMPK and mTORC1, and phosphorylation of eIF2α (28). Even though specific perturbations in regulation of each of these molecules have been reported to result in a sarcopenic phenotype, we determined the alterations in expression of the regulatory components of this integrated pathway of muscle proteostasis. Because mTORC1 is a critical regulator of proteostasis, and muscle hyperammonemia occurs during and after ethanol exposure, we determined the perturbations in signaling pathways altered by hyperammonemia, ethanol treatment, and hyperammonemia following ethanol exposure.
Perturbations in signaling pathways were more severe with hyperammonemia following ethanol exposure
Consistent with a more severe phenotype of reduced myotube diameter and dysregulated proteostasis with ethanol and hyperammonemia, mTOR phosphorylation and mTORC1 signaling determined by phosphorylation of P70S6 kinase and ribosomal S6 protein were impaired by ethanol and ammonia at 6 h with greater impairment at 24 h. Similar observations were noted in myotubes treated with simultaneous ethanol and hyperammonemia, and ethanol treatment followed by hyperammonemia also resulted in impaired mTOR phosphorylation and mTORC1 signaling (Fig. 7). Because ethanol and ammonia induce cellular stress and inhibit protein synthesis via phosphorylation of eIF2α with global repression of mRNA translation and protein synthesis as well as inhibiting mTORC1 signaling, we then tested whether eIF2α phosphorylation occurs during ethanol and ammonia exposure.
Figure 7.

Impaired mTORC1 signaling in C2C12 myotubes during ethanol treatment and hyperammonemia. Representative immunoblots and densitometry of phosphorylated mTOR (Ser2448) and signaling response to mTORC1 activation (phosphorylation of P70S6 kinase and ribosomal S6 protein) in murine C2C12 myotubes were treated with 100 mm ethanol, 10 mm ammonium acetate, both ethanol and ammonium acetate, or 10 mm ammonium acetate following ethanol withdrawal for stated time points. EtOH, 100 mm ethanol; AmAc, 10 mm ammonium acetate; WD, ethanol withdrawal followed by 10 mm ammonium acetate treatment. All data are expressed as mean ± S.D. from at least three biological replicates. *, p < 0.05; **, p < 0.01; ***, p < 0.001 versus untreated controls.
Phosphorylated eIF2α (eIF2α-P) expression was increased in myotubes during ethanol or ammonia treatment and to a greater extent with both ethanol and ammonia (Fig. 8A). Ethanol withdrawal followed by hyperammonemia increased eIF2α-P. Of the eIF2α kinases in the skeletal muscle, GCN2 phosphorylation and activation were observed with both ethanol and hyperammonemia, but to a greater extent in response to simultaneous ethanol treatment and hyperammonemia. Ethanol withdrawal followed by hyperammonemia also resulted in significantly higher GCN2 activation compared with either treatment alone. The other eIF2α kinase, protein kinase R–like endoplasmic reticulum kinase (PERK) was not activated as noted by the lack of mobility shift in response to ethanol, hyperammonemia, a combination of the two, or hyperammonemia following ethanol withdrawal (Fig. 8A). Increased eIF2α-P and GCN2 phosphorylation without PERK activation were also observed in pair- or ethanol-fed mice and human alcoholic cirrhosis and controls (Fig. 8B).
Figure 8.

Ethanol and ammonia result in phosphorylation of eIF2α and AMPK. A, representative immunoblots and densitometry of phosphorylated GCN2 and eIF2α in murine C2C12 myotubes' exposure to 100 mm ethanol, 10 mm ammonium acetate, both ethanol and ammonium acetate, or 10 mm ammonium acetate following withdrawal of 100 mm ethanol for 6 and 24 h. No PERK activation was determined by lack of mobility shift on electrophoresis. B, representative immunoblots and densitometry of phosphorylated GCN2 and eIF2α, and no PERK activation was determined by lack of mobility shift in gastrocnemius muscle from ethanol- (EF) and pair-fed (PF) mice (n = 3 each) and skeletal muscle from patients with alcoholic cirrhosis (CIR) and controls (CTL) (n = 3 each). C, representative immunoblots and densitometry of myostatin and phospho-AMPK in myotubes treated with 100 mm ethanol or 10 mm ammonium acetate alone, both ethanol and ammonium acetate, and 10 mm ammonium acetate following ethanol withdrawal for 6 and 24 h. EtOH, ethanol; AmAc, ammonium acetate; WD, ethanol withdrawal followed by ammonium acetate treatment. All data are expressed as mean ± S.D. Densitometry was determined from at least three biological replicates for studies in myotubes. *, p < 0.05; **, p < 0.01; ***, p < 0.001 versus controls.
In addition to the cellular stress response, myostatin is another known inhibitor of protein synthesis and muscle loss. Expression of myostatin was increased by ethanol treatment, hyperammonemia, and a combination of ethanol and hyperammonemia (Fig. 8C). However, phosphorylation of AMPK, a downstream target of myostatin, was increased with ammonia exposure and ethanol withdrawal followed by ammonia exposure but not with ethanol alone or ethanol in combination with ammonia (Fig. 8C). Finally, even though ethanol-induced perturbations were identified in multiple systems, whether ethanol is metabolized in the myotubes is currently unknown.
Ethanol is directly metabolized in the skeletal muscle
In addition to the direct effects of ethanol on the muscle as observed with the use of 4-methylpyrazole, an ADH inhibitor, ADH and ALDH enzyme activity was noted in murine myotubes and skeletal muscle from mice acutely or chronically treated with ethanol suggesting that ethanol was directly metabolized in the muscle (Fig. 9, A–D). Transcriptional expression of ADH3 and ALDH2 was increased in the skeletal muscle in response to ethanol exposure (Fig. S3).
Figure 9.

Skeletal muscle expression and activity of ethanol-metabolizing enzymes. A and B, C2C12 myotubes were treated with 100 mm ethanol, 10 mm ammonium acetate, and in combination of ethanol and ammonium acetate for the stated times. UnT, untreated. ADH and ALDH activities were quantified. C and D, alcohol and aldehyde dehydrogenase activity assays in gastrocnemius muscle from mice treated with chronic or binge ethanol (EF)- or pair-fed (PF) mice (n = 4 each). All myotube experiments were done in three biological replicates. All data are expressed as mean ± S.D. *, p < 0.05; **, p < 0.01; ***, p < 0.001 versus controls.
Activity of both ADH and ALDH enzymes was acutely inhibited in myotubes and returned to basal activity after 3 h in response to ethanol, whereas ammonia exposure increased the activity of ADH.
Discussion
We show that ethanol-induced dysregulated skeletal muscle proteostasis, signaling perturbations, and sarcopenia phenotype are due to ethanol as well as hyperammonemia in a comprehensive array of models, including human muscle, ethanol-treated mice, and myotubes. Both ethanol and ammonia up-regulated transcription and protein expression of the ammonia transporter, RhBG, in the skeletal muscle with increased tissue concentration of ammonia. We also identified that the general transcriptional repressor DR1/NC2 indirectly regulates the promoter activity of RhBG. Ethanol-induced perturbations in ammonia metabolism result in perturbations in the major signaling pathways that regulate muscle protein homeostasis and result in a sarcopenic phenotype.
Our in vitro studies in primary hepatocytes and AML12 murine liver cell lines show that ethanol impaired hepatocyte ammonia disposal due to decreased ureagenesis and are consistent with previous in vivo studies (20–23, 27, 44). We and others have also previously reported that the skeletal muscle functions as a metabolic partner to the liver during impaired ureagenesis by increased muscle uptake of ammonia (28, 29). Lower ureagenesis results in impaired hepatic ammonia disposal, and the resultant hyperammonemia results in increased skeletal muscle ammonia concentrations as observed in this study of skeletal muscle from ethanol-fed mice with consequent ammonia-mediated effects as reported earlier (28–30).
This study provides a mechanistic basis for increased muscle uptake of ammonia in response to ethanol exposure. Expression of the ammonia transporter family member RhBG is transcriptionally up-regulated in the skeletal muscle during ethanol exposure. Expression of another ammonia transporter family member RhCG is, however, not significantly altered in the muscle either with ethanol or hyperammonemia. Of the three transcription factors that were bound to the RhBG promoter during ammonia and ethanol exposure, only DR1/NC2 and FoxP1 were increased in response to ethanol and ammonia unlike PBX1 whose expression was unaltered with these interventions. Depletion of either DR1/NC2 or PBX1 increased the luciferase reporter activity for the RhBG promoter suggesting that both these transcription factors negatively regulated RhBG. However, depleting PBX1 did not alter the response to ethanol or ammonia, whereas DR1/NC2 depletion resulted in a loss of response to ethanol and ammonia showing a regulatory role for DR1/NC2 in ammonia/ethanol–mediated regulation of RhBG. Maintenance of luciferase response to ammonia and ethanol despite depletion of PBX1 or FoxP1 suggested that RhBG regulation was independent of these two transcription factors. Even though DR1/NC2 is a repressor of transcription, our studies on the expression and loss-of-function studies suggest that DR1/NC2 may be an indirect regulator of RhBG by inhibiting an RhBG repressor. This interpretation is supported by our observations on reporters of deletional constructs of the RhBG promoter. Our data on the pulldown proteomics, luciferase reporter assays, and depletion studies are consistent with the known function of DR1/NC2 as a transcriptional repressor. However, the expression of RhBG protein does not show a similar robust response and lack of response to ammonia or ethanol exposure. Whether these depend on regulation via TATA-like rather than the TATA element on the promoter or post-transcriptional or translational responses needs further evaluation as part of future studies.
We also noted that ethanol is metabolized in the skeletal muscle, and inhibition of ethanol or acetaldehyde metabolism showed that blocking ethanol oxidation results in a prolonged increase in RhBG expression, whereas inhibiting acetaldehyde oxidation with cyanamide results in a rapid and early rise in RhBG expression. These data suggest that ethanol and acetaldehyde increase ammonia transporter and transport with different kinetics.
Published data show that ethanol and hyperammonemia cause skeletal muscle loss and decreased myotube diameter (4, 11, 45, 46). Our current observations on signaling perturbation in response to ethanol exposure are consistent with prior reports of ethanol-mediated impairment in skeletal muscle mTORC1 signaling and protein synthesis and increased autophagy in vitro and in vivo in mouse models (4, 47). Our observations that phosphorylation of AMPK, an upstream inhibitor of mTOR phosphorylation and activator of autophagy, by ethanol treatment with or without hyperammonemia was less than that observed with hyperammonemia alone and may be due to dephosphorylation of AMPK in response to ethanol, as has been reported in hepatocytes, but different from that reported in myoblasts (48, 49). These suggest that the effects of ethanol on signaling perturbations may be context-dependent, and therapeutic approaches need to consider these tissue-specific responses. Our signaling data also provide a mechanistic explanation for the clinical observation of more severe muscle loss in patients with alcoholic liver disease with impaired mTORC1 signaling and increased eIF2α-P that is greater in myotubes during hyperammonemia with ethanol treatment. Increasing recognition that eIF2α-P impairs mTORC1 signaling suggests a similar mechanism in myotubes treated with ethanol and ammonia (33). Increased myostatin expression at 6 and 24 h in response to ethanol exposure and hyperammonemia is consistent with our previous reports of hyperammonemia-induced up-regulation of myostatin (29). As mentioned earlier, perturbations in multiple regulatory pathways include adaptive and maladaptive responses that culminate in dysregulated protein homeostasis and a sarcopenic phenotype.
Our data show that dysregulated proteostasis during ethanol exposure is mediated by transcriptional and signaling perturbations at multiple levels. Both ethanol directly and muscle-generated acetaldehyde and possibly systemic acetaldehyde impair protein synthesis and increase autophagy and consequent sarcopenia. Additionally, impaired ammonia disposal due to ethanol-mediated decreased hepatic ureagenesis causes dysregulated proteostasis. Importantly, even after ethanol withdrawal, once liver disease is established the resultant hyperammonemia maintains and worsens dysregulated protein homeostasis. This can explain the persistent muscle loss in human patients in contrast to a reversible phenotype of muscle loss in rodents because hepatic fibrosis and cirrhosis do not occur in these models. Ammonia-lowering therapy reverses muscle loss in preclinical models of hyperammonemia (31), and alcohol abstinence in combination with ammonia-lowering therapy has potential for rapid clinical translation (1, 2, 50).
Experimental procedures
All chemicals, including ethanol, acetaldehyde, 4-methylpyrazole, and cyanamide, were obtained from Sigma. Antibodies were obtained as follows: antipuromycin antibody from Millipore; LC3II and PBX1 from Novus Biologicals (Littleton, CO); β-actin from Santa Cruz Biotechnology(Dallas, TX); total and phosphorylated mTORSer-2448, P70S6 kinaseThr-389, ribosomal S6 proteinSer-240/244, GCN2Thr-899, eIF2αSer-51, AMPKThr-172, PERK, DR1/NC2, FoxP1, and P62 from Cell Signaling Technologies (Beverly, MA). Antibodies to RhBG and RhCG were generated by D. Weiner (author) and have been characterized previously (51, 52). shRNA clones for DR1/NC2, FoxP1, and PBX1 were obtained from Sigma.
In vitro cell cultures: murine myotubes
Murine C2C12 myoblasts (ATCC, Manassas, VA) were grown to confluence in proliferation medium (DMEM with 10% fetal bovine serum) followed by differentiation in DMEM with 2% horse serum for 48 h as described previously (36, 53). Differentiated murine C2C12 myotubes exposed to 100 mm ethanol with or without 10 mm ammonium acetate were used for 6 and 24 h and shown to be biologically and clinically relevant as reported previously (4, 36). For the withdrawal experiments, myotubes were treated with 100 mm ethanol in differentiation medium for 24 h, and then the medium was removed and replaced with fresh conditioned differentiation medium with 10 mm ammonium acetate.
Primary hepatocyte isolation
Hepatocytes from WT mice were isolated using methods previously described (54). Hepatocytes were isolated from livers perfused via the portal vein with modified Hanks' solution (free of Ca2+ and Mg2+) containing 1 mm EGTA and 10 mm HEPES and then with 0.05% type IV collagenase in Williams' E medium at a flow rate of 6 ml/min. A cell suspension was formed by gentle disruption of the collagenase-treated livers in Williams' E medium containing 10% fetal bovine serum. Cells were washed twice with Williams' E medium, and dead/damaged hepatocytes were separated out with a 30% Percoll gradient. Purified cells were suspended in William's E medium supplemented with 10% fetal bovine serum and hepatocyte maintenance pack from Gibco. Cells were counted and plated on collagen-coated 100-mm plates (1.8 × 10⁶ cells per plate).
Culture and treatment of AML12 cells
AML12 mouse hepatocytes were obtained from the ATCC and cultured in a 1:1 mixture of Dulbecco's modified Eagle's medium and Ham's F-12 medium (Sigma) with 1× insulin, transferrin, and selenium (Thermo Fisher Scientific, Waltham, MA), 1× dexamethasone (Cayman Chemical, Ann Arbor, MI), 10% fetal bovine serum, and 1% penicillin/streptomycin. Cells were subcultured at a density of 4 × 10⁶ cells/cm2 in a 10-cm2 plate, and 24 h later, the cells were treated with 100 mm ethanol in serum-free DMEM/F-12 + 1% penicillin/streptomycin for 6 h. Medium was collected at timed intervals to quantify urea concentrations.
In vivo studies in ethanol-fed mice
All procedures using animals were approved by the Cleveland Clinic Institutional Animal Care and Use Committee. 8–10-Week-old female C57BL/6J mice (The Jackson Laboratory, Bar Harbor, ME) were randomized into ethanol-fed and pair-fed groups and then adapted to a control liquid diet for 2 days. Two models of ethanol feeding were used in this study. The first was a chronic ethanol-induced liver injury model, in which mice in the ethanol-fed groups were allowed free access to an ethanol-diet containing 1% (v/v) ethanol for 2 days followed by 2% ethanol for 2 days, then 4% ethanol for 1 week, 5% for 1 week, and finally 6% ethanol for an additional week. The second model was considered a binge model of ethanol exposure. Mice were allowed free access to an ethanol-diet containing 1% for 2 days, followed by 2 days at 6% ethanol. Control mice received a control pair-fed food diet that isocalorically substituted maltose dextrins for ethanol. Animals were housed in the biological resource unit with a 12-h light/day cycle. After euthanasia, gastrocnemius muscle was harvested, and protein was extracted for immunoblots and tissue lysates for enzyme activity.
Placement of miniosmotic pump to induce hyperammonemia
Hyperammonemia was induced in C57BL/6J mice by placing an Alzet miniosmotic pump model 2004 (Alzet, Cupertino, CA). Osmotic pump implant surgery was performed using sterile aseptic techniques. Mice were placed on a heating pad to maintain normal body temperature for the duration of the surgery. Mice were anesthetized by isofluorane anesthesia. The nape of the animal was shaved with clippers, and the skin was cleaned with 70% ethanol. An Alzet® 3-cm/200-μl miniosmotic pump containing either phosphate-buffered saline (PBS) or ammonium acetate was implanted subcutaneously in 8–9-week-old mice on back of neck. A 5–7-mm transverse incision was made, and a small subdermal pocket was created using a straight long-nosed hemostat following local anesthesia using 0.25% bupivacaine. The pump was inserted with the delivery pore located anterior toward the head of the animal and the incision secured using wound clips. A dose of 2.5 mmol/kg/day ammonium acetate in sterile PBS or vehicle alone was delivered to these animals for 4 weeks.
Human muscle tissue
Vastus lateralis muscle from alcoholic cirrhosis and matched healthy controls were obtained after institutional review board approval (IRB 10-840) and in accordance with the Declaration of Helsinki at the Cleveland Clinic. All patients provided an informed consent, in accordance with the Declaration of Helsinki, and the clinical details of these subjects have been previously reported (55).
Myotube diameter measurements
The diameters of at least 100 myotubes from at least three independent experiments each were measured using ImageJ as described earlier (29). The mean ± S.D. were calculated and expressed as a ratio compared with controls.
Real-time PCR
Total RNA was extracted and used for real-time PCR described previously (29). In brief, total RNA from C2C12 myotubes treated with ethanol was isolated using TRI reagent (Molecular Research Center Inc., Cincinnati, OH). cDNA was synthesized using avian leukemia retrovirus reverse transcriptase (Clontech) and real-time PCR (Table S2) performed using the SYBR® fluorescence kit (Qiagen, Hilden, Germany) with Stratagene Mx3000p (Agilent Technologies, Santa Clara, CA). Relative differences were normalized to the expression of β-actin.
Immunoblots
Immunoblots on protein extracts were performed using protocols established in our laboratories as described earlier (33). In brief, electrophoresis of 30 μg of protein was performed on an 8 or 10% Tris glycine gel except for LC3 lipidation, where a 15% gel was used, electrotransferred to polyvinylidene difluoride membrane, blocked with 3% BSA or 5% fat-free milk for 2 h, and incubated with primary antibody overnight at 4 °C followed by secondary antibody for 3 h at room temperature in the appropriate dilutions (Table S2), and blots were developed. Immune reactivity was detected by chemiluminescent horseradish peroxidase substrate (MilliporeSigma, Burlington, MA) followed by densitometry of the blots using ImageJ as described earlier (56).
Protein synthesis in vitro
The puromycin incorporation method was used to quantify protein synthesis in C2C12 myotubes by incubating the cells following treatment with 100 mm ethanol and/or 10 mm ammonium acetate or medium alone, and 1 μg/ml puromycin was added for 30 min. Immunoblots for puromycin incorporation were performed as described earlier (33).
Ureagenesis
To determine the impact of ethanol on hepatic ureagenesis, murine AML12 cells or primary hepatocytes were grown as described above. Upon reaching confluence, cells were treated with 100 mm ethanol or no treatment; medium was aspirated from 0 to 6 h, and urea concentration in the medium was quantified. Urea assay was performed using a modification of the protocol as described previously (57). The working solution consisted of 513 mg/liter primaquine bisphosphate, 100 mg/liter o-phthalaldehyde, 2.5 mol/liter sulfuric acid, 2.5 g/liter boric acid, and 0.03% Brij-35 (Sigma). Urea standards were prepared in serum-free DMEM. 50 μl each of standards or samples were transferred to separate wells in a flat-bottom 96-well plate. 200 μl of freshly prepared working reagent was added, and the plate was gently mixed and then incubated at room temperature for 1 h. Readings were taken at 430 nm on a plate reader (Molecular Devices, Sunnyvale, CA).
Ammonia assays
Ammonia assays were performed as described previously (29). The working reagent consisted of 150 mm α-KG, 2.5 mm NADH, and 1 μg/μl glutamate dehydrogenase enzyme. The ammonia standard was prepared from a 1 mm solution of ammonium chloride. To perform the assay, 60 μl of culture medium was transferred to a UV-invisible flat-bottom 96-well plate. Then, 20 μl of 150 mm α-KG and 20 μl of freshly prepared 2.5 mm NADH were added. The plate was gently mixed, and optical density (OD) was taken at 340 nm. Then 5 μg of glutamate dehydrogenase enzyme was added to each well. The plates were kept for incubation at 37 °C for 1 h in the plate reader machine. During the incubation, OD was taken at every 15 min at 340 nm on the plate reader (Molecular Devices, Sunnyvale, CA). During calculation, the initial OD was subtracted for the final OD.
Enzyme activity assays
Alcohol and aldehyde dehydrogenase assays were performed using an assay kit per the manufacturer's protocol (Biomedical Research Service Center, University of Buffalo, Buffalo, NY). In brief, myotubes or muscle tissue was lysed using ice-cold 1× lysis solution provided with the kit. Cell lysates was extracted by pipetting up and down. The cell lysate was gently and intermittently agitated on ice for 5 min followed by centrifugation for 10 min at 12,000 rpm at 4 °C. The supernatant was used for ADH and ALDH assays. For tissue extraction, ∼50 mg of pair-fed and ethanol-fed mice gastrocnemius muscle tissue was taken and homogenized in 500 μl of ice-cold 1× cell lysis solution provided with the kit. The homogenates were centrifuged for 10 min at 12,000 rpm at 4 °C, and supernatant was harvested. Protein concentration (1 mg/ml) of each sample was equalized by performing protein estimation assay (BCA). Then, 10 μl of each sample in duplicate was transferred to a separate well of a flat-bottom 96-well plate (one set for control and another set for reaction). Then, 50 μl of control solution (1 part of H2O and 10 parts of ADH/ALDH assay solution) was added to one set of wells, and 50 μl of reaction solution (1 part of 10× ALD/ALDH substrate and 10 parts of ADH/ALDH assay solution) was added to another set of wells. The plate was gently mixed, covered, and kept for incubation for 1 h at 37 °C. The reaction was stopped by adding 50 μl of 3% acetic acid. OD was taken at 492 nm on the plate reader (Molecular Devices, Sunnyvale, CA). The OD of the control well was subtracted from the OD of the reaction well for each sample. The subtracted sample OD reading was used to calculate enzyme activity. Sample ADH/ALDH activity in IU/liter unit = μmol/(liter··min) = OD × 1000 × 110 μl/(60 min × 0.6 cm × 18 × 10 μl).
Reporter assay
To determine whether ethanol resulted in transcriptional up-regulation of RhBG, the previously described full-length and various deletion constructs of RhBG used to generate luciferase reporters and Renilla constructs (40) were transfected in myoblasts using protocols described by us (29; cells were selected using neomycin and grown in differentiation medium for 48 h. Myotubes were treated with 100 mm ethanol with or without ammonium acetate for 24 h.
Biotin-tagged promoter pulldown assay to detect transcription factor binding
RhBG full-length promoter (−2349 to 142) was amplified using 5′ biotin–tagged forward primer and reverse primer. Biotin-tagged RhBG promoter was gel-purified using QIAquick gel extraction kit (Qiagen). Then, C2C12 cell lysate was made in the lysis/binding buffer (25 mm Tris, pH 7.5, 150 mm NaCl, 0.3% Triton X-100, 1× protease inhibitor mixture). The streptavidin magnetic beads (50 μl) were pre-washed with binding buffer three times, and then 300 ng of biotin-tagged RhBG promoter was added to bind with streptavidin. The beads were again washed two times to remove unbound RhBG promoter. The binding reaction was performed by adding 100 μg of C2C12 crude lysate to the biotin–RhBG–streptavidin complex and kept at 4 °C for 4 h at rotation. The beads were washed three times with the binding buffer, and then interacting proteins were eluted by using 100 μl of elution buffer (0.1 m glycine, pH 2.0). The eluted proteins were subjected to LC-MS/MS to identify proteins that interact with the RhBG promoter. Protein samples were prepared for MS by removing an aliquot of protein and reconstituting in 50 μl of 6 m urea, 100 mm Tris buffer. The proteins were reduced with 10 mm DTT for 15 min at room temperature and alkylated with 30 mm iodoacetamide for 20 min at room temperature. The samples were diluted to reduce the urea concentration to <1.2 m. Two rounds of tryptic digestion were performed by the addition of 1 μg of trypsin and incubated at room temperature overnight followed by the addition of a second trypsin aliquot and digestion for an additional 4 h. The peptide samples were desalted with PepClean C-18 spin columns (Thermo Fisher Scientific) and reconstituted in 30 μl of 1% acetic acid for LC-MS analysis.
The LC-MS system was a fusion lumos hybrid MS system (Thermo Fisher Scientific, San Jose, CA). The HPLC column was a Dionex 15 cm × 75 μm internal diameter Acclaim Pepmap C18, 2 μm, 100 Å reversed-phase capillary chromatography column (Thermo Fisher Scientific, Waltham, MA). Five-μl volumes of the extract were injected, and the peptides eluted from the column by an acetonitrile, 0.1% formic acid gradient at a flow rate of 0.3 μl/min were introduced into the source of the mass spectrometer online. The microelectrospray ion source is operated at 1.9 kV. The acquisition method was a data-dependent–based MS2 method. It begins with a MS full scan in the Orbitrap analyzer (60,000 resolution), followed by selection of the parent ions in the MS scans and fragmentation by high-energy collision–induced dissociation, and was detected in the Orbitrap analyzer.
The data were analyzed using MaxQuant Version 1.5.2.8 with the search engine Andromeda that is integrated in MaxQuant software, and the parameters used were default settings for an Orbitrap (58, 59). The database used to search the MS/MS spectra was the Uniprot mouse protein database (https://www.uniprot.org/proteomes/UP000000589)5 containing 25,035 entries with an automatically-generated decoy database (reversed sequences). Oxidation of methionine and acetylation of the protein N terminus were set as dynamic modifications, and carbamidomethylation of cysteine was set as static modifications. A false discovery rate was set to 1% for both peptide and protein with a minimum length of seven amino acids, and two unique or razor peptides were required for positive identification.
The “match between runs” feature of MaxQuant was used to transfer identifications to other LC-MS/MS runs based on their masses and retention time (maximum deviation 0.7 min), and this was also used in quantification experiments. Quantifications were performed with the label-free quantitation method available in the MaxQuant program (60).
After mass spectrometric analyses (peptide/protein identification, LFQ intensity calculations, and normalization), we selected all known transcription factors and removed all proteins that were bound to beads in the no DNA control as background. The search motif tool in the eukaryotic promoter database (EPD) scans promoter regions with position weight matrices (PWM) of several transcription factors (TF) and core promoter elements to find putative binding sites. Once a PWM library and TF were selected, the identified promoter region was searched with that PWM. Hits were marked as black rectangles in the plot, and exact positions relative to the TSS (Fig. 4C). Motif libraries are from the JASPAR® database, and the EPD elements and were downloaded as a text file (61). The description of the motifs and the conversion rules are shown in Fig. 4C. The scan of the motifs was performed on-the-fly using the FindM tool from the Signal Search Analysis server toolkit (https://ccg.epfl.ch/ssa/findm.php). We then only considered transcription factors that were detected after ethanol or ammonia treatment and were undetected in untreated samples. This resulted in 17 total transcription factors of interest. Using these data, we created a Venn diagram of transcription factors bound in different conditions using the VennDiagram package in R.
Statistical analysis
Experimental data for all conditions are expressed as mean ± S.E. unless specified, and the number of animals used is provided in the figure legends. Quantitative variables were analyzed using the Student's t test for protocols with two groups. For all studies in which the experimental protocol involved more than two groups, data were analyzed using a one-way analysis of variance. When analysis of variance showed a significant overall effect, differences among different groups were assessed using the Bonferroni post hoc analysis. Qualitative variables were analyzed using the χ2 test. p < 0.05 was considered significant. All analyses were done using SPSS Version 20 (IBM, Armonk, NY).
Author contributions
S. K., G. D., and S. D. conceptualization; S. K., G. D., K. A. A., N. W., C. H., A. Kumar, M. G., A. Kim, B. W., and S. D. data curation; S. K., G. D., D. S. L., and S. D. validation; S. K., G. D., C. H., M. R. M., V. V., and S. D. investigation; S. K., G. D., N. W., A. Kumar, M. G., M. R. M., B. W., D. S. L., L. E. N., A. M. M., I. D. W., and S. D. methodology; S. K. and S. D. writing-original draft; S. K., G. D., K. A. A., N. W., C. H., A. Kumar, M. G., A. Kim, M. R. M., B. W., D. S. L., L. E. N., V. V., A. M. M., I. D. W., and S. D. writing-review and editing; A. Kim software; B. W. formal analysis; A. M. M., I. D. W., and S. D. resources; S. D. supervision; S. D. funding acquisition; S. D. project administration.
Supplementary Material
Acknowledgment
Technical assistance and support were provided by Lakshmi Veera.
This work was supported in part by National Institutes of Health Grants R21 AA022742 (to S. D.), R21 AR071046 (to S. D. and G. D.), UO1 AA026976 (to S. D.), RO1 GM119174, RO1 DK113196 (to S. D.), P50 AA024333 (to L. E. N. and S. D.), UO1 AA021890 (to L. E. N. and S. D.), RO1 DK045788 (to I. D. W.), RO1 DK107798 (to I. D. W.), UO1 AA021724 (to V. V.), and R24 AA022057 (to V. V.) and a Mikati Foundation grant (to S. D. and G. D.). The authors declare that they have no conflicts of interest with the contents of this article. The content is solely the responsibility of the authors and does not necessarily represent the official views of the National Institutes of Health.
This article contains Figs. S1–S3 and Tables S1 and S2.
Please note that the JBC is not responsible for the long-term archiving and maintenance of this site or any other third party hosted site.
- ADH
- alcohol dehydrogenase
- ALDH
- aldehyde dehydrogenase
- AMPK
- adenosine monophosphate–activated protein kinase
- eIF
- eukaryotic initiation factor
- GCN
- general control nonderepressible
- mTORC1
- mammalian target of rapamycin complex 1
- mTOR
- mammalian target of rapamycin
- PERK
- protein kinase R–like endoplasmic reticulum kinase
- DMEM
- Dulbecco's modified Eagle's medium
- EPD
- eukaryotic promoter database
- TF
- transcription factor
- TSS
- transcription start site
- PWM
- position weight matrix
- α-KG
- α-ketoglutarate
- eIF2α-P
- phosphorylated eukaryotic initiation factor 2α.
References
- 1. Dasarathy J., McCullough A. J., and Dasarathy S. (2017) Sarcopenia in alcoholic liver disease: clinical and molecular advances. Alcohol. Clin. Exp. Res. 41, 1419–1431 10.1111/acer.13425 [DOI] [PMC free article] [PubMed] [Google Scholar]
- 2. Dasarathy S. (2016) Nutrition and alcoholic liver disease: effects of alcoholism on nutrition, effects of nutrition on alcoholic liver disease, and nutritional therapies for alcoholic liver disease. Clin. Liver Dis. 20, 535–550 10.1016/j.cld.2016.02.010 [DOI] [PMC free article] [PubMed] [Google Scholar]
- 3. Guirguis J., Chhatwal J., Dasarathy J., Rivas J., McMichael D., Nagy L. E., McCullough A. J., and Dasarathy S. (2015) Clinical impact of alcohol-related cirrhosis in the next decade: estimates based on current epidemiological trends in the United States. Alcohol. Clin. Exp. Res. 39, 2085–2094 10.1111/acer.12887 [DOI] [PMC free article] [PubMed] [Google Scholar]
- 4. Thapaliya S., Runkana A., McMullen M. R., Nagy L. E., McDonald C., Naga Prasad S. V., and Dasarathy S. (2014) Alcohol-induced autophagy contributes to loss in skeletal muscle mass. Autophagy 10, 677–690 10.4161/auto.27918 [DOI] [PMC free article] [PubMed] [Google Scholar]
- 5. Fernandez-Solà J., Preedy V. R., Lang C. H., Gonzalez-Reimers E., Arno M., Lin J. C., Wiseman H., Zhou S., Emery P. W., Nakahara T., Hashimoto K., Hirano M., Santolaria-Fernandez F., Gonzalez-Hernandez T., Fatjo F., et al. (2007) Molecular and cellular events in alcohol-induced muscle disease. Alcohol. Clin. Exp. Res. 31, 1953–1962 10.1111/j.1530-0277.2007.00530.x [DOI] [PubMed] [Google Scholar]
- 6. Nakahara T., Hunter R., Hirano M., Uchimura H., McArdle A., Broome C. S., Koll M., Martin C. R., and Preedy V. R. (2006) Alcohol alters skeletal muscle heat shock protein gene expression in rats: these effects are moderated by sex, raised endogenous acetaldehyde, and starvation. Metabolism 55, 843–851 10.1016/j.metabol.2006.02.009 [DOI] [PubMed] [Google Scholar]
- 7. Preedy V. R., Edwards P., and Peters T. J. (1991) Ethanol-induced reductions in skeletal muscle protein synthesis: use of the inhibitors of alcohol and aldehyde dehydrogenase. Biochem. Soc. Trans. 19, 167S 10.1042/bst019167s [DOI] [PubMed] [Google Scholar]
- 8. Pacy P. J., Preedy V. R., Peters T. J., Read M., and Halliday D. (1991) The effect of chronic alcohol ingestion on whole body and muscle protein synthesis–a stable isotope study. Alcohol Alcohol. 26, 505–513 10.1093/oxfordjournals.alcalc.a045152 [DOI] [PubMed] [Google Scholar]
- 9. Steiner J. L., Kimball S. R., and Lang C. H. (2016) Acute alcohol-induced decrease in muscle protein synthesis in female mice is REDD-1 and mTOR-independent. Alcohol Alcohol. 51, 242–250 10.1093/alcalc/agv105 [DOI] [PMC free article] [PubMed] [Google Scholar]
- 10. Steiner J. L., and Lang C. H. (2015) Dysregulation of skeletal muscle protein metabolism by alcohol. Am. J. Physiol. Endocrinol. Metab. 308, E699–E712 10.1152/ajpendo.00006.2015 [DOI] [PMC free article] [PubMed] [Google Scholar]
- 11. Hong-Brown L. Q., Frost R. A., and Lang C. H. (2001) Alcohol impairs protein synthesis and degradation in cultured skeletal muscle cells. Alcohol. Clin. Exp. Res. 25, 1373–1382 10.1111/j.1530-0277.2001.tb02361.x [DOI] [PubMed] [Google Scholar]
- 12. Lang C. H., Kimball S. R., Frost R. A., and Vary T. C. (2001) Alcohol myopathy: impairment of protein synthesis and translation initiation. Int. J. Biochem. Cell Biol. 33, 457–473 10.1016/S1357-2725(00)00081-9 [DOI] [PubMed] [Google Scholar]
- 13. Lang C. H., Frost R. A., Kumar V., Wu D., and Vary T. C. (2000) Impaired protein synthesis induced by acute alcohol intoxication is associated with changes in eIF4E in muscle and eIF2B in liver. Alcohol. Clin. Exp. Res. 24, 322–331 10.1111/j.1530-0277.2000.tb04614.x [DOI] [PubMed] [Google Scholar]
- 14. Lang C. H., Wu D., Frost R. A., Jefferson L. S., Kimball S. R., and Vary T. C. (1999) Inhibition of muscle protein synthesis by alcohol is associated with modulation of eIF2B and eIF4E. Am. J. Physiol. 277, E268–E276 [DOI] [PubMed] [Google Scholar]
- 15. Lang C. H., Pruznak A. M., Deshpande N., Palopoli M. M., Frost R. A., and Vary T. C. (2004) Alcohol intoxication impairs phosphorylation of S6K1 and S6 in skeletal muscle independently of ethanol metabolism. Alcohol. Clin. Exp. Res. 28, 1758–1767 10.1097/01.ALC.0000145787.66405.59 [DOI] [PubMed] [Google Scholar]
- 16. Marway J. S., and Preedy V. R. (1995) The acute effects of ethanol and acetaldehyde on the synthesis of mixed and contractile proteins of the jejunum. Alcohol Alcohol. 30, 211–217 [PubMed] [Google Scholar]
- 17. Preedy V. R., Keating J. W., and Peters T. J. (1992) The acute effects of ethanol and acetaldehyde on rates of protein synthesis in type I and type II fibre-rich skeletal muscles of the rat. Alcohol Alcohol. 27, 241–251 [PubMed] [Google Scholar]
- 18. Cederbaum A. I. (2012) Alcohol metabolism. Clin. Liver Dis. 16, 667–685 10.1016/j.cld.2012.08.002 [DOI] [PMC free article] [PubMed] [Google Scholar]
- 19. Lang C. H., Frost R. A., Summer A. D., and Vary T. C. (2005) Molecular mechanisms responsible for alcohol-induced myopathy in skeletal muscle and heart. Int. J. Biochem. Cell Biol. 37, 2180–2195 10.1016/j.biocel.2005.04.013 [DOI] [PubMed] [Google Scholar]
- 20. Aagaard N. K., Thøgersen T., Grøfte T., Greisen J., and Vilstrup H. (2004) Alcohol acutely down-regulates urea synthesis in normal men. Alcohol. Clin. Exp. Res. 28, 697–701 10.1097/01.ALC.0000125355.31808.DC [DOI] [PubMed] [Google Scholar]
- 21. Glavind E., Aagaard N. K., Gronbaek H., Orntoft N. W., Vilstrup H., and Thomsen K. L. (2018) Time course of compromised urea synthesis in patients with alcoholic hepatitis. Scand. J. Gastroenterol. 53, 592–597 [DOI] [PubMed] [Google Scholar]
- 22. Schricker T., Albuszies G., Weidenbach H., Beckh K. H., Ensinger H., Geisser W., Adler G., and Georgieff M. (1997) Liver urea and glucose production in patients with alcohol-induced cirrhosis. Dtsch. Med. Wochenschr. 122, 75–79 [DOI] [PubMed] [Google Scholar]
- 23. Maier K. P., Volk B., Hoppe-Seyler G., and Gerok W. (1974) Urea-cycle enzymes in normal liver and in patients with alcoholic hepatitis. Eur. J. Clin. Invest. 4, 193–195 10.1111/j.1365-2362.1974.tb00391.x [DOI] [PubMed] [Google Scholar]
- 24. Olde Damink S. W., Jalan R., and Dejong C. H. (2009) Interorgan ammonia trafficking in liver disease. Metab. Brain Dis. 24, 169–181 10.1007/s11011-008-9122-5 [DOI] [PubMed] [Google Scholar]
- 25. Rypins E. B., Henderson J. M., Fulenwider J. T., Moffitt S., Galambos J. T., Warren W. D., and Rudman D. (1980) A tracer method for measuring rate of urea synthesis in normal and cirrhotic subjects. Gastroenterology 78, 1419–1424 [PubMed] [Google Scholar]
- 26. Rudman D., DiFulco T. J., Galambos J. T., Smith R. B. 3rd, Salam A. A., and Warren W. D. (1973) Maximal rates of excretion and synthesis of urea in normal and cirrhotic subjects. J. Clin. Invest. 52, 2241–2249 10.1172/JCI107410 [DOI] [PMC free article] [PubMed] [Google Scholar]
- 27. Holmuhamedov E. L., Czerny C., Beeson C. C., and Lemasters J. J. (2012) Ethanol suppresses ureagenesis in rat hepatocytes: role of acetaldehyde. J. Biol. Chem. 287, 7692–7700 10.1074/jbc.M111.293399 [DOI] [PMC free article] [PubMed] [Google Scholar]
- 28. Dasarathy S., and Hatzoglou M. (2018) Hyperammonemia and proteostasis in cirrhosis. Curr. Opin. Clin. Nutr. Metab. Care 21, 30–36 10.1097/MCO.0000000000000426 [DOI] [PMC free article] [PubMed] [Google Scholar]
- 29. Qiu J., Thapaliya S., Runkana A., Yang Y., Tsien C., Mohan M. L., Narayanan A., Eghtesad B., Mozdziak P. E., McDonald C., Stark G. R., Welle S., Naga Prasad S. V., and Dasarathy S. (2013) Hyperammonemia in cirrhosis induces transcriptional regulation of myostatin by an NF-κB-mediated mechanism. Proc. Natl. Acad. Sci. U.S.A. 110, 18162–18167 10.1073/pnas.1317049110 [DOI] [PMC free article] [PubMed] [Google Scholar]
- 30. Lockwood A. H., McDonald J. M., Reiman R. E., Gelbard A. S., Laughlin J. S., Duffy T. E., and Plum F. (1979) The dynamics of ammonia metabolism in man. Effects of liver disease and hyperammonemia. J. Clin. Invest. 63, 449–460 10.1172/JCI109322 [DOI] [PMC free article] [PubMed] [Google Scholar]
- 31. Kumar A., Davuluri G., Silva R. N. E., Engelen M. P. K. J., Ten Have G. A. M., Prayson R., Deutz N. E. P., and Dasarathy S. (2017) Ammonia lowering reverses sarcopenia of cirrhosis by restoring skeletal muscle proteostasis. Hepatology 65, 2045–2058 10.1002/hep.29107 [DOI] [PMC free article] [PubMed] [Google Scholar]
- 32. Dasarathy S., Mookerjee R. P., Rackayova V., Rangroo Thrane V., Vairappan B., Ott P., and Rose C. F. (2017) Ammonia toxicity: from head to toe? Metab. Brain Dis. 32, 529–538 10.1007/s11011-016-9938-3 [DOI] [PMC free article] [PubMed] [Google Scholar]
- 33. Davuluri G., Krokowski D., Guan B. J., Kumar A., Thapaliya S., Singh D., Hatzoglou M., and Dasarathy S. (2016) Metabolic adaptation of skeletal muscle to hyperammonemia drives the beneficial effects of l-leucine in cirrhosis. J. Hepatol. 65, 929–937 10.1016/j.jhep.2016.06.004 [DOI] [PMC free article] [PubMed] [Google Scholar]
- 34. McDaniel J., Davuluri G., Hill E. A., Moyer M., Runkana A., Prayson R., van Lunteren E., and Dasarathy S. (2016) Hyperammonemia results in reduced muscle function independent of muscle mass. Am. J. Physiol. Gastrointest. Liver Physiol. 310, G163–G170 10.1152/ajpgi.00322.2015 [DOI] [PMC free article] [PubMed] [Google Scholar]
- 35. Stern R. A., Ashwell C. M., Dasarathy S., and Mozdziak P. E. (2015) The effect of hyperammonemia on myostatin and myogenic regulatory factor gene expression in broiler embryos. Animal 9, 992–999 10.1017/S1751731115000117 [DOI] [PMC free article] [PubMed] [Google Scholar]
- 36. Qiu J., Tsien C., Thapalaya S., Narayanan A., Weihl C. C., Ching J. K., Eghtesad B., Singh K., Fu X., Dubyak G., McDonald C., Almasan A., Hazen S. L., Naga Prasad S. V., and Dasarathy S. (2012) Hyperammonemia-mediated autophagy in skeletal muscle contributes to sarcopenia of cirrhosis. Am. J. Physiol. Endocrinol. Metab. 303, E983–E993 10.1152/ajpendo.00183.2012 [DOI] [PMC free article] [PubMed] [Google Scholar]
- 37. Takeda K., and Takemasa T. (2015) Expression of ammonia transporters Rhbg and Rhcg in mouse skeletal muscle and the effect of 6-week training on these proteins. Physiol. Rep. 3, e12596 10.14814/phy2.12596 [DOI] [PMC free article] [PubMed] [Google Scholar]
- 38. Weiner I. D., and Verlander J. W. (2003) Renal and hepatic expression of the ammonium transporter proteins, Rh B Glycoprotein and Rh C glycoprotein. Acta Physiol. Scand. 179, 331–338 10.1046/j.0001-6772.2003.01210.x [DOI] [PubMed] [Google Scholar]
- 39. Hershey J. W., Sonenberg N., and Mathews M. B. (2012) Principles of translational control: an overview. Cold Spring Harb. Perspect. Biol. 4, a011528 [DOI] [PMC free article] [PubMed] [Google Scholar]
- 40. Merhi A., De Mees C., Abdo R., Victoria Alberola J., and Marini A. M. (2015) Wnt/β-catenin signaling regulates the expression of the ammonium permease gene RHBG in human cancer cells. PLoS ONE 10, e0128683 10.1371/journal.pone.0128683 [DOI] [PMC free article] [PubMed] [Google Scholar]
- 41. Inostroza J. A., Mermelstein F. H., Ha I., Lane W. S., and Reinberg D. (1992) Dr1, a TATA-binding protein-associated phosphoprotein and inhibitor of class II gene transcription. Cell 70, 477–489 10.1016/0092-8674(92)90172-9 [DOI] [PubMed] [Google Scholar]
- 42. Yeung K. C., Inostroza J. A., Mermelstein F. H., Kannabiran C., and Reinberg D. (1994) Structure-function analysis of the TBP-binding protein Dr1 reveals a mechanism for repression of class II gene transcription. Genes Dev. 8, 2097–2109 10.1101/gad.8.17.2097 [DOI] [PubMed] [Google Scholar]
- 43. Xue Y., Pradhan S. K., Sun F., Chronis C., Tran N., Su T., Van C., Vashisht A., Wohlschlegel J., Peterson C. L., Timmers H. T. M., Kurdistani S. K., and Carey M. F. (2017) Mot1, Ino80C, and NC2 function coordinately to regulate pervasive transcription in yeast and mammals. Mol. Cell 67, 594–607.e4 10.1016/j.molcel.2017.06.029 [DOI] [PMC free article] [PubMed] [Google Scholar]
- 44. Maier K. P., Talke H., Heimsoeth H., and Gerok W. (1978) Influence of steroids on urea-cycle enzymes in chronic human liver disease. Klin. Wochenschr. 56, 291–295 10.1007/BF01489175 [DOI] [PubMed] [Google Scholar]
- 45. Molina P. E., Lang C. H., McNurlan M., Bagby G. J., and Nelson S. (2008) Chronic alcohol accentuates simian acquired immunodeficiency syndrome-associated wasting. Alcohol. Clin. Exp. Res. 32, 138–147 [DOI] [PMC free article] [PubMed] [Google Scholar]
- 46. Reilly M. E., Preedy V. R., and Peters T. J. (1995) Investigations into the toxic effects of alcohol on skeletal muscle. Adverse Drug React. Toxicol. Rev. 14, 117–150 [PubMed] [Google Scholar]
- 47. Steiner J. L., and Lang C. H. (2014) Alcohol impairs skeletal muscle protein synthesis and mTOR signaling in a time-dependent manner following electrically stimulated muscle contraction. J. Appl. Physiol. 117, 1170–1179 10.1152/japplphysiol.00180.2014 [DOI] [PMC free article] [PubMed] [Google Scholar]
- 48. Hong-Brown L. Q., Brown C. R., Huber D. S., and Lang C. H. (2007) Alcohol regulates eukaryotic elongation factor 2 phosphorylation via an AMP-activated protein kinase-dependent mechanism in C2C12 skeletal myocytes. J. Biol. Chem. 282, 3702–3712 [DOI] [PubMed] [Google Scholar]
- 49. Liangpunsakul S., Sozio M. S., Shin E., Zhao Z., Xu Y., Ross R. A., Zeng Y., and Crabb D. W. (2010) Inhibitory effect of ethanol on AMPK phosphorylation is mediated in part through elevated ceramide levels. Am. J. Physiol. Gastrointest. Liver Physiol. 298, G1004–G1012 10.1152/ajpgi.00482.2009 [DOI] [PMC free article] [PubMed] [Google Scholar]
- 50. Dasarathy S., and Merli M. (2016) Sarcopenia from mechanism to diagnosis and treatment in liver disease. J. Hepatol. 65, 1232–1244 10.1016/j.jhep.2016.07.040 [DOI] [PMC free article] [PubMed] [Google Scholar]
- 51. Verlander J. W., Miller R. T., Frank A. E., Royaux I. E., Kim Y. H., and Weiner I. D. (2003) Localization of the ammonium transporter proteins RhBG and RhCG in mouse kidney. Am. J. Physiol. Renal Physiol. 284, F323–F337 10.1152/ajprenal.00050.2002 [DOI] [PubMed] [Google Scholar]
- 52. Mak D. O., Dang B., Weiner I. D., Foskett J. K., and Westhoff C. M. (2006) Characterization of ammonia transport by the kidney Rh glycoproteins RhBG and RhCG. Am. J. Physiol. Renal Physiol. 290, F297–F305 10.1152/ajprenal.00147.2005 [DOI] [PMC free article] [PubMed] [Google Scholar]
- 53. Davuluri G., Allawy A., Thapaliya S., Rennison J. H., Singh D., Kumar A., Sandlers Y., Van Wagoner D. R., Flask C. A., Hoppel C., Kasumov T., and Dasarathy S. (2016) Hyperammonaemia-induced skeletal muscle mitochondrial dysfunction results in cataplerosis and oxidative stress. J. Physiol. 594, 7341–7360 10.1113/JP272796 [DOI] [PMC free article] [PubMed] [Google Scholar]
- 54. Bakhautdin B., Das D., Mandal P., Roychowdhury S., Danner J., Bush K., Pollard K., Kaspar J. W., Li W., Salomon R. G., McMullen M. R., and Nagy L. E. (2014) Protective role of HO-1 and carbon monoxide in ethanol-induced hepatocyte cell death and liver injury in mice. J. Hepatol. 61, 1029–1037 10.1016/j.jhep.2014.06.007 [DOI] [PMC free article] [PubMed] [Google Scholar]
- 55. Tsien C., Davuluri G., Singh D., Allawy A., Ten Have G. A., Thapaliya S., Schulze J. M., Barnes D., McCullough A. J., Engelen M. P., Deutz N. E., and Dasarathy S. (2015) Metabolic and molecular responses to leucine-enriched branched chain amino acid supplementation in the skeletal muscle of alcoholic cirrhosis. Hepatology 61, 2018–2029 10.1002/hep.27717 [DOI] [PMC free article] [PubMed] [Google Scholar]
- 56. Schneider C. A., Rasband W. S., and Eliceiri K. W. (2012) NIH Image to ImageJ: 25 years of image analysis. Nat. Methods 9, 671–675 10.1038/nmeth.2089 [DOI] [PMC free article] [PubMed] [Google Scholar]
- 57. Zawada R. J., Kwan P., Olszewski K. L., Llinas M., and Huang S. G. (2009) Quantitative determination of urea concentrations in cell culture medium. Biochem. Cell Biol. 87, 541–544 10.1139/O09-011 [DOI] [PMC free article] [PubMed] [Google Scholar]
- 58. Tyanova S., Temu T., and Cox J. (2016) The MaxQuant computational platform for mass spectrometry-based shotgun proteomics. Nat. Protoc. 11, 2301–2319 10.1038/nprot.2016.136 [DOI] [PubMed] [Google Scholar]
- 59. Cox J., and Mann M. (2008) MaxQuant enables high peptide identification rates, individualized p.p.b.–range mass accuracies and proteome-wide protein quantification. Nat. Biotechnol. 26, 1367–1372 10.1038/nbt.1511 [DOI] [PubMed] [Google Scholar]
- 60. Cox J., Hein M. Y., Luber C. A., Paron I., Nagaraj N., and Mann M. (2014) Accurate proteome-wide label-free quantification by delayed normalization and maximal peptide ratio extraction, termed MaxLFQ. Mol. Cell. Proteomics 13, 2513–2526 10.1074/mcp.M113.031591 [DOI] [PMC free article] [PubMed] [Google Scholar]
- 61. Dreos R., Ambrosini G., Cavin Périer R., and Bucher P. (2013) EPD and EPDnew, high-quality promoter resources in the next-generation sequencing era. Nucleic Acids Res. 41, D157–D164 10.1093/nar/gks1233 [DOI] [PMC free article] [PubMed] [Google Scholar]
Associated Data
This section collects any data citations, data availability statements, or supplementary materials included in this article.