

Summary
Mammalian selenocysteine (Sec) containing proteins, selenoproteins, are important to (patho)physiological processes, including redox homeostasis. Sec residues have been recalcitrant to mass spectrometry (MS)-based chemoproteomic methods that enrich for reactive cysteine (Cys) residues with electrophilic chemical probes, despite confirmed reactivity of Sec with these electrophiles. Highly abundant Cys peptides likely suppress low-abundant Sec peptides. By exploiting the decreased pKa of Sec relative to Cys, we have developed a chemoproteomic platform that relies on low pH (pH 5.75) electrophile labeling, reducing Cys reactivity and enhancing identification of Sec-containing peptides across mouse tissues and cell lines. The utility of this Sec-profiling platform is underscored by evaluation of the selectivity of Auranofin, an inhibitor of the selenoprotein, thioredoxin reductase, against both reactive Cys and Sec-containing proteins. Platform limitations pertain to the non-physiological low-pH conditions that could perturb protein structure and function. Future work necessitates the discovery of selenocysteine-selective electrophiles that function at physiological pH.
GRAPHICAL ABSTRACT
eTOC Blurb
Bak et al. describe a chemoproteomic method for the global enrichment and identification of selenocysteine (Sec) residues. Low pH iodoacetamide-alkyne labeling masks Cys reactivity, allowing for tissue specific selenoprotein identification. This platform shows promise for interrogating the specificity of Sec inhibitors, such as auranofin.
Introduction
The micronutrient selenium is required for the production of a small subset of mammalian proteins requiring the incorporation of the amino acid selenocysteine (Sec; U) (Kryukov et al., 2003; Labunskyy et al., 2014; Lu and Holmgren, 2009). Sec nominally performs the same biochemical function as the standard amino acid cysteine (Cys), with selenium in place of sulfur within the nucleophilic thiol (Figure 1A). Sec is co-translationally incorporated into the growing polypeptide chain by ribosomal insertion at an internal UGA (stop) codon (Figure 1B). This incorporation is achieved by recognition of a cis-acting mRNA stem loop structure, SECIS, by trans-acting protein factors, Sephs2 and eEFSec, which direct the ribosome to utilize the UGA complementary tRNA, Sec-tRNA[Ser]Sec (Donovan and Copeland, 2010; Labunskyy et al., 2014). Sec-tRNA[Ser]Sec is generated from Sec-tRNA[Ser] via an O-phosphoseryl-tRNA[Ser]Sec intermediate (Labunskyy et al., 2014; Xu et al., 2006) (Figure 1C). There is currently no consensus as to why selenoproteins require Sec residues in place of the less energetically costly Cys. While Sec is more nucleophilic and thus more reactive than Cys (Arnér, 2010), a number of organisms survive with reduced or completely absent selenoproteomes (Lobanov et al., 2008). Additionally, Cys-containing orthologues exist for almost all selenoprotein families (Lobanov et al., 2007), suggesting that Sec reactivity alone is not the sole reason for Sec incorporation. One currently proposed model is that Sec is more resistant than Cys to irreversible oxidation (Ingold et al., 2018; Marques et al., 2017; Snider et al., 2013), and this resistance to oxidative damage may be more essential to organisms in higher oxygen environments (Hondal and Ruggles, 2011; Zhang et al., 2006).
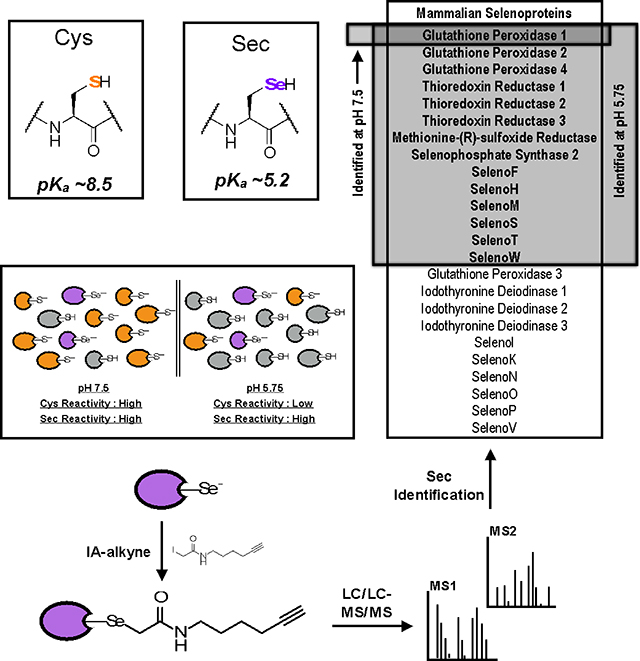
Figure 1. Mechanism of Sec incorporation, the mammalian selenoproteins and pH-dependent reactivity of Sec and Cys.

(A) Chemical structures and side-chain pKa values of Cys and Sec. (B) Sec-incorporation into proteins via a Sec-specific tRNA (Sec-tRNA[Ser]Sec) that recognizes an internal UGA (stop) codon within the gene. UGA-codon recognition is facilitated by trans-acting proteins, eEFSec (Sec-specific translation elongation factor) and SBP2 (SECIS-binding protein 2), which recognize and bind to a cis-acting SECIS (Sec insertion sequence) 3’UTR hairpin element. (C) The generation of Sec-charged tRNASec is accomplished in multiple steps; 1) SerS (Seryl-tRNA synthase) initially aminoacylates tRNA[Ser]Sec with serine to generate seryl-tRNA[Ser]Sec, 2) serine is phosphorylated by PSTK (phosphoseryl-tRNA[Ser]Sec kinase) to generate phosphoseryl-tRNA[Ser]Sec, and 3) selenophosphate, generated by Sephs2 (selenophosphate synthase 2), is incorporated into the amino acid backbone by SecS (Sec Synthase) to form Sec-tRNA[Ser]Sec. (D) The complete 25-member mammalian selenoproteome (24 proteins in mice) categorized by homology and function. (E) Due to differences in Cys and Sec pKa values, low-pH conditions result in protonation and loss in reactivity of the majority of Cys residues, whilst maintaining Sec deprotonation and reactivity. IA-alkyne labeling at low pH will therefore enrich for Sec-containing proteins.
Bioinformatic approaches, relying on identification of conserved SECIS elements, internal UGA codons, and homology to Cys-containing orthologues have enabled the comprehensive identification of selenoproteomes in many organisms (Mariotti et al., 2013). The human selenoproteome has 25 members, whilst 24 selenoproteins exist in the mouse proteome (hGpx6 contains Sec and mGpx6 contains Cys). Of these selenoproteins, only half have defined functions (Figure 1D); thioredoxin reductases (Txnrd1, Txnrd2, and Txnrd3), glutathione peroxidases (Gpx1, Gpx2, Gpx3, and Gpx4), iodothyronine deiodinases (Dio1, Dio2, and Dio3), methione-R-sulfoxide reductase B1 (MsrB1) and selenophosphate synthase 2 (Sephs2) (Kryukov et al., 2003; Labunskyy et al., 2014; Lobanov et al., 2009). Many of the remaining functionally unannotated selenoproteins contain a canonical redox-active CxxU motif or variant thereof (Selenoproteins F, H, M, N, O, T, V, and W), suggesting antioxidant activities, with likely relevance to maintenance of cellular redox homeostasis. Importantly, many selenoproteins have been implicated in a number of disease states, including heart disease (Handy and Loscalzo, 2016), inflammation (Kaushal et al., 2011), male infertility (Turanov et al., 2011), and cancer (Davis et al., 2012; Hatfield et al., 2014). Of interest, the expression levels of several selenoproteins have been shown to be dysregulated during cancer progression; for example, SelenoF (Apostolou et al., 2004; Kumaraswamy et al., 2000) and SelenoP (Al-Taie et al., 2009; Calvo et al., 2002) have reduced expression levels in cancerous versus normal tissue, while Txnrd1 (Cadenas et al., 2010; Fernandes et al., 2009) and SelenoH (Novoselov et al., 2007) display increased expression. In the case of Txnrd1, increased expression is thought to enable malignant cells to protect against oxidative damage (Yoo et al., 2010).
Given the limited biochemical and functional information available for many of these proteins, and their potential as novel therapeutic targets for cancer and other diseases, proteomic methods that enable the global interrogation of the selenoproteome can provide critical information on Sec function, redox sensitivity and inhibitor susceptibility. Significant progress has been made over the past ten years in exploring Cys reactivities, redox susceptibilities, and sensitivities to small-molecule inhibition within the context of a whole proteome using a chemoproteomic technique termed isoTOP-ABPP (Backus et al., 2016; Bak et al., 2017; Martell et al., 2016; Weerapana et al., 2010; Whitby et al., 2017; Zhou et al., 2016). isoTOP-ABPP relies on the ability of a Cys-reactive small-molecule electrophilic probe (iodoacetamide(IA)-alkyne) to covalently modify and enrich reactive Cys residues. Sec can also be covalently modified by IA-alkyne (Huber and Criddle, 1967), yet Sec-containing peptides are not robustly identified in typical isoTOP-ABPP workflows (Whitby et al., 2017). Poor enrichment and detection of Sec-containing peptides is likely due to the small percentage of Sec-containing proteins in the mammalian proteome (only 25 in humans and 24 in mouse) (Figure 1D), in contrast to the greater than 100,000 unique cysteine residues with higher abundance (Giron et al., 2010). To overcome the low abundance of selenoproteins, detection is typically achieved by metabolic incorporation of radiolabeled 75Se, followed by gel autoradiography (Kühbacher et al., 2009). However, autoradiography platforms provide no information on the reactivity, oxidation status and inhibition state of Sec residues, and provides minimal information on selenoproteins of equal molecular weight that are unresolved by gel electrophoresis. In contrast, MS-detection platforms coupled with chemical probes that directly interrogate Sec reactivity have the potential to provide detailed information not just pertaining to selenoprotein abundance, but Sec reactivity, redox sensitivity and inhibitor susceptibility. The use of Sec-specific electrophilic probes (with minimal Cys reactivity at physiological pH) would be ideal, though to date none are available. Recently, reports of dinitrophenyl ethers and sulfonamides have shown promising selectivity (Li et al., 2017; Zhang et al., 2015), but have yet to be adapted for Sec enrichment from complex proteomes.
Here, a Sec-enrichment platform for global interrogation of Sec reactivity was developed. Employing low-pH IA-alkyne labeling, a marked improvement in Sec identification in both mouse tissue homogenates and the mouse macrophage cell line, RAW264.7, was observed. Importantly, the reactivity of Sec residues can be compared across the selenoproteome, and also contrasted to highly reactive Cys residues within the proteome. Lastly, this platform was utilized to look at the specificity of a known Txnrd inhibitor, auranofin, which resulted in decreased IA-labeling of a number of other Sec and Cys residues, suggesting surprisingly greater promiscuity than expected. This Sec-reactivity profiling platform can be applied to interrogate the physiological redox state of selenoproteins, as well as for identification of more potent and specific selenoprotein inhibitors with therapeutic value.
Results
A chemoproteomic platform to enhance Sec-containing peptide detection by MS
While Sec is homologous to Cys in terms of electronegativity, ionic radius, and oxidation state, significant differences in the pKa and nucleophilicity of the selenol (-SeH) versus thiol (-SH) functionalities can be exploited to preferentially enrich selenocysteine residues (Arnér, 2010). Specifically, the pKa of Sec (~5.2) is significantly lower than Cys (~8.5) (Arnér, 2010; Huber and Criddle, 1967) (Figure 1A), resulting in a larger fraction of deprotonated and nucleophilic Sec residues relative to Cys populations at pH ~5. Additionally, Sec has been shown to be reactive with IA at pH ~2, where Sec would be expected to be fully protonated, suggesting that Sec has the ability to react with IA even when in the protonated selenol state (Huber and Criddle, 1967). These well-characterized reactivity differences between selenols and thiols at low pH were exploited to improve Sec enrichment and detection in a typical isoTOP-ABPP workflow. Decreased pH during the IA-alkyne labeling step would minimize the covalent modification of abundant Cys residues, whilst maintaining high reactivity with Sec residues, thereby decreasing Cys background and enhancing the desired Sec signals (Figure 1E). It should be noted that in addition to protonation of the reactive Cys residue, there are a number of other possible explanations for reduced Cys reactivity at low pH, including destabilization of the protein fold, protonation of nearby amino acid residues, or pH-dependent changes in ligand binding. Additionally, it is well established that the local environment surrounding Cys residues within specific enzyme active sites can suppress Cys pKa values close to, if not lower than that of Sec (Dyson et al., 1997; Kanzok et al., 2001). For example, the catalytic cysteine in human glutaredoxin has been reported to have a pKa value of ~3.5 (Jao et al., 2006). Therefore, it is expected that there will be residual Cys-labeling under low-pH conditions allowing for comparison of Sec reactivity to a subset of Cys residues that retain nucleophilicity at low pH.
Iodoacetamide-alkyne labeling at low pH increases Sec-peptide detection by MS
Initially, we set out to benchmark the ability of the standard isoTOP-ABPP workflow to detect Sec-containing peptides. Soluble mouse-liver homogenates were treated with IA-alkyne (100 μM) at pH 7.5 in phosphate buffered saline (PBS). Upon incorporation of a diazo biotin-azide linker using copper-catalyzed azide-alkyne cycloaddition (CuAAC), Cys and Sec-containing peptides were enriched on streptavidin beads, subjected to on-bead trypsin digestion and selectively eluted from the beads for LC/LC-MS/MS identification. The resulting fragmentation data were analyzed for Sec-containing peptides with the expected IA-probe modification (Figure S1A). Out of the 24 mouse selenoproteins present in the protein database, only Gpx1 and Txnrd2 were identified (Tables 1 and S1). To improve selenopeptide identification, a list of potential selenopeptide m/z values were incorporated into the MS method for preferential fragmentation of Sec-containing peptides. The use of the mass list greatly increased the spectral counts obtained for Gpx1, but did not significantly increase the robustness of identification of other Sec-containing peptides (Tables 1 and S1). Gpx1 is known to be ubiquitously expressed at high levels relative to other selenoproteins, which likely explains its robust detection in the typical isoTOP-ABPP analysis.
Table 1.
Sec residues identified by LC/LC-MS/MS by labeling mouse liver homogenates with 100 μM IA-alkyne at pH 7.5 and pH 5.75.
| Protein | Protein Name | Peptide | Spectral Counts | |||
|---|---|---|---|---|---|---|
| pH 7.5 | pH 5.75 | |||||
| − Mass List | + Mass List | − Mass List | + Mass List | |||
| Gpx1 | Glutathione Peroxidase 1 | K.VLLIENVASLUGTTIR.D (K.VLLIENVASLUGTTIRDYTEMNDLQK.R) | 22 | 123 | 44 | 2317 |
| Gpx4 | Glutathione Peroxidase 4 | R.GFVCITNVASQUGK.T | - | - | 1 | 16 |
| Txnrd1 | Thioredoxin Reductase 1 | R.SGGDILQSGCUG (K.RSGGDILQSGCUG) | - | 3 | 3 | 7 |
| Txnrd2 | Thioredoxin Reductase 2 | R.SGLEPTVTGCUG (K.RSGLEPTVTGCUG) | 1 | - | 1 | 5 |
| MsrB1 | Methione-R-Sulfoxide Reductase B1 | R.FUIFSSSLK.F | - | - | 1 | 29 |
| Sephs2 | Selenophosphate Synthetase 2 | K.GUGCKVPQETLLK.L | - | - | 4 | 23 |
| SelenoW | Selenoprotein W | R.VVYCGAUGYKPK.Y | - | - | - | 10 |
The isoTOP-ABPP workflow was then implemented with IA-alkyne labeling of soluble mouse-liver homogenates in pH 5.75 MES buffer (Buffer SE) (Figure 2A). To demonstrate that the low pH buffer was not detrimental to selenoprotein structure and function, the activity of Txnrd in Buffer SE was examined. Rat-liver Txnrd displayed measurable activity in Buffer SE, indicating that gross structural changes were not occurring under these conditions (Figure S1B). Buffer SE was also confirmed to be compatible with the CuAAC-mediated conjugation step to the diazo biotin-azide linker. The resulting peptides from the low-pH isoTOP-ABPP experiment afforded identification of six Sec-containing peptides (Gpx1, Gpx4, Txnrd1, Txnrd2, MsrB1, and Sephs2) (Tables 1 and S1). The use of the Sec-peptide mass list identified a seventh Sec-containing peptide from SelenoW and more importantly increased the reliability of the data by providing multiple fragmentation spectra (spectral counts >> 1) (Tables 1 and S1) for each of the seven Sec-containing peptides. Therefore, low-pH IA-alkyne labeling, coupled with the use of a Sec-peptide mass list to direct fragmentation, enables the robust identification of Sec-containing peptides from a complex proteome.
Figure 2. Identification of Sec peptides by low-pH isoTOP-ABPP.

(A) Workflow for low-pH isoTOP-ABPP where IA-alkyne labeling is performed at pH 5.75, followed by CuAAC-mediated incorporation of a diazo biotin-azide linker, streptavidin enrichment, on-bead trypsin digestion and elution of IA-labeled peptides for MS analysis. (B) IA-labeled Sec residues identified by low-pH isoTOP-ABPP (red dots) across five mouse tissues and a mouse macrophage cell line (RAW264.7). Sec-peptide identification by isoTOP-ABPP correlated well with known gene expression data (blue shading). (C) The theoretical and experimental MS1 isotopic envelope and representative annotated MS2 spectra for the Gpx1 Sec peptide. MS1/MS2 spectra for all identified Sec peptides are presented in Table S2. (D) Quantification of the total number of Sec peptides (purple bars) and Sec peptide spectral counts (gray bars) identified from cultured RAW264.7 cells upon selenium supplementation of the cell-culture media at varying concentrations. (E) Extracted light and heavy ion chromatographs demonstrating the varying dependence in Sec reactivity of selenoproteins in response to selenium limitation. L:H ratios are shown for each Sec residue and represent the change in reactivity (a presumed measure of selenoprotein abundance) when IA-alkyne labeling was performed in lysates from cells grown in media supplemented with 50 nM selenium (light) or 0 nM selenium (heavy) or as a control 50 nM selenium (light and heavy). L:H ratio ~ 1 indicates no change in Sec reactivity (or no increase in selenoprotein expression), while L:H ratios > 1 indicate a significant increase in Sec reactivity upon selenium supplementation (or an increase in selenoprotein expression).
Sec-containing peptides were identified from a panel of tissue and cell-line proteomes
Many selenoproteins display tissue-specific expression, so a number of mouse tissues (liver, kidney, large intestine, brain, and testes) were examined to obtain more comprehensive coverage of the selenoproteome. In addition to mouse tissues, a mouse macrophage cell line, RAW264.7, was evaluated to obtain a cell-culture system for Sec profiling that would allow for modulation of culture conditions and inhibitor treatments. The low-pH (pH 5.75) isoTOP-ABPP workflow described previously was applied to soluble (2 replicates) and membrane (1 replicate) homogenates from each tissue. MS analysis identified distinct Sec-containing peptides in each of the soluble tissue homogenates (Figure 2B; Table S1). The tissue in which each Sec-containing peptide was identified showed strong correlation with the selenoprotein gene-expression data obtained from BioGPS (Su et al., 2002; Wu et al., 2016) (Figure 2B; Table S1). Tissue-specific Sec-peptide identifications were observed for Gpx2, a gastrointestine-specific Gpx, Txnrd3, a Txnrd with testes-specific expression, and SelenoM, a selenoprotein predominantly expressed in brain tissue. The correlation of Sec-peptide identifications with tissue-expression profiles supports the hypothesis that selenoprotein identification is mostly limited by low protein-expression levels, and that low-pH isoTOP-ABPP can enhance Sec-peptide detection in those tissues where expression levels exceed a certain abundance threshold.
In total, low-pH isoTOP-ABPP was capable of identifying 12 of the 14 annotated soluble mouse selenoproteins (Sec peptides from SelenoO and SelenoV were not identified). While low-pH isoTOP-ABPP analysis of membrane homogenates from all mouse tissues was unsuccessful at identifying Sec peptides from any of the known membrane-associated selenoproteins, two membrane selenoproteins (SelenoS and SelenoT) were identified in unfractionated RAW264.7 lysates. SelenoS and SelenoT are both integral membrane proteins of the endoplasmic reticulum, with widespread tissue distribution (Table S1). The poor identification of these two selenoproteins in mouse tissues may be the result of the lower protein abundance of these membrane-associated family members relative to their soluble counterparts, or poor recovery of these proteins from membrane pellets during the fractionation step. However, given the success of our platform at identifying the vast majority of the soluble, as well as two membrane-associated selenoproteins, we have set the stage to initiate preliminary studies into Sec reactivity, redox regulation and inhibitor sensitivity.
Sec-containing peptides display unique isotope patterns that allow for differentiation and confirmation of selenium inclusion
Elemental selenium exists in six stable or nearly-stable isotopic forms (74Se, 76Se, 77Se, 78Se, 80Se, and 82Se) ranging from 0.9% to 50% abundance. In contrast, sulfur exists as four stable isotopes, but 32S dominates by accounting for 95% of the natural abundance of sulfur, with the other isotopes contributing minimally. The unique isotope distribution of selenium generates distinctive isotopic envelopes for selenium-containing peptides in the mass spectrometer. This characteristic isotopic envelope acts as a natural fingerprinting tool for confirming the presence of Sec within each identified peptide. To incorporate this secondary verification for Sec peptides into our MS data analysis workflow, experimentally obtained isotopic envelopes for each identified Sec peptide were verified against theoretical isotopic envelopes predicted using the elemental composition of each peptide (Figure 2C; Table S2). The clear correlation between experimental and theoretical isotopic distributions for every Sec peptide supports the potential of mining for the unique Sec-isotope pattern to identify low-abundance Sec peptides. Lastly, to further attain confidence in our MS peptide assignments, since many Sec residues are part of a redox active Cys-Sec pair, manual analysis of the MS2 fragmentation spectra was undertaken to confirmed that IA-alkyne labeling was taking place uniquely on the Sec residue (Figure 2C; Table S2).
Low-pH isoTOP-ABPP can report on changes in selenoprotein abundance in response to cellular selenium levels.
For RAW264.7 cell culture, supplementation of the growth media with selenium (50 nM) was necessary to achieve optimal expression of selenoproteins for identification with low-pH isoTOP-ABPP (Figures 2B and 2D; Table S1). It has been reported that for cell-culture conditions that utilize the common commercial media formulations, selenium supplementation is required to obtain optimal Txnrd and Gpx activity (Karlenius et al., 2011). In agreement with this previous report, we observed that the total number of Sec peptides as well as the average number of spectral counts for these peptides increased with increasing selenium supplementation of the cell culture media up to 50 nM additional selenium. The addition of 100 nM selenium resulted in no significant improvement in selenopeptide identification. It is therefore necessary to benchmark the level of selenium supplementation required for a given media and cell line in order to achieve optimal selenoprotein expression.
It is well established that certain selenoproteins display selenium-dependent expression (Gpx1/4, MsrB1, and SelenoM), while other selenoproteins are relatively insensitive to the cellular concentration of selenium (Txrnd1/2) (Legrain et al., 2014; Sunde and Raines, 2011). To utilize low-pH isoTOP-ABPP to interrogate this selenium dependence, changes in the MS intensity of Sec peptides from RAW264.7 cells cultured in either 0 nM or 50 nM selenium were monitored. RAW264.7 cell lysates were labeled with either light (50 nM Se) or heavy (0 nM Se) IA-alkyne (Abo et al., 2018), followed by conjugation to a cleavable diazo biotin-azide for subsequent high-resolution LC-LC/MS-MS analysis (Figure S1C). For all identified Sec-containing peptides, representative extracted light and heavy peptide signals and isotopic envelopes were generated by adapting the cimage quantification software (Weerapana et al., 2010) for the presence of selenium. Co-eluting extracted light and heavy ion chromatograms and selenium isotopic envelopes confirm accurate identification and ratio quantification of selenopeptides (Figure 2E; Tables S1, S3, and S4). Quantification of the relative intensities of the light and heavy extracted ion chromatograms for a given peptide provides a ratio (R) of IA-labeling between the 50 nM and 0 nM Se supplemented cells, where a light:heavy ratio value (R) ~ 1 indicates no change in IA-labeling (suggesting no selenium-dependent protein expression), while an R > 1 indicates increased IA-labeling (suggesting an increase in protein expression upon supplementation with additional selenium). Txnrd1, one of the least selenium-dependent selenoproteins, had a corresponding low ratio of 1.61, while moderately selenium-dependent Gpx4 and SelenoS had ratios of 2.75 and 3.41, respectively. MsrB1, SelenoM, and SelenoW all had R values >5, suggesting strong selenium-dependent expression, consistent with previous reports (Figure 2E; Table S1, S3, and S4) (Legrain et al., 2014; Sunde and Raines, 2011). In contrast to these Sec-containing peptides, Cys-containing peptides displayed no significant selenium-dependent increase in IA-labeling (Figure S1D; Table S3), suggesting that the cellular response to increased selenium levels is remarkably specific to selenoproteins. To confirm that the R values reflect true changes in IA-labeling upon selenium supplementation, control samples where 50 nM selenium supplemented RAW264.7 cell lysates were labeled with light and heavy IA-alkyne was analyzed. All identified Sec-containing peptides had R values ~ 1 (Figure 2E and S1E; Tables S1, S3, and S4).
Sec residues demonstrate high reactivity relative to the majority of cysteine residues in the proteome.
The isoTOP-ABPP platform has been applied to rank Cys residues by reactivity in order to identify a subset of hyperreactive Cys residues within the proteome. Cys reactivity can be measured by comparing Cys labeling in proteomes treated with either 10 μM or 100 μM of the IA-alkyne probe. IA-alkyne labeled proteomes are conjugated to either light (100 μM IA-alkyne) or heavy (10 μM IA-alkyne) cleavable biotin-azide tags for subsequent high-resolution LC-LC/MS-MS analysis (Figure 3A). Hyperreactive cysteines saturate labeling at low concentrations, thereby displaying light:heavy ratio values (R) of <3, whereas less-reactive cysteines show increased labeling with higher probe concentrations yielding high R values. Here, this concentration-dependent analysis was performed on mouse-liver homogenates, using low-pH isoTOP-ABPP to rank Sec residues by reactivity. R values were also calculated for cysteine residues that reacted strongly with IA-alkyne at low pH, which presumably constitute those cysteine residues that maintain high nucleophilicity under low pH conditions. All of the identified Sec residues (seven in total) were quantified with R values below 5, indicating high reactivity. Sec residues on Sephs2, Txnrd1, Gpx1 and Gpx4 demonstrated highest reactivity, with the Sec residue in Txnrd2 showing the lowest reactivity of the seven identified selenoproteins. Importantly, the identified Sec residues were found to be in the most reactive quartile of quantified Cys residues at that same pH (Figure 3B; Table S1 and S5), supporting the premise that Sec residues have higher inherent reactivity relative to Cys residues. For all identified Sec-containing peptides, representative extracted light and heavy peptide signals and isotopic envelopes were generated, where co-eluting extracted light and heavy ion chromatograms and selenium isotopic envelopes confirm accurate identification and ratio quantification of selenopeptides (Figure 3C; Table S6). To confirm that the R values reflect true changes in Sec enrichment at varying IA-alkyne concentrations, a control sample with light and heavy samples treated with equal IA-alkyne (100 μM) was analyzed. Data from this control sample displayed R values of ~1 for all identified selenopeptides (Figure S2).
Figure 3. Reactivity profiling of (seleno)cysteine residues by low-pH isoTOP-ABPP.

(A) Workflow for reactivity profiling of (seleno)cysteine residues at low pH. The low-pH proteome is labeled with either 100 μM or 10 μM IA-alkyne and appended to either an isotopically light or heavy diazo biotin-azide tag, respectively. The light and heavy samples analyzed with the general isoTOP-ABPP workflow. Reactivity is determined as the ratio of light to heavy (R) peptide intensities by LC/LC-MS/MS. (B) The low-pH reactivity of Sec (purple open circles) and Cys (gray closed circles) residues. Inset shows the top ~250 most reactive Sec and Cys residues. (C) Representative light and heavy MS1 chromatographs and isotopic envelopes for the seven identified Sec peptides. (D) The reactivity of the 26 hyperreactive Cys residues (R<3 at pH 7.5) at neutral pH (orange circles) and low pH (gray circles). (E) A comparison of the reactivity of 4 selenocysteine residues at neutral pH (purple circles) and low pH (gray circles). (F) Box plot comparing the global loss in Cys reactivity at low pH versus the minimal reactivity change of Sec residues. Significance is calculated as *** < 0.005, paired Student’s t-test (two-tailed), with n = 26 for cysteine and n = 4 for selenocysteine.
Further analysis of the subset of Cys residues identified with low-pH isoTOP-ABPP generated some intriguing insight into Cys and Sec reactivity. Cys residues that were hyperreactive (R<3) at pH 7.5 appeared to show a general loss in reactivity (higher R values) in the low-pH dataset, confirming the expected loss in Cys reactivity with decreased pH (Figure 3D). Overall, of the 26 hyper-reactive Cysteine residues (R<3) identified at pH 7.5 and pH 5.75, only four cysteine residues remained hyper-reactive at low pH with little or no change in their L:H ratio; Acat2, Acetyl-CoA acetyltransferase (RpH 7.5 = 1.34 / RpH 5.75 = 1.17), Aldh1l1, Cytosolic 10-formyltetrahydrofolate dehydrogenase (RpH 7.5 = 1.12 / RpH 5.75 = 1.30), Tkt, Transketolase (RpH 7.5 = 2.57 / RpH 5.75 = 2.06), and Glod4, Glyoxalase domain-containing protein 4 (RpH 7.5 = 2.58 / RpH 5.75 = 2.86) (Table S5). Additionally, of the over 300 cysteine residues that were not hyper-reactive (R>3) at pH 7.5, only four became hyper-reactive at reduced pH (albeit with only a very modest decrease in L:H ratio); Mat1a, S-adenosylmethionine synthase isoform type-1 (RpH 7.5 = 4.07 / RpH 5.75 = 2.59), Echs1, Enoyl-CoA hydratase (RpH 7.5 = 4.55 / RpH 5.75 = 2.72), Gstz1, Maleylacetoacetate isomerase (RpH 7.5 = 3.40 / RpH 5.75 = 2.94), and Hmgcs2, Hydroxymethylglutaryl-CoA synthase (RpH 7.5 = 4.39 / RpH 5.75 = 2.99) (Table S5). In contrast to the general decreased reactivity of Cys residues, the four Sec residues identified at both pH conditions showed minimal changes in R value, signifying that Sec residues maintain equivalent reactivity at pH 5.75 and pH 7.5 (Figure 3E). A box plot of these changes in reactivity demonstrates the significant decrease in reactivity observed for Cys residues, in contrast to the relatively constant reactivity observed for Sec residues at the different pH values (Figure 3F).
Auranofin targets several cysteine and selenocysteine residues within the proteome.
The low-pH isoTOP-ABPP platform can be utilized to screen selenoprotein-targeted inhibitors for selectivity against both the selenoproteome and reactive cysteinome, using a competitive analysis, whereby loss of IA labeling in the presence of inhibitor is indicative of inhibitor binding. The well-characterized Txnrd inhibitor, auranofin (Figure 4A), was used for these inhibitor-profiling studies. Txnrd is an antioxidant selenoprotein that utilizes NADPH to reduce and activate thioredoxin (Txn) (Figure 4B). Txn is responsible for the regulation of many important cellular proteins, including the tumor suppressor p53 (Turunen et al., 2004; Ueno et al., 1999), rendering the Txnrd/Txn system a validated therapeutic target for cancer (Urig and Becker, 2006). Additionally, both Txnrd and Txn are upregulated in a large number of cancer cell lines, and Txnrd expression is strongly correlated with tumor progression (Mohler et al., 2002). A broad range of compounds are known to have an inhibitory effect on Txnrd activity, mostly through covalent modification or metal chelation to the Sec residue (Bindoli et al., 2009; Urig and Becker, 2006). The commercially available Txnrd inhibitor, auranofin, is currently marketed as a treatment for rheumatoid arthritis, but has also been shown to induce apoptosis in cisplatin-resistant ovarian cancer cells (Marzano et al., 2007). Auranofin treatment increases ROS levels, triggers mitochondrial dysregulation, and apoptosis, presumably due to Txnrd inhibition (Rigobello et al., 2009). Here, the specificity of auranofin for chelating to the Sec residue of Txnrd versus other Sec and Cys proteins was examined by monitoring changes in Sec reactivity (loss of IA labeling) induced by auranofin treatment.
Figure 4. Screening the TrxR inhibitor, auranofin against the (seleno)cysteinome.

(A) Chemical structure of the Txnrd inhibitor, auranofin. (B) The Txnrd/Txn antioxidant cycle, which utilizes NADPH as an electron acceptor. (C) Workflow for using low-pH isoTOP-ABPP to screen the selectivity of Auranofin. SILAC light and heavy RAW264.7 lysates are treated with vehicle or auranofin at pH 7.5 then buffer exchanged to pH 5.75 for low-pH IA-alkyne labeling, followed by the standard isoTOP-ABPP workflow. (D) Correlation Plot of the L:H ratios (R) for Cys (gray closed circles) and Sec (open purple circles) residues at two different auranofin concentrations (1 μM and 100 μM). Proteins with high auranofin sensitivity are located in the upper right quadrant. The corrected L:H ratio = 1 is shown as dashed gray lines. (E) Correlation Plot of the L:H ratios (R) for Cys (gray closed circles) and Sec (open purple circles) residues upon treatment of either lysates or live cells with 100 μM auranofin. Proteins with decreased IA labeling in both cell lysate and live-cell auranofin treatments are located in the upper-right quadrant. (F) Sec and Cys residues that demonstrate decreased IA-labeling in both cell lysate and live-cell auranofin treatments.
First, the sensitivity of Sec and Cys residues to auranofin binding was examined in RAW264.7 cell lysates, where changes in protein abundance will not complicate analysis. Additionally, due to significant dilution of NADH levels in cell lysates, there is minimal catalytic turnover of Txnrd, and therefore inhibition by auranofin is unlikely to perturb the redox state of proteins downstream of Txnrd. However, the loss of cellular compartmentalization in these lysate studies could generate artifactual hits, which are proteins accessible to auranofin in lysates, but inaccessible under cellular conditions due to the intracellular distribution of auranofin. RAW264.7 cells were isotopically labeled using standard stable isotope labeling with amino acids in cell culture (SILAC) protocols to provide light and heavy cell lysates that were then treated with either DMSO (light) or 1 μM or 100 μM Auranofin (heavy) at pH 7.5 (Figure 4C). The pH of these samples was reduced to pH 5.75 for IA-alkyne labeling. To confirm that auranofin remains bound to Txnrd at low pH, in vitro activity assays in Buffer SE demonstrated inhibition of Txnrd by auranofin at low pH (Figure S1B). The resulting probe-labeled peptides were analyzed by MS using the standard protocol for isoTOP-ABPP. Light:heavy ratio (R) values were calculated for each Sec-containing peptide, whereby a ratio value significantly higher than the median ratio indicates significant loss of IA labeling and therefore sensitivity to auranofin treatment. Interestingly, the Sec residue in Txnrd1, although above the median, was not the most sensitive Sec residue to auranofin treatment (Figure 4D, S3A, and S3B; Table S7). Notably, two other Sec residues, SelenoM and SelenoH, showed much stronger auranofin sensitivity, while most of the other identified Sec residues, from Gpx4, MsrB1, SelenoW, and SelenoF, had similar R values to Txnrd1. In addition to screening the auranofin sensitivity of Sec residues, we also assessed the sensitivity of Cys residues labeled by IA-alkyne at low pH. Interrogation of the low-pH Cys-labeling events identified Cys residues from Txn1, Txn2, and Txndc5 as highly sensitive to auranofin treatment.
Next, we examined auranofin-regulated Sec and Cys residues upon live-cell inhibitor treatment. Under these conditions, decreases in IA-labeling are reflective of direct inhibitor binding, decreased protein abundance, or increased downstream Sec/Cys oxidation resulting from auranofin treatment. RAW264.7 cells lysates were generated in pH 5.75 buffer from cells that were treated with either 100 μM auranofin or vehicle, and labeled with isotopically light (vehicle) or heavy (auranofin) IA-alkyne. The resulting probe-labeled peptides were analyzed by MS using the standard protocol for isoTOP-ABPP (Figure S3C). Four Sec residues (Txnrd1, Gpx4, MsrB1, and SelenoS) were identified with L:H ratios significantly above the median, indicating loss of IA labeling upon live-cell auranofin treatment (Figure S3D; Table S7). For Txnrd1 and Gpx4, both proteins had alternative Cys residues with L:H ratios that approximated the median ratio, suggesting that the increased L:H ratio for the corresponding Sec residues is not due to a change in protein abundance upon auranofin treatment (Figure S3E and S3F). The data does not allow us to eliminate the possibility that Sec and Cys residues with high L:H ratios are resulting from downstream redox signaling events.
Direct intracellular targets of auranofin are likely those Sec and Cys residues that demonstrate decreased IA labeling upon auranofin treatment in both cell lysates, and live cells (Figure 4E and 4F, Table S7). Many Sec and Cys residues which showed sensitivity to auranofin under lysate treatment, failed to show auranofin-dependent regulation upon live-cell treatment. It is likely that these targets are inaccessible to auranofin under physiological conditions, possibly due to differences in subcellular localization of the inhibitor and target. Interestingly, a number of targets displayed higher ratios in live-cell relative to lysate treatment, including Txndc5, Clic1, Iqgap1, Ctsb, and Gpx4, indicating an increase in auranofin engagement under physiological conditions. One such target is the Sec residue of Gpx4, a mitochondrial selenoprotein with a two-fold increase in L:H ratio under live-cell auranofin treatment conditions. In contrast, Txnrd1 has the same L:H ratio in both lysate and live-cell experiments. This preference might be explained by the reported propensity of auranofin to concentrate in the mitochondria (Barnard and Berners-Price, 2007; Berners-Price and Filipovska, 2008). Interestingly, targets from other subcellular localizations are also engaged, including Txndc5 in the ER and Ctsb in the lysosome. Specifically, Ctsb has been reported to be inhibited by auranofin and other Au(I) compounds in previous studies (Gunatilleke et al., 2008; Kast, 2010), but the exact residue targeted by the inhibitor have never been confirmed. Here, we show that a putative site of labeling may be Cys319.
The Sec and Cys residues most sensitive to auranofin in lysate experiments (Figure 4D) show significant enrichment of residues annotated to be redox-active disulfides. Many of these proteins, such as Txn1/2, Txnrd1, SelenoM, SelenoH, Txndc5 contain classical CxxC and CxxU motifs, which are hallmarks of thioredoxin-like domains. Additionally, many of the likely physiological targets of auranofin (Figure 4F) are known or potential redox-active disulfide residues; including cysteines in Clic1, responsible for its dimerization and transport function; Txndc5, a member of the protein disulfide isomerase (PDI) family responsible for proper disulfide bond formation during protein folding; and Tpi1 (triose phosphate isomerase), in which two adjacent cysteine residues (71 and 78) both display high L:H ratios, whereas three additional cysteine residues (116, 177, and 268) appear unresponsive to auranofin treatment (Figure S3G).
Discussion
The selenoproteome represents only ~25 proteins in mammals, but annotated members of this family play important roles in development, antioxidant defense, nucleotide synthesis, and hormone signaling. Notably, over half of the selenoproteins in humans remain completely unannotated. The study of selenoproteins has always presented a challenge due to the requirement of unique protein expression systems in order to correctly incorporate the Sec residue. Similarly, proteomic studies of Sec-containing peptides has lagged behind advances in global cysteine profiling. Here we present a chemoproteomic method to enrich and identify Sec-containing peptides. Sec enrichment is achieved using low-pH IA-alkyne labeling, which significantly masks the reactivity of the majority of abundant Cys residues, whilst maintaining Sec labeling for MS-based identification. The utility of this low-pH isoTOP-ABPP platform was confirmed by the following findings; 1) the identification of a significant fraction (12 out of 14) of the soluble, as well as 2 of the membrane mammalian selenoproteins, confirming the universality of this platform for Sec identification; 2) the correlation of MS-based Sec-peptide identification and tissue expression levels, suggesting that low abundance is a key limiting factor for Sec peptide identification, and 3) reactivity profiling of both Cys and Sec residues at low and high pH, demonstrating the global loss of Cys hyperreactivity at decreased pH with minimal effects on Sec reactivity.
When low-pH isoTOP-ABPP was utilized for screening protein targets of auranofin, a number of auranofin-sensitive proteins were observed, implying that auranofin is not selective for Txnrd. By assessing the sensitivity of Sec and Cys residues to auranofin in lysates, as well as the regulation of Sec and Cys reactivity in live cells upon auranofin treatment, a list of likely direct intracellular auranofin targets was generated. While Txnrd1 was identified as a target, a number of other Sec and Cys residues displayed stronger engagement with auranofin, including residues on Tpi1, Gpx4, Clic1, Ctsb, Iqgap1, and Txndc5. It is important to note however, that changes in cysteine reactivity observed during live-cell auranofin treatment could be due to changes in protein abundance or downstream redox changes induced by Txnrd inhibition.
Future studies will focus on developing improved data-analysis methods for Sec-peptide identification, including isotope-pattern matching algorithms to identify low-abundant peptide species not amenable to fragmentation. Additionally, analysis of other tissues and cell lines, as well as modifications to cell lysis and tissue homogenization protocols, could serve to facilitate identification of other membrane and secreted selenoproteins that are currently not accessible to low-pH isoTOP-ABPP. We also envision that this platform could provide important information on how cells regulate selenium by: 1) providing insight into the prioritization of selenium incorporation into selenoproteins; 2) misincorporation of selenocysteine residues in place of cysteine; and, 3) incorporation of cysteine into selenoproteins under selenium-deficient conditions.
Importantly, one major limitation of this platform is the need for low-pH conditions for IA-labeling, which could affect protein structure, inhibitor/ligand binding, and oxidative modifications. However, we envision that the ability of this platform to monitor both Cys and Sec reactivity will enable the screening of a variety of electrophiles to identify Sec-selective electrophiles that function at physiological pH. Such an electrophile is critical for more physiologically relevant applications for global Sec reactivity, redox-sensitivity and inhibitor profiling.
SIGNIFICANCE
Selenoproteins are a small group of Sec-containing proteins, of which only ~50% are functionally annotated. The annotated selenoproteins play important roles in cellular redox balance and antioxidant signaling, and as such their misregulation is associated with a number of disease states, including cancer. Given the theraupeutic potential of these selenoproteins, chemoproteomic methods are required to better interrogate the reactivity, posttranslational modification state, and inhibitor sensitivity of this subset of the proteome. However, despite significant progress in the area of Cys-reactivity profiling through the development of isoTOP-ABPP and related platforms, similar strategies have failed to significantly enrich and identify Sec residues. Due to the lack of available Sec-selective chemical probes, we established a chemoproteomic platform that relies on the enhanced reactivity of Sec relative to Cys at low pH. Low-pH isoTOP-ABPP analysis resulted in decreased labeling of abundant Cys residues, whilst maintaining Sec reactivity, to afford robust identification of Sec peptides from complex biological samples. Importantly, low-pH isoTOP-ABPP enabled the comparison of Sec reactivity across the proteome, demonstrating a hierarchy in Sec reactivity at the high end of the reactivity spectrum relative to Cys residues. Furthermore, given the therapeutic interest in selenoproteins such as Txnrd, we demonstrate the utility of our low-pH isoTOP-ABPP platform to assess selectivity of a known Txnrd inhibitor, auranofin. This inhibitor displayed unexpected promiscuity, highlighting an underappreciated need to re-examine the target specificity of these Au(I)-based Txnrd inhibitors. Low-pH isoTOP-ABPP is limited by the requirement for cysteine labeling under non-physiological low-pH conditions, which could disrupt protein structure and function. However, this platform has the potential to further the discovery of highly selective selenoprotein inhibitors and screen for general Sec-selective electrophiles which could function under more physiological labeling conditions.
STAR★METHODS
CONTACT FOR REAGENT AND RESOURCE SHARING
Further information and requests for resources and reagents should be directed to and will be fulfilled by the Lead Contact, Eranthie Weerapana (eranthie@bc.edu)
EXPERIMENTAL MODEL AND SUBJECT DETAILS
Cell Lines
The RAW264.7 cell line, a male mouse macrophage cell line, was purchased from the American Type Culture Collection (ATCC). The RAW264.7 cell line was grown at 37°C and 5% CO2 in DMEM supplemented with 10% fetal bovine serum and 1% penicillin/streptomycin. Metabolically light and heavy RAW264.7 cell lines were generated by passaging RAW264.7 cells in SILAC DMEM media (minus L-lysine and L-arginine) supplemented with 10% dialyzed FBS and 1% penicillin/streptomycin and either (Light media) L-arginine (84 μg/mL), L-lysine (146 μg/mL) or (Heavy media) L-arginine, 13C6,15N4 (84 μg/mL), L-Lysine, 13C6 (146 μg/mL).
Mouse Tissues
Tissue samples from male C57BL/6J mice were obtained as frozen tissues from the Jackson Laboratories.
METHOD DETAILS
Preparation of mouse-tissue homogenates
Male C57BL/6J mouse-tissue samples used for this study included; liver, kidney, brain, large intestines, and testes. Tissue samples were washed in either PBS (pH 7.5) for standard isoTOP-ABPP or selenoprotein-enrichment (SE) Buffer (50 mM MES, 50 mM NaH2PO4, 100 mM NaCl, pH 5.75) for low-pH isoTOP-ABPP, then mechanically lysed by dounce homogenization and subsequent sonication in the corresponding buffer. Separation of the soluble and membrane fractions was achieved by ultracentrifugation at 45,000 g for 45 min at 4 °C. Membrane fractions were washed twice through resuspension in appropriate buffer and repeated ultracentrifugation. These soluble and membrane tissue fractions were diluted to 2 mg/mL in either PBS or SE Buffer and stored at −80 °C.
RAW264.7 cell culture and lysate preparation
Standard or metabolically light and heavy SILAC RAW264.7 cells were passaged to 10% confluency and the media was supplemented with NaSeO3 (50 nM, unless another concentration specified). The media was replaced every second day with fresh NaSeO3 supplemented media until the cells were fully confluent. Cells were harvested by scraping and centrifugation at 1,800 g, washed twice in SE Buffer, then lysed by sonication. This lysate was centrifuged at 1,000g for 5 minutes to obtain unfractionated (soluble and membrane proteins) samples, or alternatively soluble fractions were collected upon separation from the membrane (insoluble) fraction by ultracentrifugation at 45,000 g for 45 min at 4 °C. Standard and SILAC RAW264.7 lysates were diluted to 2 mg/mL in SE Buffer, pH 5.75 and then stored frozen at −80 °C. For lysate-treated auranofin studies, the above procedure was performed using PBS instead of SE buffer.
IA-alkyne labeling and CuAAC for (seleno)cysteine identification – RAW264.7 Cells
Standard RAW264.7 lysates (1 mL at 2 mg/mL) were labeled with 100 μM IA-alkyne probe for 1 hour at 25 °C in SE Buffer, and then conjugated to a diazo biotin-azide tag by CuAAC (100 μM azo-tag, 1 mM TCEP, 100 μM TBTA, and 1 mM CuSO4) for 1 hour at 25 °C. Proteins were precipitated by centrifugation (6,500 g, 10 min, RT), resuspended in ice-cold MeOH and repelleted (6,500 g, 10 min, 4 °C). The protein pellet was washed two more times in ice-cold MeOH and then resuspended in 1 mL of 1.2% SDS in PBS by sonication and heating (5 min, 95 °C). Samples were diluted into 5 mL of PBS and 100 μL of streptavidin-agarose beads and rotated at 4 °C overnight. The beads were then incubated with rotation at 25 °C for 3 hours, washed with 0.2% SDS/PBS (5 mL), PBS (3 × 5 mL), and water (3 × 5 mL). Between washes the beads were pelleted by centrifugation (1400 g, 3 min).
The beads were transferred to screw-cap Eppendorf tubes and resuspended in 6 M Urea in PBS (500 μL) and 10 mM dithiothreitol (diluted from 20× stock in water) and heated for 20 min at 65 °C. Iodoacetamide (20 mM, diluted from 20× stock in water) was added and the samples were incubated at 37 °C, 30 min. The beads were pelleted by centrifugation and resuspended in 200 μL of 2 M Urea in PBS, 1 mM CaCl2 (diluted from 100× stock in water), and 2 μg sequence grade modified trypsin. The tryptic digestion was allowed to incubate overnight at 37 °C. The beads were washed in PBS (3 × 500 μL) and water (3 × 500 μL). Labeled peptides were eluted from the beads by sodium-dithionite mediated cleavage of the diazo biotin-azide tag. Beads were incubated with 50 μL of 50 mM sodium dithionite in PBS, rotating at RT for 1 hour. After centrifugation, the supernatant was collected and saved. The beads were washed twice more with 75 μL of 50 mM sodium dithionite and all the collected supernatant fractions were combined. The beads were washed twice more with 75 μL water, and the supernatant fractions were combined with the previous fractions. To the total sample volume (350 μL), 17.5 μL of formic acid (Sigma) was added, and the samples were stored at 20 °C.
IA-alkyne labeling and CuAAC for (seleno)cysteine selenium-dependent expression profiling – RAW264.7 Cells
Standard RAW264.7 lysates (1 mL at 2 mg/mL) from cell cultured in media supplemented with 50 nM selenium or 0 nM selenium were labeled with 100 μM light (50 nM) or heavy (0 nM) IA-alkyne probe for 1 hour at 25 °C in SE Buffer (low-pH isoTOP-ABPP), and then conjugated to an non-isotopic diazo biotin-azide tag by CuAAC (100 μM azo-tag, 1 mM TCEP, 100 μM TBTA, and 1 mM CuSO4) for 1 hour at 25 °C. Alternatively, as a control, the same 100 μM light (50 nM) and heavy (50 nM) IA-alkyne labeling was performed with RAW264.7 lysates (1 mL at 2 mg/mL) from cell cultured in media supplemented with 50 nM selenium. Light and heavy samples were combined and proteins were precipitated by centrifugation (6,500 g, 10 min, RT), resuspended in ice-cold MeOH and repelleted (6,500 g, 10 min, 4 °C). The protein pellet was washed two more times in ice-cold MeOH and then resuspended in 1 mL of 1.2% SDS in PBS by sonication and heating (5 min, 95 °C). Samples were diluted into 5 mL of PBS and 100 μL of streptavidin-agarose beads and rotated at 4 °C overnight. These samples were then carried through the remaining MS sample preparation as described above.
IA-alkyne labeling and CuAAC for (seleno)cysteine reactivity profiling – mouse tissues
Mouse-tissue homogenates (1 mL of 2 mg/ml) were labeled with either 100 μM or 10 μM IA-alkyne probe for 1 hour at 25 °C in either PBS (standard isoTOP-ABPP) or SE Buffer (low-pH isoTOP-ABPP), and then conjugated to an isotopically heavy (10 μM) or light (100 μM) diazo biotin-azide tag by CuAAC (100 μM azo-tag, 1 mM TCEP, 100 μM TBTA, and 1 mM CuSO4) for 1 hour at 25 °C. Alternatively, as a control, 100 μM IA-alkyne labeling was performed on two Mouse-tissue homogenates (1 mL of 2 mg/ml) and then conjugated to heavy (100 μM) or light (100 μM) diazo biotin-azide tag. Light and heavy samples were combined and proteins were precipitated by centrifugation (6,500 g, 10 min, RT), resuspended in ice-cold MeOH and repelleted (6,500 g, 10 min, 4 °C). The protein pellet was washed two more times in ice-cold MeOH and then resuspended in 1 mL of 1.2% SDS in PBS by sonication and heating (5 min, 95 °C). Samples were diluted into 5 mL of PBS and 100 μL of streptavidin-agarose beads and rotated at 4 °C overnight. These samples were then carried through the remaining MS sample preparation as described above.
IA-alkyne labeling and CuAAC for auranofin-sensitivity profiling in lysates – RAW264.7 Cells
Metabolically light or heavy SILAC RAW264.7 cell lysates (0.5 mL of 4 mg/ml) were treated with 1 or 100 μM Auranofin (heavy) or DMSO (light) in PBS buffer for 2 hours at 25 °C. Lysates were desalted on a Nap-5 column equilibrated with SE Buffer, diluting them by half to 2 mg/mL (1 mL fractions). Samples were treated with 100 μM IA-alkyne probe for 1 hour at 25 °C, and then conjugated a non-isotopic diazo biotin-azide tag by CuAAC (100 μM azo-tag, 1 mM TCEP, 100 μM TBTA, and 1 mM CuSO4) for 1 hour at 25 °C. Light and heavy samples were combined and proteins were precipitated by centrifugation (6,500 g, 10 min, RT), resuspended in ice-cold MeOH and repelleted (6,500 g, 10 min, 4 °C). The protein pellet was washed a two more times in ice-cold MeOH and then resuspended in 1 mL of 1.2% SDS in PBS by sonication and heating (5 min, 95 °C). Samples were diluted into 5 mL of PBS and 100 μL of streptavidin-agarose beads and rotated at 4 °C overnight. These samples were then carried through the remaining MS sample preparation as described above.
IA-alkyne labeling and CuAAC for auranofin-dependent reactivity profiling in live cells – RAW264.7 Cells
Standard RAW264.7 cells, grown in 50 nM selenium supplemented media were treated with either 100 μM auranofin or vehicle for 2 hours. Cells were harvested by scraping and centrifugation at 1,800 g, washed twice in SE Buffer, then lysed by sonication. This lysate was centrifuged at 1,000g for 5 minutes to obtain unfractionated (soluble and membrane proteins) lysate samples, which were diluted to a concentration of 2mg/mL. Samples were treated with either 100 μM light (-Auranofin) or heavy (+Auranofin) IA-alkyne probe for 1 hour at 25 °C, and then conjugated to a non-isotopic diazo biotin-azide tag by CuAAC (100 μM azo-tag, 1 mM TCEP, 100 μM TBTA, and 1 mM CuSO4) for 1 hour at 25 °C. Light and heavy samples were combined and proteins were precipitated by centrifugation (6,500 g, 10 min, RT), resuspended in ice-cold MeOH and repelleted (6,500 g, 10 min, 4 °C). The protein pellet was washed two more times in ice-cold MeOH and then resuspended in 1 mL of 1.2% SDS in PBS by sonication and heating (5 min, 95 °C). Samples were diluted into 5 mL of PBS and 100 μL of streptavidin-agarose beads and rotated at 4 °C overnight. These samples were then carried through the remaining MS sample preparation as described above.
LC/LC-MS/MS and data processing
Mass spectrometry was performed using a Thermo LTQ Orbitrap Discovery mass spectrometer coupled to an Agilent 1200 series HPLC. Labeled peptide samples were pressure loaded onto 250 mm fused silica desalting column packed with 4 cm of Aqua C18 reverse phase resin (Phenomenex). Peptides were eluted onto a 100 mm fused silica biphasic column packed with 10 cm C18 resin and 4 cm Partisphere strong cation exchange resin (SCX,Whatman), using a five step multidimensional LC-MS protocol (MudPIT). Each of the five steps used a salt push (0%, 50%, 80%, 100%, and 100%), followed by a gradient of 5–100% buffer B in Buffer A (Buffer A: 95% water, 5% acetonitrile, 0.1% formic acid; Buffer B: 20% water, 80% acetonitrile, 0.1% formic acid). The flow rate through the column was ~0.25 μL/min, with a spray voltage of 2.75 kV. One full MS1 scan (400–1800 MW) was followed by 8 data-dependent scans. For runs without a selenopeptide mass list, the 8 data-dependent scans represented the nth most intense ions from the MS1 scan. For these runs dynamic exclusion was enabled (30 seconds, repeat of 1). For runs with a selenopeptide mass list, the 8 data-dependent scans represented the nth most intense ion from the supplied mass list or if no more list masses present, the nth most intense ions otherwise. For these runs dynamic exclusion was disabled. For mouse-tissue experiments, a mass list containing all potential light diazo biotin-azide modified selenopeptides from only soluble mouse selenoproteins was used. For each peptide, multiple charge states as well as potential missed tryptic cleavage events were used as long as the m/z value was between 400–1800. A similar mass list was used for all RAW264.7 cell lysate samples, except the peptide masses were calculated with standard or light IA-alkyne and the non-isotopically labeled diazo biotin-azide tag, rather than the isotopically light diazo biotin-azide-tag.
The tandem MS data, generated from the 5 MudPIT runs, was analyzed by the SEQUEST algorithm. The precursor-ion mass tolerance was set at 50 ppm while the fragment-ion mass tolerance was set to 0 (default setting). Static modification of cysteine residues (+57.0215 m/z, iodoacetamide alkylation) was assumed with no enzyme specificity. Modified cysteine residues were identified by searching against the Mouse reverse-concatenated non-redundant UniProt Database (release-2012_11). For mouse tissue samples, datasets were independently searched for differential cysteine modifications by either the light (+456.2849) and heavy (+462.2987) diazo biotin-azide tags. For SILAC RAW264.7 cell lysate samples, a differential cysteine modification was allowed for the commercial diazo biotin-azide tag (+258.1481) with independent searches for SILAC static modifications on lysine and arginine for either light (0.0 and 0.0) or heavy (6.02013 and 10.00826) peptides. For standard RAW264.7 cell lysate samples, datasets were independently searched for differential cysteine modifications by either the light (+306.1481) and heavy (+312.1682) IA-alkyne and commercial diazo biotin-azide tags. Modified selenocysteine residues were identified by searching against the mouse reverse-concatenated non-redundant FASTA database combining International Protein Index (IPI) and Ensembl identifiers (selenocysteine (U) in this dataset are annotated as cysteine (C)). For mouse tissue samples, datasets were independently searched for differential selenocysteine modifications by either the light (+504.2294) and heavy (+510.2432) diazo biotin-azide tags, which includes the mass difference between selenium and sulfur (+47.9445) (Figure S1A). For SILAC RAW264.7 cell lysate samples, a differential selenocysteine modification was allowed for the commercial diazo biotin-azide tag (+306.0925) with independent searches for SILAC static modifications on lysine and arginine for either light (0.0 and 0.0) or heavy (6.02013 and 10.00826) peptides. For standard RAW264.7 cell lysate samples, datasets were independently searched for differential selenocysteine modifications by either the light (+354.0925) and heavy (+360.1126) IA-alkyne and commercial diazo biotin-azide tags.
MS2 spectra matches were assembled into protein identifications and filtered using DTASelect2.0, with the --trypstat and --modstat options applied. Peptides were restricted to fully tryptic (-y 2) with a found modification (-m 0) and a delta-CN score greater than 0.06 (-d 0.06). Single peptides per locus were also allowed (-p 1) as were redundant peptides identifications from multiple proteins, but the database contained only a single consensus splice variant for each protein. Manual examination, looking for the distinctive broad isotopic envelope, was performed for every identified selenocysteine residue. Additionally, manual analysis of the MS2 spectra for all selenopeptides peptides was performed to verify that the site of IA-alkyne labeling was indeed the selenocysteine residue (Table S2). Peptide light to heavy (L:H) ratios were calculated using the cimage quantification package. In order to quantify L:H ratios from peptides containing a selenocysteine residue an additional column and row for selenium and selenocysteine was included into the cimage.params table (the DTASelect_filter.txt files annotated selenocysteine as U), which allowed for standard cimage analysis with no further modifications. Cimage computational filters were set as previously described, but for some peptides from the auranofin treated samples, manual examination of the output data allowed for additional ratios to be included into the final dataset.
Thioredoxin Reductase Activity Assays
Assay of thioredexin reductase (Txnrd) activity was performed at low pH (5.75) with or without the Txnrd inhibitor, auranofin. Briefly, 2 μL of rat liver thioredoxin reductase (>100 units/mg) was added to 0.5 mL of low pH Txnrd assay buffer (1 mM EDTA, 200 μM NADPH in SE Buffer), and allowed to incubate for 10 minutes at 25°C. The assay was initiated with the addition of 5 μL DTNB (25 mM). Absorbance readings were taken at 412 nm every 5 seconds for 300 seconds on a ThermoScientific Nanodrop 2000c spectrophotometer. For inhibitor studies, 5 μL of auranofin (1 mM) was added after the intial 10-minute incubation, and allowed to incubate for an additional 5 minutes before the reaction was initiated. A control assay for each condition was also performed without the addition of enzyme. All assays were performed in triplicate, background signal subtracted, and average and standard deviation calculated at each time-point.
QUANTIFICATION AND STATISTICAL ANALYSIS
Statistical analysis of global changes in (seleno)cysteine R-values (Figure 3) were calculated using Excel (Microsoft). Statistical values including the exact n are reported in the Figure Legend.
Supplementary Material
KEY RESOURCES TABLE.
| REAGENT or RESOURCE | SOURCE | IDENTIFIER |
|---|---|---|
| Biological Samples | ||
| Male C57BL/6J Mouse Tissues (Liver, Kidney, Small Intestines, Brain, Testes) | The Jackson Laboratories | N/A |
| Chemicals, Peptides, and Recombinant Proteins | ||
| DMEM/High Glucose | GE Lifesciences | SH30243.01 |
| Hyclone Penicillin-streptomycin | Fisher Scientific | SV30010 |
| Fetal Bovine Serum | Atlanta Biologicals | S11150 |
| Hyclone Typsin | Fisher Scientific | SH3004201 |
| SILAC DMEM | Thermo Scientific | 88364 |
| Dialyzed FBS | Fisher Scientific | PI88440 |
| Cell Dissociation Buffer | Gibco | 13131–014 |
| L-lysine | Sigma-Aldrich | L8662 |
| L-arginine | Sigma-Aldrich | A8094 |
| L-lysine, 13C6, | Cambridge Isotopes | CLM-2247-H-1 |
| L-arginine, 13C6, 15N4 | Cambridge Isotopes | CNLM-539-H-0.5 |
| DPBS | Corning | 21–031-CM |
| Ultrapure DTT | Invitrogen | 15508–013 |
| Iodoacetamide | ACROS | 122270050 |
| TCEP | Aldrich | C4706 |
| Iodoacetamide-alkyne | Made in-house | N/A |
| Light/Heavy Iodoacetamide-alkyne | Made in-house | N/A |
| Streptavidin resin | Thermo Scientific | 20353 |
| Diazo Biotin Azide (Non-isotopic Azo-tag) | Click Chemistry Tools | 1041–25 |
| Light/Heavy Azo-tag | Qian et al. 2013 | N/A |
| TBTA | Aldrich | 678937 |
| Sequence grad modified trypsin | Promega | V5111 |
| Sodium Hydrosulfide hydrate | Sigma-Aldrich | 161527 |
| Formic acid Optima LC/MS | Fisher Chemical | A117–50 |
| Sodium selenite | Sigma-Aldrich | S5261 |
| Thioredoxin reductase from rat liver | Sigma-Aldrich | T9698–50UG |
| EDTA | Sigma-Aldrich | E6758–100G |
| NADPH | AlfaAesar | A14331 |
| DTNB | Sigma-Aldrich | D218200–1G |
| auranofin | Sigma-Aldrich | A6733 |
| Experimental Models: Cell Lines | ||
| RAW264.7 | ATCC | TIB-71 |
| Software and Algorithms | ||
| SEQUEST | Yates Lab | http://fields.scripps.edu/downloads.php |
| RAW Xtract | Version 1.9.9.2; 2004 release | http://fields.scripps.edu/downloads.php |
| CIMAGE | Weerapana et al. 2010 | N/A |
Highlights.
We present a novel chemoproteomic platform for selenocysteine (Sec) identification.
IAA labeling at low pH masks cysteine (Cys) but not Sec reactivity.
Selenoprotein identification corresponds to known tissue expression profiles.
Auranofin, a Txnrd inhibitor, reduces IAA labeling of both Cys and Sec residues.
ACKNOWLEDGEMENTS
We thank members of the Weerapana and Wang Labs for assistance with experiments and manuscript preparation. This work was funded by NIH grant 1R01GM117004 (E.W.).
Footnotes
SUPPLEMENTAL INFORMATION
Supplemental Information include three figures and seven tables and can be found with this article online.
REFERENCES
- Abo M, Li C, and Weerapana E (2018). Isotopically-Labeled Iodoacetamide-Alkyne Probes for Quantitative Cysteine-Reactivity Profiling. Mol. Pharm 15, 743–749. [DOI] [PMC free article] [PubMed] [Google Scholar]
- Al-Taie OH, Uceyler N, Eubner U, Jakob F, Mork H, Scheurlen M, Brigelius-Flohe R, Schottker K, Abel J, Thalheimer A, et al. (2009). Expression Profiling and Genetic Alterations of the Selenoproteins GI-GPx and SePP in Colorectal Carcinogenesis. Nutr. Cancer 48, 6–14. [DOI] [PubMed] [Google Scholar]
- Apostolou S, Klein JO, Mitsuuchi Y, and Shetler JN (2004). Growth inhibition and induction of apoptosis in mesothelioma cells by selenium and dependence on selenoprotein SEP15 genotype. Oncogene 23, 5032–5040. [DOI] [PubMed] [Google Scholar]
- Arnér ESJ (2010). Selenoproteins—What unique properties can arise with selenocysteine in place of cysteine? Exp. Cell Res 316, 1296–1303. [DOI] [PubMed] [Google Scholar]
- Backus KM, Correia BE, Lum KM, Forli S, Horning BD, González-Páez GE, Chatterjee S, Lanning BR, Teijaro JR, Olson AJ, et al. (2016). Proteome-wide covalent ligand discovery in native biological systems. Nature 534, 570–574. [DOI] [PMC free article] [PubMed] [Google Scholar]
- Bak DW, Pizzagalli MD, and Weerapana E (2017). Identifying Functional Cysteine Residues in the Mitochondria. ACS Chem. Biol 12, 947–957. [DOI] [PMC free article] [PubMed] [Google Scholar]
- Barnard PJ, and Berners-Price SJ (2007). Targeting the mitochondrial cell death pathway with gold compounds. Coord. Chem. Rev 251, 1889–1902. [Google Scholar]
- Berners-Price SJ, and Filipovska A (2008). The Design of Gold-Based, Mitochondria-Targeted Chemotherapeutics. Aust. J. Chem 61, 661–668. [Google Scholar]
- Bindoli A, Rigobello MP, Scutari G, Gabbiani C, Casini A, and Messori L (2009). Thioredoxin reductase: A target for gold compounds acting as potential anticancer drugs. Coord. Chem. Rev 253, 1692–1707. [Google Scholar]
- Cadenas C, Franckenstein D, Schmidt M, Gehrmann M, Hermes M, Geppert B, Schormann W, Maccoux LJ, Schug M, Schumann A, et al. (2010). Role of thioredoxin reductase 1 and thioredoxin interacting protein in prognosis of breast cancer. Breast Cancer Res 2010 12:3 12, R44. [DOI] [PMC free article] [PubMed] [Google Scholar]
- Calvo A, Xiao N, Kang J, Best CJM, Leiva I, Emmert-Buck MR, Jorcyk C, and Green JE (2002). Alterations in Gene Expression Profiles during Prostate Cancer Progression: Functional Correlations to Tumorigenicity and Down-Regulation of Selenoprotein-P in Mouse and Human Tumors. Cancer Res. 62, 5325–5335. [PubMed] [Google Scholar]
- Davis CD, Tsuji PA, and Milner JA (2012). Selenoproteins and Cancer Prevention. Annu. Rev. Nutr 32, 73–95. [DOI] [PubMed] [Google Scholar]
- Donovan J, and Copeland PR (2010). Threading the Needle: Getting Selenocysteine Into Proteins. Antioxid. Redox Signal 12, 881–892. [DOI] [PMC free article] [PubMed] [Google Scholar]
- Dyson HJ, Jeng M-F, Tennant LL, Slaby I, Lindell M, Cui D-S, Kuprin S, and Holmgren A (1997). Effects of Buried Charged Groups on Cysteine Thiol Ionization and Reactivity in. Biochemistry 36, 2622–2636. [DOI] [PubMed] [Google Scholar]
- Fernandes AP, Capitanio A, Selenius M, Brodin O, Rundlöf AK, and Björnstedt M (2009). Expression profiles of thioredoxin family proteins in human lung cancer tissue: correlation with proliferation and differentiation. Histopathology 55, 313–320. [DOI] [PubMed] [Google Scholar]
- Giron P, Dayon L, and Sanchez J-C (2010). Cysteine tagging for MS-based proteomics. Mass Spectrom. Rev 30, 366–395. [DOI] [PubMed] [Google Scholar]
- Gunatilleke SS, de Oliveira CAF, McCammon JA, and Barrios AM (2008). Inhibition of cathepsin B by Au(I) complexes: a kinetic and computational study. J. Biol. Inorg. Chem 13, 555–561. [DOI] [PubMed] [Google Scholar]
- Handy DE, and Loscalzo J (2016). Selenoproteins in Cardiovascular Redox Pathology In Selenium, (Cham: Springer, Cham; ), pp. 463–474. [Google Scholar]
- Hatfield DL, Tsuji PA, Carlson BA, and Gladyshev VN (2014). Selenium and selenocysteine: roles in cancer, health, and development. Trends Biochem. Sci 39, 112–120. [DOI] [PMC free article] [PubMed] [Google Scholar]
- Hondal RJ, and Ruggles EL (2011). Differing views of the role of selenium in thioredoxin reductase. Amino Acids 41, 73–89. [DOI] [PMC free article] [PubMed] [Google Scholar]
- Huber RE, and Criddle RS (1967). Comparison of the chemical properties of selenocysteine and selenocystine with their sulfur analogs. Arch. Biochem. and Biophys 122, 164–173. [DOI] [PubMed] [Google Scholar]
- Ingold I, Berndt C, Schmitt S, Doll S, Poschmann G, Buday K, Roveri A, Peng X, Freitas FP, Seibt T, et al. (2018). Selenium Utilization by GPX4 Is Required to Prevent Hydroperoxide-Induced Ferroptosis. Cell 172, 409–412.e421. [DOI] [PubMed] [Google Scholar]
- Jao SC, English Ospina SM, Berdis AJ, Starke DW, Post CB and Mieyal JJ (2006) Computational and mutational analysis of human glutaredoxin (thioltransferase): probing the molecular basis of the low pKa of cysteine 22 and its role in catalysis. Biochemistry 45, 4785–4796. [DOI] [PubMed] [Google Scholar]
- Kanzok SM, Fechner A, Bauer H, Ulschmid JK, Muller H-M, Botella-Munoz J, Schneuwly S, Schirmer RH, and Becker K (2001). Substitution of the Thioredoxin System for Glutathione Reductase in Drosophila melanogaster. Science 291, 643–646. [DOI] [PubMed] [Google Scholar]
- Karlenius TC, Shah F, Yu WC, and Hawkes HJ (2011). The selenium content of cell culture serum influences redox-regulated gene expression. Biotechniques, 50, 295–301. [DOI] [PubMed] [Google Scholar]
- Kast R (2010). Glioblastoma Invasion, Cathepsin B, and the Potential for Both to be Inhibited by Auranofin, an Old Anti-Rheumatoid Arthritis Drug. Cen. Eur. Neurosurg 71, 139–142. [DOI] [PubMed] [Google Scholar]
- Kaushal N, Gandhi UH, Nelson SM, Narayan V, and Prabhu KS (2011). Selenium and Inflammation In Selenium, (New York, NY: Springer, New York, NY; ), pp. 443–456. [Google Scholar]
- Kryukov GV, Castellano S, Novoselov SV, Lobanov AV, Zehtab O, Guigó R, and Gladyshev VN (2003). Characterization of Mammalian Selenoproteomes. Science 300, 1439–1443. [DOI] [PubMed] [Google Scholar]
- Kumaraswamy E, Malykh A, Korotkov KV, Kozyavkin S, Hu Y, Kwon SY, Moustafa ME, Carlson BA, Berry MJ, Lee BJ, et al. (2000). Structure-Expression Relationships of the 15-kDa Selenoprotein Gene Possible Role of the Protein in Cancer Etiology. J. Biol. Chem 275, 35540–35547. [DOI] [PubMed] [Google Scholar]
- Kühbacher M, Bartel J, Hoppe B, Alber D, Bukalis G, Bräuer AU, Behne D, and Kyriakopoulos A (2009). The brain selenoproteome: priorities in the hierarchy and different levels of selenium homeostasis in the brain of selenium-deficient rats. J. Neurochem 110, 133–142. [DOI] [PubMed] [Google Scholar]
- Labunskyy VM, Hatfield DL, and Gladyshev VN (2014). Selenoproteins: Molecular Pathways and Physiological Roles. Physiol. Rev 94, 739–777. [DOI] [PMC free article] [PubMed] [Google Scholar]
- Legrain Y, Touat-Hamici Z, and Chavatte L (2014). Interplay between Selenium Levels, Selenoprotein Expression, and Replicative Senescence in WI-38 Human Fibroblasts. J. Biol. Chem 289, 6299–6310. [DOI] [PMC free article] [PubMed] [Google Scholar]
- Li M, Feng W, Zhai Q, and Feng G (2017). Selenocysteine detection and bioimaging in living cells by a colorimetric and near-infrared fluorescent turn-on probe with a large stokes shift. Biosens. Bioelectron 87, 894–900. [DOI] [PubMed] [Google Scholar]
- Lobanov AV, Fomenko DE, Zhang Y, Sengupta A, Hatfield DL, and Gladyshev VN (2007). Evolutionary dynamics of eukaryotic selenoproteomes: large selenoproteomes may associate with aquatic life and small with terrestrial life. Genome Biol. 2007 8:9 8, R198. [DOI] [PMC free article] [PubMed] [Google Scholar]
- Lobanov AV, Hatfield DL, and Gladyshev VN (2008). Selenoproteinless animals: Selenophosphate synthetase SPS1 functions in a pathway unrelated to selenocysteine biosynthesis. Protein Sci. 17, 176–182. [DOI] [PMC free article] [PubMed] [Google Scholar]
- Lobanov AV, Hatfield DL, and Gladyshev VN (2009). Eukaryotic selenoproteins and selenoproteomes. Biochim. Biophys. Acta. Gen. Subj 1790, 1424–1428. [DOI] [PMC free article] [PubMed] [Google Scholar]
- Lu J, and Holmgren A (2009). Selenoproteins. J. Biol. Chem 284, 723–727. [DOI] [PubMed] [Google Scholar]
- Mariotti M, Lobanov AV, Guigó R, and Gladyshev VN (2013). SECISearch3 and Seblastian: new tools for prediction of SECIS elements and selenoproteins. Nucleic Acids Res. 41, e149–e149. [DOI] [PMC free article] [PubMed] [Google Scholar]
- Marques MC, Tapia C, Gutiérrez-Sanz O, Ramos AR, Keller KL, Wall JD, De Lacey AL, Matias PM, and Pereira IAC (2017). The direct role of selenocysteine in [NiFeSe] hydrogenase maturation and catalysis. Nat. Chem. Biol 13, 544–550. [DOI] [PubMed] [Google Scholar]
- Martell J Seo Y, Bak DW, Kingsley SF, Tissenbaum HA, and Weerapana E (2016). Global Cysteine-Reactivity Profiling during Impaired Insulin/IGF-1 Signaling in C. elegans Identifies Uncharacterized Mediators of Longevity. Cell Chem. Biol 23, 955–966. [DOI] [PMC free article] [PubMed] [Google Scholar]
- Marzano C, Gandin V, Folda A, Scutari G, Bindoli A, and Rigobello MP (2007). Inhibition of thioredoxin reductase by auranofin induces apoptosis in cisplatin-resistant human ovarian cancer cells. Free Radic. Biol. Med 42, 872–881. [DOI] [PubMed] [Google Scholar]
- Mohler JL, Morris TL, Ford OH, Alvey RF, Sakamoto C, and Gregory CW (2002). Identification of differentially expressed genes associated with androgen‐independent growth of prostate cancer. The Prostate 51, 247–255. [DOI] [PubMed] [Google Scholar]
- Novoselov SV, Kryukov GV, Xu X-M, Carlson BA, Hatfield DL, and Gladyshev VN (2007). Selenoprotein H Is a Nucleolar Thioredoxin-like Protein with a Unique Expression Pattern. J. Biol. Chem 282, 11960–11968. [DOI] [PubMed] [Google Scholar]
- Rigobello MP, Folda A, Baldoin MC, Scutari G, and Bindoli A (2009). Effect of Auranofin on the mitochondrial generation of hydrogen peroxide. Role of thioredoxin reductase. Free Radic. Res 39, 687–695. [DOI] [PubMed] [Google Scholar]
- Snider GW, Ruggles E, Khan N, and Hondal RJ (2013). Selenocysteine Confers Resistance to Inactivation by Oxidation in Thioredoxin Reductase: Comparison of Selenium and Sulfur Enzymes. Biochemistry 52, 5472–5481. [DOI] [PMC free article] [PubMed] [Google Scholar]
- Su AI, Cooke MP, Ching KA, Hakak Y, Walker JR, Wiltshire T, Orth AP, Vega RG, Sapinoso LM, Moqrich A, et al. (2002). Large-scale analysis of the human and mouse transcriptomes. Proc. Nat. Acad. Sci. U.S.A 99, 4465–4470. [DOI] [PMC free article] [PubMed] [Google Scholar]
- Sunde RA, and Raines AM (2011). Selenium Regulation of the Selenoprotein and Nonselenoprotein Transcriptomes in Rodents. Adv. Nutr 2, 138–150. [DOI] [PMC free article] [PubMed] [Google Scholar]
- Turanov AA, Malinouski M, and Gladyshev VN (2011). Selenium and Male Reproduction In Selenium, (New York, NY: Springer, New York, NY; ), pp. 409–417. [Google Scholar]
- Turunen N, Karihtala P, Mantyniemi A, Sormunen R, Holhgrem A, Kinnula VL, and Soini Y (2004). Thioredoxin is associated with proliferation, p53 expression and negative estrogen and progesterone receptor status in breast carcinoma. Apmis 112, 123–132. [DOI] [PubMed] [Google Scholar]
- Ueno M, Masutani H, Arai RJ, Yamauchi A, Hirota K, Sakai T, Inamoto T, Yamaoka Y, Yodoi J, and Nikaido T (1999). Thioredoxin-dependent Redox Regulation of p53-mediated p21 Activation. J. Biol. Chem 274, 35809–35815. [DOI] [PubMed] [Google Scholar]
- Urig S, and Becker K (2006). On the potential of thioredoxin reductase inhibitors for cancer therapy. Sem. Cancer Biol 16, 452–465. [DOI] [PubMed] [Google Scholar]
- Weerapana E, Wang C, Simon GM, Richter F, Khare S, Dillon MBD, Bachovchin DA, Mowen K, Baker D, and Cravatt BF (2010). Quantitative reactivity profiling predicts functional cysteines in proteomes. Nature 468, 790–795. [DOI] [PMC free article] [PubMed] [Google Scholar]
- Whitby LR, Obach RS, Simon GM, Hayward MM, and Cravatt BF (2017). Quantitative Chemical Proteomic Profiling of the in VivoTargets of Reactive Drug Metabolites. ACS Chem. Biol acschembio.7b00346–11. [DOI] [PMC free article] [PubMed] [Google Scholar]
- Wu C, Jin X, Tsueng G, Afrasiabi C, and Su AI (2016). BioGPS: building your own mash-up of gene annotations and expression profiles. Nucleic Acids Res. 44, D313–D316. [DOI] [PMC free article] [PubMed] [Google Scholar]
- Xu X-M, Carlson BA, Mix H, Zhang Y, Saira K, Glass RS, Berry MJ, Gladyshev VN, and Hatfield DL (2006). Biosynthesis of Selenocysteine on Its tRNA in Eukaryotes. PLoS Biol. 5, e4. [DOI] [PMC free article] [PubMed] [Google Scholar]
- Yoo M-H, Carlson BA, Tsuji P, Irons R, Gladyshev VN, and Hatfield DL (2010). Alteration of Thioredoxin Reductase 1 Levels in Elucidating Cancer Etiology In Thiol Redox Transitions in Cell Signaling, Part B: Cellular Localization and Signaling, (Elsevier; ), pp. 255–275. [DOI] [PMC free article] [PubMed] [Google Scholar]
- Zhang B, Ge C, Yao J, Liu Y, Xie H, and Fang J (2015). Selective Selenol Fluorescent Probes: Design, Synthesis, Structural Determinants, and Biological Applications. J. Am. Chem. Soc 137, 757–769. [DOI] [PubMed] [Google Scholar]
- Zhang Y, Romero H, Salinas G, and Gladyshev VN (2006). Dynamic evolution of selenocysteine utilization in bacteria: a balance between selenoprotein loss and evolution of selenocysteine from redox active cysteine residues. Genome Biol. 2007 8:9 7, R94. [DOI] [PMC free article] [PubMed] [Google Scholar]
- Zhou Y, Wynia-Smith SL, Couvertier SM, Kalous KS, Marletta MA, Smith BC, and Weerapana E (2016). Chemoproteomic Strategy to Quantitatively Monitor Transnitrosation Uncovers Functionally Relevant S- Nitrosation Sites on Cathepsin D and HADH2. Cell Chem. Biol 23, 727–737. [DOI] [PMC free article] [PubMed] [Google Scholar]
Associated Data
This section collects any data citations, data availability statements, or supplementary materials included in this article.