

SUMMARY
Cancer cells heavily depend on the amino acid glutamine to meet the demands associated with growth and proliferation. Due to the rapid consumption of glutamine, cancer cells frequently undergo glutamine starvation in vivo. We and others have shown that p53 is a critical regulator in metabolic stress resistance. To better understand the molecular mechanisms by which p53 activation promotes cancer cell adaptation to glutamine deprivation, we identified p53-dependent genes that are induced upon glutamine deprivation by using RNA-seq analysis. We show that Slc7a3, an arginine transporter, is significantly induced by p53. We also show that increased intracellular arginine levels following glutamine deprivation are dependent on p53. The influx of arginine has minimal effects on known metabolic pathways upon glutamine deprivation. Instead, we found arginine serves as an effector for mTORC1 activation to promote cell growth in response to glutamine starvation. Therefore, we identify a p53-inducible gene that contributes to the metabolic stress response.
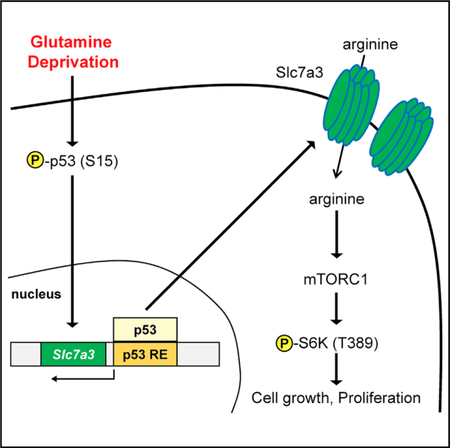
Graphical Abstract
In Brief
Lowman et al. show that glutamine deprivation induces Slc7a3 to increase intracellular arginine levels in a p53-dependent manner. This induction transiently sustains mTORC1 activity and contributes to cellular adaptation to low glutamine conditions.
INTRODUCTION
Glutamine is an essential amino acid used by cancer cells for biosynthetic, bioenergetic, and antioxidant purposes (Zhang et al., 2017). Its catabolism provides carbon and nitrogen for the synthesis of nonessential amino acids and nucleotides. It also replenishes carbon to tricarboxylic acid (TCA) intermediates when glucose becomes limited (Le et al., 2012). Oncogenic transformation by RAS and c-MYC drives the influx of glutamine by upregulating cell surface transporters and cytosolic enzymes to facilitate its breakdown (Gao et al., 2009; Wise and Thompson, 2010; Yuneva et al., 2012). Its rapid uptake and use results in minimal detection within solid tumors (Roberts and Frankel, 1949). Indeed, within a tumor, there exists striking differences in glutamine concentrations (Pan et al., 2016; Reid et al., 2013). Despite the metabolic stress incurred by limited glutamine levels, cancer cells have the capacity to adapt to the conditions for survival and growth. How cancer cells positively respond to nutrient starvation, especially to glutamine depletion, is not fully understood.
The tumor suppressor p53 is a transcription factor that governs cell survival and death fates (Kastenhuber and Lowe, 2017). Its stress-sensing capability was originally described in the context of genotoxic stress but in recent years has extended to regulating metabolic pathways in response to nutrient perturbations (Itahana and Itahana, 2018). We have previously reported a signaling pathway requiring the PP2A phosphatase complex that results in p53 activation to sustain cell survival upon glutamine deprivation (Reid et al., 2013). In colon cancer cells deprived of serine, p53 initiates cell cycle arrest to maintain cell survival (Maddocks et al., 2013). In murine muscle cells experiencing glucose deprivation, p53 promotes fatty acid oxidation to support cell survival (Assaily et al., 2011). Thus far, p53 appears to exert a survival response to metabolic stress in a cellular and stimuli-specific manner (Berkers et al., 2013; Tran et al., 2017). Nonetheless, its transcriptional response to glutamine deprivation is undetermined.
In this study, we reveal that, in response to glutamine deprivation, p53 activation leads to the transcriptional upregulation of the arginine transporter Slc7a3, and its expression promotes an increase in intracellular arginine levels. Increased arginine contributes to sustained activation of the mammalian target of rapamycin complex 1 (mTORC1). Our study describes an identified p53-inducible gene that regulates metabolic adaptation upon glutamine deprivation.
RESULTS
Glutamine-Deprivation-Induced p53 Activation Upregulates Slc7a3
Previous studies have shown that the withdrawal of glutamine activates the tumor suppressor p53 (Reid et al., 2013). We confirmed activation of p53 following glutamine deprivation by phosphorylation of serine 18 in mouse embryonic fibroblasts (MEFs) expressing wild-type (WT) p53 (Figure 1A). To further elucidate the metabolic response of p53 in the context of glutamine depletion, we starved MEF WT (p53+/+) and p53-deleted MEF (p53−/−) cells of glutamine and extracted RNA for gene analysis. Genes that are induced in p53+/+ cells and yet remain unchanged or downregulated in p53−/− cells upon glutamine deprivation were identified (Figure 1B). Interestingly, we found that the highest upregulated gene upon glutamine deprivation is solute-like carrier family 7, member 3 (Slc7a3), which encodes for the transport of cationic amino acids into the cell at the plasma membrane (Figure 1B). Known p53 targets were also checked and shown to be induced in a p53-dependent and -independent manner upon glutamine deprivation (Figure 1B). Slc7a3 upregulation was validated by qPCR in MEF WT and p53−/− cells (Figure 1C). We further showed the expression of Slc7a3 was specific to the inhibition of glutamine metabolism by subjecting MEF WT cells to different types of metabolic and genotoxic stress by using nutrient withdrawal or chemical inhibitors (Figure 1D). Only upon glutamine deprivation or inhibition of the glutaminolysis enzyme glutaminase do we see a significant increase of Slc7a3. We further verified SLC7A3 induction by p53 by using a WT p53-tetracycline-inducible human osteosarcoma cell line, SaOs-2. Similar to MEF WT cells, glutamine deprivation phosphorylated p53 at serine 15 in doxycycline-treated cells (Figure 1E). We extracted RNA of SaOs-2 cells cultured under the aforementioned conditions and showed that SLC7A3 was significantly upregulated upon glutamine deprivation in p53-expressing cells and not by arginine or lysine deprivation (Figures 1F and S1A). Additionally, we performed an early time course to determine how early Slc7a3 is induced by glutamine deprivation in MEF WT and SaOs-2 cells. In MEF cells, significant induction occurred as early as 2 h and in SaOs-2 cells, as early as 1 h of removal of glutamine (Figures 1G and 1H). Oncogenic transformation by RAS increases cellular dependence on glutamine (Gaglio et al., 2009). Hence, we next measured the induction of Slc7a3 in E1A-RAS-transformed MEF cells in response to glutamine withdrawal. Again, we showed both protein and mRNA levels of Slc7a3 are upregulated in RAS-transformed MEFs depleted of glutamine (Figure 1I). Indeed, in a panel of cell lines expressing WT or mutant p53, we observed varied induction of Slc7a3 (Figure S1B). Based upon the data, we conclude that Slc7a3 is upregulated in a p53-dependent manner in the context of glutamine deprivation.
Figure 1. Glutamine Deprivation-Induced p53 Activation Upregulates Slc7a3.

(A) Immunoblot for phospho-p53 (S18), total p53, and actin in MEF cells cultured in complete or glutamine-free medium for 18 h.
(B) RNA sequencing heatmap showing most upregulated fold change (top) and p53-inducible genes (bottom) in MEF wild-type (WT) and p53−/− cells cultured in complete or glutamine-free medium for 18 h. Each condition was done in triplicate.
(C) Slc7a3 mRNA expression of MEF WT and p53−/− cells cultured in complete or glutamine-free medium for 18 h.
(D) Slc7a3 mRNA expression of MEF WT cells cultured in complete medium or the indicated metabolic (glutamine-free, serum-free, or 10 μm glutaminase inhibition, BPTES) and genotoxic (2 μM camptothecin, CPT; 0.34 μM doxorubicin, Doxo) stress for 18 h, except for glucose, which was deprived for 6 h.
(E) Immunoblot for phospho-p53 (S15), total p53, and actin in SaOs-2 cells cultured for 24 h in the absence or presence of doxycycline to induce p53. Cells were separated into complete and glutamine-free medium and cultured for an additional 24 h.
(F) SLC7A3 mRNA expression of SaOs-2 cells cultured as described in (F).
(G and H) Short time course of Slc7a3 mRNA expression in (G) SaOs-2 or (H) MEF WT cells deprived of glutamine.
(I) Immunoblot for Slc7a3 and actin (left) and Slc7a3 mRNA expression (right) in E1A-RAS transformed MEF cells cultured in complete or glutamine-free medium for 18 h.
Data generated for qRT-PCR represent mean ± SD and n = 3 independent experiments. Statistical significance denoted by *p < 0.05, **p < 0.01, ***p < 0.005 was calculated with unpaired two-tailed Student’s t test. See also Figure S1.
Slc7a3 Is a p53-Inducible Gene
The induction of Slc7a3 in p53-expressing cells deprived of glutamine prompted us to determine whether it was a p53-inducible gene, especially because its induction was markedly more robust than validated p53 targets such as Cdkn1 (Figure 1B). We scanned the Slc7a3 gene, which is conserved in human and mice and located on the chromosome X for putative p53 response elements. In humans, SLC7A3 contains 12 coding exons and possible p53 binding sites downstream of the coding region as well as within the third intron (Figure 2A). Murine Slc7a3 is 82% identical to the human gene and contains 14 coding exons. We became interested in whether the downstream p53 response element (RE) was valid in murine cells. We first used RAS-transformed MEFs for chromatin immunoprecipitation with p53-antibody in cells cultured under complete and glutamine-free conditions. We looked for genomic binding of Slc7a3, along with the known p53-target gene Cdkn1 (Figure 2B). Both genes bound to p53 in glutamine-starved cells. Next, we used p53-induced SaOs-2 cells to confirm human SLC7A3 as a p53-inducible gene by using primers generated downstream of the coding region (Figure 2C) and within the third intron (Figure 2D). Again, we showed p53 bound to SLC7A3 and CDKN1 (Figure 2D). Next, to further address the mechanism by which glutamine deprivation specifically induces SLC7A3, we measured mRNA levels of SLC7A1 and SLC7A2 in p53-expressing SaOs-2 cells deprived of glutamine. We only detected p53-dependent upregulation of SLC7A3 (Figure S2A). Furthermore, metabolic and endoplasmic reticulum (ER) stress lead to the transcriptional induction of other cationic amino acid transporters by activation of ATF4 (Han et al., 2013; Lopez et al., 2007; Ou et al., 2015). To better understand how p53 upregulates Slc7a3 upon glutamine starvation, we checked whether silencing of ATF4, a significant regulator of glutamine deficiency, would affect Slc7a3 expression. We used small interfering RNA (siRNA) to ATF4 in MEF WT and p53−/− cells cultured in complete and glutamine-free medium. We found that ATF4 is responsible for p53 activation upon glutamine deprivation, as the phosphorylation was blocked and the tested p53 regulated survival genes, including Slc7a3, were not induced (Figures S2B and S2C). Conversely, we also tested the effect of p53 deletion on ATF4-targeted genes and found that deletion of p53 had no effect on known ATF4 targets (Figure S2B) but increased ATF4 protein levels, likely due to compensational mechanisms (Figure S2C). Together, these data demonstrate that ATF4 is activated upon glutamine deprivation and may cooperate with p53 to regulate Slc7a3 expression.
Figure 2. Slc7a3 Is a p53-Inducible Gene.

(A) Schematic of the human SLC7A3 gene with location of generated human chromatin immunoprecipitation (ChIP) primers.
(B and C) DNA gel image of p53 ChIP from (B) E1A-RAS MEF and (C) SaOs-2 cells expressing p53 and cultured in complete or glutamine-free medium overnight. DNA from the ChIP assay was used in a PCR assay with mouse and human primers corresponding to Slc7a3 RE1, Cdkn1, and a negative primer.
(D) SaOs-2 cells expressing p53 were cultured in complete or glutamine-free medium for 24 h. DNA was used for p53 ChIP analysis by PCR using human primers against SLC7A3 RE2 and CDKN1.
PCR-ChIP data represent mean ± SD and n = 3 independent experiments. *p < 0.05, ***p < 0.005 were calculated by unpaired two-tailed Student’s t test. See also Figure S2.
Glutamine Deprivation Increases Arginine Uptake in a p53-Dependent Manner
Slc7a3 belongs to a family of cationic amino acid transporters that preferentially uptake the positively charged metabolites arginine, ornithine, and lysine (Hosokawa et al., 1997). To test the functional expression of Slc7a3, we first measured arginine levels in MEF cells expressing or deficient for WT p53 and treated in the presence or absence of glutamine. Liquid chromatography-mass spectrometry (LC-MS) analysis of extracted metabolites from MEFs revealed a significant increase in relative arginine levels upon glutamine deprivation in a p53-dependent manner and no change in p53-null MEFs (Figure 3A), nor were there significant differences in the cationic amino acids lysine and ornithine (Figure S3A). We further studied arginine uptake by measuring the concentration of L-arginine remaining in the medium of MEF WT and p53−/− cells over time when glutamine is removed. We observed a rapid uptake of L-arginine as early as 2 h of glutamine deprivation in MEF WT cells (Figure 3B). A complete analysis of amino acid metabolites allowed us to compare the relative abundance in the different medium conditions. As expected, we noted a significant decline in glutamine and glutamate levels in both cell lines upon glutamine withdrawal (Figures 3C and 3D). Threonine, along with the non-essential amino acids asparagine and serine were significantly increased in response to glutamine depletion but, apart from asparagine, were not p53-dependent because those amino acids also increased in p53-null MEFs upon glutamine deprivation (Figure 3D; Table S1). Of note, the increase in de novo asparagine is consistent with recent reports that demonstrate its growth-promoting role in cancer cells restricted of glutamine (Krall et al., 2016; Pavlova et al., 2018; Zhang et al., 2014). Next, we directly tested whether Slc7a3 was responsible for the intracellular rise of L-arginine by knocking down Slc7a3 in MEF WT cells with short hairpin RNA (shRNA) (Figure 3E) and analyzed the metabolite levels by LC-MS. Knock down of Slc7a3 hindered the intracellular accumulation of L-arginine when glutamine was removed (Figure 3F). Consistent with previous results, L-ornithine and L-lysine were unaffected by changes to glutamine levels in control cell lines or when Slc7a3 was knocked down (Figure 3G). Overall, these metabolite analyses show a rise in intracellular arginine upon glutamine deprivation, validating the functional induction of Slc7a3 in p53-expressing cells.
Figure 3. Glutamine Deprivation Increases Arginine Uptake in a p53-Dependent Manner.

(A) Relative arginine levels of MEF WT and p53−/− cells cultured in complete or glutamine-free medium for 6 h.
(B) Relative measurement of L-arginine uptake from the media of MEF WT and p53−/− cells deprived of glutamine over 3 h.
(C and D) Metabolite profile of amino acids from (C) MEF WT or (D) p53−/− cells cultured in complete and glutamine-free medium for 6 h. Extracted metabolites were analyzed by LC-MS and adjusted to cell number.
(E–G) Slc7a3 mRNA expression of MEF WT cells stably transfected with an empty vector or Slc7a3 shRNA (E) and subjected to complete or glutamine-free medium for 6 h (F–G). Metabolite was extracted for LC-MS analysis of relative (F) arginine, (G) lysine, and ornithine levels.
Data represent mean ± SD and n = 3 independent experiments. *p < 0.05, **p < 0.01, ***p < 0.005 were calculated by unpaired two-tailed Student’s t test. See also Figure S3 and Table S1.
Increased Arginine Does Not Contribute to TCA Cycle upon Glutamine Deprivation
Human and mouse studies have shown glutamine enriches plasma arginine concentrations in healthy populations (Ligthart-Melis et al., 2008; Morris, 2016). Glutamine supplies carbon and nitrogen for de novo protein synthesis of arginine (Tomlinson et al., 2011a). We hypothesized that arginine compensated for the loss of glutamine as a source of carbon in intermediates of glutamine catabolism, such as the TCA cycle. We used 13C6-L-arginine-HCl to trace arginine metabolism in MEF WT cells cultured in complete or glutamine-free medium overnight (Figure 4A). We measured pertinent metabolites, such as ornithine, which is the first catabolic step in arginine metabolism. We observed an increase in the contribution of labeled arginine to ornithine in glutamine-deprived cells, yet overall levels did not significantly differ (Figure 4B). Encouraged by the modest increase of labeled carbon in ornithine pools, we checked downstream polyamine metabolites (i.e., putrescine and spermidine) and were unable to consistently or accurately measure labeled carbon. However, in an unlabeled metabolite analysis, we noted that putrescine increased upon glutamine deprivation but was not p53 dependent (Figure S3C). Furthermore, unlabeled spermidine levels were unchanged between conditions, suggesting these levels were not heavily impacted by glutamine deprivation (Figure S3D). Proline, another downstream metabolite of ornithine, is a precursor to arginine synthesis (Tomlinson et al., 2011b). We observed a drastic decrease in proline levels in response to glutamine withdrawal, supporting glutamine’s contribution to its intracellular pools (Figure 4C). However, we did not detect significant incorporation of labeled arginine in either condition, suggesting arginine does not supply carbon to proline. Indeed, most metabolites, including the TCA intermediate and urea cycle byproduct fumarate, did not exhibit substantial integration of carbon from arginine in either condition (Figure 4D). Furthermore, and contrary to our hypothesis, TCA cycle intermediates, specifically glutamate, α-ketoglutarate, citrate, malate, and succinate displayed little trace of labeled arginine into the total metabolite levels in complete and glutamine-free conditions (Figure 4E). As expected, TCA cycle metabolite levels dropped in glutamine-starved cells, underscoring the role of glutamine in supplying TCA intermediates. Taken together, we conclude that arginine is not a major carbon source for TCA anaplerosis when glutamine is withdrawn.
Figure 4. Increased Arginine Does Not Contribute to the TCA Cycle upon Glutamine Deprivation.

(A) Schematic of arginine metabolism and its putative carbon contribution (outlined in red) to TCA cycle intermediates.
(B–E) Percentage of labeled arginine (13C6-L-Arg-HCl, red) to total metabolite level (unlabeled, gray) for (B) ornithine, (C) proline, (D) fumarate, and (E) TCA cycle metabolites in MEF WT cells cultured in complete or glutamine-free medium overnight (α-KG, alpha-ketoglutarate).
Data represent mean ± SD of triplicate samples. No statistical difference to report of labeled metabolite between conditions.
mTORC1 Activation Is Sustained by p53 and Slc7a3 upon Glutamine Deprivation
Because we excluded arginine as a carbon source during glutamine starvation, we investigated its role as a signaling factor for mTORC1 activation upon nutrient stress. Arginine is a potent stimulator of the mTORC1 signaling pathway (Ban et al., 2004; Chantranupong et al., 2016; Wang et al., 2015). We first addressed the effect of p53 on mTORC1 signaling during glutamine deprivation by immunoblotting for phospho-S6K (threonine and p53 by using inducible p53 osteosarcoma cells deprived of glutamine. Interestingly, we noticed that despite a lessening of S6K’s phosphorylation upon glutamine starvation, the phosphorylation was sustained longer in p53-expressing cell lines (Figure 5A). To better understand mTORC1 activation, we deprived transformed MEF cells of glutamine and arginine, which ablated mTORC1 signaling (Figure 5B). We found that addback of arginine in glutamine-deprived cells was enough to induce S6K phosphorylation, whereas addback of glutamine in the absence of arginine failed to activate S6K (Figure 5B). Next, we knocked down Slc7a3 with shRNA to determine the effect on S6K phosphorylation in RAS-transformed MEF (Figure 5C) and SaOs-2 (Figure 5E) cells. The loss of Slc7a3 blunted mTORC1 activation from L-arginine, which did not occur in empty-vector control cells (Figures 5D and 5F), suggesting a major role for Slc7a3 in maintaining mTORC1 activation. Altogether, these data reveal p53 may prolong mTORC1 signaling as glutamine levels decline by induction of Slc7a3.
Figure 5. mTORC1 Activation Is Sustained by p53 and Slc7a3 upon Glutamine Deprivation.

(A) Immunoblot of phospho-S6K (T389), total S6K, total p53, and actin in SaOs-2 cells cultured in the absence or presence of doxycycline for 24 h and then separated into complete and glutamine-free medium for 3-h increments.
(B) Immunoblot of E1A-RAS transformed MEFs deprived of glutamine and arginine overnight. L-glutamine (2 mM), L-arginine (0.4 mM), or both were added back for 15 minutes prior to lysate extraction for western blot analysis of phospho-S6K (T389), total S6K, and actin.
(C) Slc7a3 mRNA expression of E1A-RAS transformed MEF cells transfected with empty vector (EV) or Slc7a3 shRNA.
(D) Immunoblot of E1A-RAS-transformed cells expressing EV or shSlc7a3 deprived of glutamine and arginine for 2 h, followed by a 15-minute incubation with L-glutamine or L-arginine-HCl. Lysate was extracted for western blot analysis of phospho-S6K (T389), total S6K, and actin.
(E) SLC7A3 mRNA expression of SaOs-2 cells transfected with EV or SLC7A3 shRNA.
(F) Immunoblot of phospho-S6K (T389), total S6K, total p53, and actin in SaOs-2 EV and shSLC7A3 cells cultured in the absence or presence of doxycycline for 24 h and then separated into complete and glutamine-free medium for 3 h.
qRT-PCR data represent mean ± SD and n = 3 independent experiments. Statistical significance, ***p < 0.005, was assigned using unpaired two-tailed Student’s t test.
Slc7a3 Is Required for Tumor Growth In Vivo
We have previously shown there are regional nutrient differences within solid tumors, of which the periphery is well-perfused, and the core is depleted of major nutrients, including glutamine (Pan et al., 2016). We checked Slc7a3 expression in the core and periphery of E1A-RAS xenograft tumors and observed an increase in the core region (Figure 6A). Given mTORC1’s established role in cell growth and proliferation, we investigated the viability and proliferation of transformed MEF cells in which Slc7a3 is knocked down in complete and low-glutamine medium. We detected no significant difference in the rate of cell death in cells cultured without glutamine (not shown) or low glutamine (0.1 mM) medium over 72 h (Figure 6B). However, Slc7a3 knockdown cells grew more slowly than control cells when grown in complete medium over time (Figure 6C). When we counted cells cultured in glutamine-free medium, we observed a linear increase in cell numbers of control cells, after the first 24 h of glutamine deprivation (Figure 6D). In contrast, Slc7a3 knockdown cells were cytostatic at 24 h. The transient increase in the cell number of control cells, despite the depletion of glutamine, suggests an intact proliferative pathway during that period. To demonstrate this in vivo, we injected transformed cells expressing shSlc7a3 and empty vector (EV) into nude mice and measured tumor growth over time. The knockdown Slc7a3 xenograft tumors grew at a significantly slower rate and weighed less than the control tumors (Figures 6E, 6F, and 6G). We extracted RNA from the tumors to check Slc7a3 expression and confirmed its knock down was maintained (Figure 6H). Lastly, we checked the signaling activity of mTORC1 by extracting protein lysate and immunoprecipitated with antibody against S6K. As expected, downstream mTORC1 signaling, as read by phosphorylation of S6K, was active in control cell lines but not in transformed cells knocked down for Slc7a3 (Figure 6I). Overall, these data strongly suggest Slc7a3 enhances tumor growth.
Figure 6. Slc7a3 Is Required for Tumor Growth In Vivo.

(A) Relative Slc7a3 mRNA expression in the periphery and core of E1A-RAS xenograft tumors, n = 2.
(B) Viability of E1A-RAS transformed MEF cells transfected with EV or shSlc7a3 cultured in low-glutamine medium (0.1 mM) over 72 h.
(C and D) Cell proliferation of E1A-RAS-transformed MEF cells transfected with EV or shSlc7a3 cultured in (C) complete DMEM over 72 h or (D) glutamine-free DMEM for 24 h.
(E) Xenograft tumors were established using E1A-RAS-transformed MEF cells stably expressing EV or shSlc7a3. Tumor size was measured overtime, n = 4.
(F) Picture comparison of isolated xenograft tumors, n = 4.
(G) Tumor weight of extracted E1A-RAS xenograft tumors from (F).
(H) Slc7a3 mRNA expression of E1A-RAS xenograft tumors, n = 4.
(I) Immunoblot of immunoprecipitated S6K from lysate extracted from E1A-RAS xenograft tumors, n = 3.
Data represent mean ± SD and n = 2–4 independent experiments for in vivo data and n = 3 for all in vitro data. Statistical significance, *p < 0.05, **p < 0.01, ***p < 0.005, was assigned by unpaired two-tailed Student’s t test.
DISCUSSION
Tumors are comprised of well-nourished and nutrient-depleted regions. Although poor vasculature significantly contributes to the differences detected in nutrient levels as tumors grow, oncogenic transformation initially plays a major role in rewiring metabolic networks to promote growth and proliferation. Increased metabolic demand by oncogenes, such as RAS, results in cellular stress caused by the depletion of non-essential amino acids, such as glutamine (Nagarajan et al., 2016). Here, we describe a cellular adaptation mediated by the transcription factor p53 in response to glutamine deprivation. We show transcriptional induction of Slc7a3, a gene that encodes for arginine transport, in WT p53 MEF cells when glutamine levels are impaired and is consistent with an increase in intracellular arginine levels. More importantly, we show in transformed cells, Slc7a3 promotes tumor growth by increasing intracellular arginine to maintain mTORC1 activation.
The sensitivity of p53 to cellular stress signals make it a powerful tumor suppressor. Our transcriptional analysis of p53-responsive genes to glutamine starvation surprisingly identified the cationic transporter Slc7a3 as an inducible gene. Slc7a3 was first identified in rat brain tissue (Hosokawa et al., 1997). Interestingly, the stimuli-specific induction of Slc7a3 to metabolic stress is further strengthened by studies carried out in zebrafish. Initially, slc7a3-null embryos exhibit delayed growth but, given time, grow to an equal size and weight as slc7a3-expressing zebrafish. An overt phenotype appeared only when slc7a3-null zebrafish were fasted and lipids began to accumulate in the liver, suggesting slc7a3 played a role in lipid metabolism during nutrient stress (Gu et al., 2014). The authors revealed a novel signaling pathway in which slc7a3 expression stimulated fatty acid oxidation in starved conditions. We show Slc7a3 is induced early by glutamine deprivation to ultimately promote cell growth through the maintenance of mTORC1 caused by arginine influx. Additionally, we find that the early transcriptional effect by p53 is consistent with a coordinated pro-survival response resulting from metabolic stress. Interestingly, we noticed that glutamine regulation of mTORC1 activity is especially dependent on arginine uptake in p53-expressing cells (Figure 5F). Prolonged metabolic stress leads to cell death and is heavily regulated by ATF4, which coordinates cell death pathways when nutrients become limited (Lopez et al., 2007; Ou et al., 2015; Qing et al., 2012). Interestingly, our results show that ATF4 is required for Slc7a3 expression upon glutamine starvation. Moreover, other known p53-targeted genes that relate to survival upon glutamine deprivation are also ATF4-dependent upon glutamine deprivation. Our findings help clarify why other p53 stimuli (e.g., genotoxic inducers) failed to induce Slc7a3. These data suggest that the ATF4 pathway is critical upon glutamine deprivation and might cooperate with p53 to induce gene expression, including Slc7a3.
Similar to glutamine, arginine is severely depleted within tumor core regions (Pan et al., 2016). The increased uptake we observe and the dramatic decrease of arginine in cancer point to a multifaceted role of the amino acid in early stages of metabolic stress, possibly by setting the stage for survival and growth pathways. In renal cell carcinoma, low arginine levels caused by deletion of the enzyme arginase 2 result in reduced polyamine levels, thereby promoting cell survival because renal cells are sensitive to polyamine accumulation (Ochocki et al., 2018). In prostate cancers, mTORC1 signaling tightly regulates the synthesis of polyamines (Zabala-Letona et al., 2017). In contrast, we find that upon glutamine deprivation, arginine catabolism does not support the TCA cycle nor polyamine metabolite pools, suggesting arginine metabolism appears to be cell-type specific.
Crosstalk between p53 and mTORC1 have been extensively investigated and shown to be active counter to each other. The mTOR complexes are at the helm of conserved signaling pathways for amino acid sensing. As a serine and threonine kinase, it activates a signaling cascade that promotes cell growth when nutrients, growth factors, and oxygen are present. In cancer, mTOR signaling pathways are often deregulated and promote tumor growth (Moschetta et al., 2014). We, and others, report that the mTORC1 signaling pathway remains temporarily active despite glutamine withdrawal or low amino acid levels in normal and transformed fibroblasts (Guenther et al., 2014; Ye et al., 2015). Interestingly, we and others show that metabolic-stress-induced p53 activation usually promotes growth arrest by inducing p21 transcription. Here, we report that glutamine deprivation leads to increased Slc7a3 expression that coincides with changes in arginine uptake and mTORC1 activation. mTORC1 is an important regulator of cell growth and proliferation, whereas p53 promotes cell cycle arrest, which raises the question whether mTOR signaling and p53 activation counteract one another in regulating cell proliferation. Our data show that the induction of p53 only sustained the basal level of mTOR activity up to 6 h and this basal level mTOR activation may not be sufficient to promote cell proliferation, as it probably only plays a role to maintain basic cell survival because mTOR is a master regulator of many essential cellular functions, such as translation and metabolism. This is shown in MEFs deleted of the mTORC1 negative regulator TSC2, in which upregulation of the nutrient transporter 4F2hc is driven by mTORC1 signaling to promote adaptation to metabolic stress (Guenther et al., 2014). In contrast to the beneficial link we observe between p53 and mTORC1 upon emerging metabolic stress, DNA-damage-induced p53 activation leads to inhibition of mTOR activity in normal cells (Feng et al., 2005). Our results suggest the impact of p53 in regulating mTORC1 activity is stimuli specific.
Altogether, this work describes a signaling mechanism resulting from glutamine deprivation that integrates major energy sensors that are mutated in many cancers. We identify a p53-inducible gene that uptakes arginine in response to glutamine withdrawal to maintain the growth-promoting and proliferative capacity of mTORC1.
STAR★METHODS
CONTACT FOR REAGENT AND RESOURCE SHARING
Further information and requests for resources and reagents should be directed and will be fulfilled by the Lead Contact, Mei Kong (meik1@uci.edu).
EXPERIMENTAL MODEL AND SUBJECT DETAILS
Cell culture
MEF WT p53+/+, MEF p53−/−, SaOs2-tetracycline inducible p53, E1A-RAS transformed MEFs, HT1080, EB3, 293T, CA46, SupT1, MiaPaca2, and 249P cells were initially cultured in Dulbecco’s modified Eagle’s medium (DMEM, Corning, New York, NY, USA) which contained 25 mM glucose and 4 mM L-glutamine. DMEM was supplemented with 10% dialyzed fetal bovine serum (dFBS, Gemini Bio-Products, Sacramento, CA, USA) and 100 units/mL penicillin and 100 μg/mL streptomycin (P/S, Genesee Scientific). All cells were cultured at 37° C with 5% CO2. SaOs2 cells engineered to induce WT p53 upon tetracycline were generously provided by Karen Vousden (Francis Crick Institute, London, England) (Bensaad et al., 2006). Doxycycline (1 μg/mL) was added to DMEM 24 hours prior to glutamine deprivation studies to ensure p53 expression. BPTES (used at 10 μM) and camptothecin (CPT, used at 2 μM) was purchased from Sigma-Aldrich (St Louis, MO, USA). Doxorubicin was purchased from Selleckchem (Houston, TX, USA). Cell viability and proliferation was measured by exclusion of Trypan blue dye (Sigma) and determined by cell counting.
Mouse xenografts
All studies involving animals were performed according to approved IACUC protocols at the City of Hope Cancer Center. 2 × 10⁶ MEF E1A-RAS cells stably expressing empty vector or shSlc7a3 were injected into the right flank of randomly assigned CrTac:Ncr-Foxn1nu (Taconic) mice. Tumors were established subcutaneously in 8–12 wk-old male mice. Tumor growth was measured over time using the formula ½ (length × width2).
METHOD DETAILS
Nutrient starvation
For glutamine-deprivation experiments, standard DMEM was removed and cells were washed once with phosphate-buffered saline. Glutamine-free and complete medium were made with DMEM devoid of glutamine, arginine, and lysine (ThermoFisher Scientific, A14431) and retained the same nutrient concentrations as standard DMEM. L-Lysine hydrochloride (Sigma L8662) was added to the medium for a final concentration of 0.8 mM. Complete DMEM was made by supplementing with 2 mM L-Glutamine (Omega Scientific 61015) and 0.5 mM L-Arginine monohydrochloride (Sigma A6969). Glutamine-free DMEM was made with the addition of 0.5 mM L-Arginine monohydrochloride. Arginine-free DMEM was made with the addition of 2 mM L-Glutamine and 0.8 mM L-Lysine. Lysine-free DMEM was made with the addition of 2 mM L-Glutamine and 0.5 mM L-Arginine. All media was supplemented with 10% dFBS (Gemini Bio-Products, Sacramento, CA, USA) and P/S.
RNA seq
Deep sequencing of mRNA was performed with the Illumina Hiseq2500. Libraries were prepared with TruSeq RNA Sample Preparation Kit V2 (Illumina). 500 ng of total RNA from each sample was used for polyadenylated RNA enrichment with oligo dT magnetic beads and fragmented with divalent cations under elevated temperature. First-strand cDNA synthesis was generated from the fragmented RNA by reverse transcription to produce single-stranded DNA copies. Following second-strand cDNA synthesis, double-stranded DNA underwent end repair and the 3′ ends adenylated. Universal adapters were ligated to the cDNA fragments and 10 cycles of PCR were performed for the final sequencing library. Library templates were prepared for sequencing using the cBot cluster generation system (Illumina) with TruSeq SR Cluster V3 Kit. Sequencing was performed in single-read mode using the Illumina HiSeq 2500 platform with TruSeq SBS V3 Kits. Real-time analysis software was used to process the image analysis and base calling.
Unlabeled metabolite profiling
MEF cells (p53+/+) and (p53−/−), were seeded overnight in 6 cm plates at concentrations between 2–4×10⁵ in standard DMEM (Corning) medium supplemented with dFBS and P/S overnight. The following day, medium was aspirated and replaced with complete or glutamine-free DMEM as described above. Cells were cultured for six hours prior to metabolite extraction using ice cold methanol and measured by LC-HR-MS as described previously (Liu et al., 2015). An extra plate, in addition to the triplicate plated, was used to count the number of cells at the time of extraction for normalization of metabolite levels.
L-arginine metabolite tracing
2×10⁵ MEF WT cells were seeded in 6 cm plates and cultured in standard DMEM overnight. Media was removed and washed once with glutamine, arginine-free medium. DMEM supplemented with 10% dFBS, P/S, and 0.5 mM L-13C6Arg-HCl (Sigma) was used either with the addition of 2 mM L-glutamine (complete) or without (glutamine-free). Following 16 hours of incubation, cells were harvested and the metabolites extracted with ice cold methanol and measured by LC-HR-MS as described previously (Liu et al., 2015).
L-arginine uptake
MEF WT and p53−/− cells were cultured in glutamine-free medium for 3, 2, 1, and 0 hours (starting medium concentration of L-arginine at 0.5 mM) in six-well plates. We used the L-arginine assay kit (Biovision, Cat no. K749–100) to generate a standard curve with L-arginine. After pre-treating the cell media sample with ‘‘cleanup mix,’’ 100 μL of media was taken up and centrifuged at 13,000 ×g for 10 min at 4° C. 40 μL of resulting sample was used for the assay. Following completion of the kit’s protocol, absorbance (OD 450) was taken on a plate reader. L-arginine was calculated by the given kit formula. L-arginine uptake was determined by subtracting 1, 2, and 3 hours from the 0 hour time point.
Western blotting
Cells were washed two times with PBS and lysed in ice-cold RIPA buffer (1% sodium deoxycholate, 0.1% SDS, 1% Triton X-100, 10 mM Tris [pH 8.0], and 150 mM NaCl) supplemented with protease inhibitor (Roche, Indianapolis, IN, USA). Similar amounts of protein were (10–20 mg) loaded on precast mini-PROTEAN TGX (Biorad) gels and followed by transfer to nitrocellulose (Biorad) membrane. Immunoblotting was performed with the following antibodies: p53, rodent (CM5) was purchased from VECTOR Laboratories, Burlingame, CA, USA; p53, human (DO-1, SC126) and CAT-3, mouse (T-14, sc161433) were purchased from Santa Cruz Biotechnology, Santa Cruz, CA, USA; phospho-p53 (Ser15, #9284), p53 rodent specific (D2H90, #32532), phospho-p70S6K (Thr389, #9234), p70S6K (#2708) and ATF4 (D4B8, #11815) were purchased from Cell Signaling Technology, Danvers, MA, USA, and beta actin (A1978) from Sigma-Aldrich, St. Louis, MO, USA.
shRNA knockdown
Murine Slc7a3 shRNA constructs (TRCN0000079385 and TRCN0000079386) and human SLC7A3 shRNA constructs (TRCN0000043151 and TRCN0000043152) were purchased from GE Dharmacon (Lafayette, CO, USA). 293T cells were co-transfected with pLKO.1 empty vector or Slc7a3 shRNA vector, pMDL, pCMV-VSV-G and pRSV-Rev at a ratio of 4:2:1:1. Following the transfection, lentiviral particles were collected from the medium of 293T cells at day 2 and day 3. The medium was pelleted, and the supernatant filtered before infecting MEF or RAS-transformed MEF cells (murine Slc7a3) or SaOs-2 cells (human SLC7A3). Cells were selected with 0.2 μg/ml puromycin. Bulk shSlc7a3 cells were then used in a limiting dilution assay to select clones for maximal knockdown.
siRNA knockdown of Atf4
MEF WT and p53−/− cells were knocked down of Atf4 by transfecting cells with siRNA against mouse ATF4 (ON-TARGETplus SMARTpool, L-042737–01-0005, Dharmacon) or control siRNA (ON-TARGET SMARTpool Control siRNA, D-001810–10-20, Dharmacon) using Lipofectamine RNAiMAX (Invitrogen) according to the manufacturer’s protocol.
Real-time reverse transcription PCR
RNA extractions were performed using Trizol (Invitrogen, Carlsbad, CA, USA) according to the manufacturer’s guidelines. RNA (1 μg) was used for each complementary DNA synthesis reaction (Quanta Biosciences, Beverly, MA, USA). Quantitative real-time reverse transcription PCR reactions were performed with SYBR Green PCR reagents (Quanta Biosciences) using an iQ5 thermal cycler (Bio-Rad). The cycle threshold values of the target genes were normalized to cycle threshold values of actin or 18S. Forward and reverse primers were generated to check gene expression. See Table S2 for primer sequences.
Chromatin immunoprecipitation assay
Cells were cultured in complete medium or glutamine-free medium overnight then cross-linked with 1% formaldehyde for 10 min at room temperature. Cells were washed three times with PBS and lysed in ice-cold lysis buffer with protease inhibitors on ice for 5 min. Samples were sonicated to yield 200–1000 bp DNA fragments. After centrifugation, cell supernatant was diluted in immunoprecipitation buffer with protease inhibitors. One microgram of p53 (DO-1, Santa Cruz Biotechnology) or anti-mouse IgG antibody was immunoprecipitated with SaOs2 sonicated DNA overnight; whereas, one microgram of p53 (CM5) or anti-rabbit IgG antibody was immunoprecipitated with MEF WT sonicated DNA overnight. Chromatin DNA was obtained following the ChIP Assay Kit protocol (Millipore, 17–295). Binding sites of p53 were amplified by 30–35 cycles of PCR using Hotstart Taq DNA polymerase (Bioneer). The PCR products were detected using agarose gel electrophoresis. See Table S2 for human and mouse PCR primers used for ChIP readout.
QUANTIFICATION AND STATISTICAL ANALYSIS
All results are shown as means and error bars represent the standard deviation. The unpaired Student’s t test was used to determine the statistical significance using Excel. Asterisks denote the following significance, *p < 0.05, **p < 0.01 and ***p < 0.005. Details regarding sample size and independent runs are described in main and supplementary figure legends.
Supplementary Material
KEY RESOURCES TABLE
| REAGENT or RESOURCE | SOURCE | IDENTIFIER |
|---|---|---|
| Antibodies | ||
| p53 Protein (CM5) Ab | Vector Laboratories | Cat# VP-P956; RRID:AB_2335917 |
| p53 (DO-1) Ab | Santa Cruz Biotechnology | Cat# sc-126; RRID:AB_628082 |
| Phospho-p53 (Ser15) Ab | Cell Signaling Technology | Cat# 9284; RRID:AB_331464 |
| CAT-3 (T-14) Ab | Santa Cruz Biotechnology | Cat# sc-161433; RRID:AB_10916704 |
| ATF4-human Ab | Cell Signaling Technology | Cat# 11815; RRID:AB_2616025 |
| Phospho-p70 S6 Kinase (Thr389) (108D2) Rabbit mAb | Cell Signaling Technology | Cat# 9234; RRID:AB_2269803 |
| antibody | ||
| Rabbit Anti-p70 S6 Kinase mAb | Cell Signaling Technology | Cat# 2708; RRID:AB_390722 |
| p53 rodent (D2H90) Ab | Cell Signaling Technology | Cat# 32532; RRID:AB_2757821 |
| Mouse Anti-beta-Actin Monoclonal Ab (Clone AC-15) | Sigma Aldrich | Cat# A1978; RRID:AB_476692 |
| Murine IgG Control Ab, unconjugated | Sigma Aldrich | Cat# I5381; RRID:AB_1163670 |
| Rabbit IgG Control Ab, unconjugated | Sigma Aldrich | Cat#I5006; RRID:AB_1163659 |
| Goat Anti-Mouse IgG (H L)-HRP Conjugate Ab | Bio-Rad/ AbD Serotec | Cat# 170–6516; RRID:AB_11125547 |
| Goat Anti-Rabbit IgG (H L)-HRP Conjugate Ab | Bio-Rad/ AbD Serotec | Cat# 170–6515; RRID:AB_11125142 |
| Donkey anti-goat IgG-HRP Ab | Santa Cruz Biotechnology | Cat# sc-2020; RRID:AB_631728 |
| Bacterial and Virus Strains | ||
| pMDL | This paper and Pan et al., (2016) | Addgene plasmid 12251 |
| pCMV-VSV-G | This paper and Pan et al., (2016) | Addgene plasmid 12259 |
| pRSV-Rev | This paper and Pan et al., (2016) | Addgene plasmid 12253 |
| Chemicals, Peptides, and Recombinant Proteins | ||
| DMEM Glutamine, Arginine, Lysine-free | Life Technologies | Cat# A14431 |
| L-lysine hydrochloride | Sigma Aldrich | Cat# L8662 |
| L-glutamine | Omega Scientific | Cat# 61015 |
| L-arginine monohydrochloride | Sigma Aldrich | Cat # A6969 |
| Penicillin/streptomycin | Genesee Scientific | Cat# 25–512 |
| Dialyzed fetal bovine serum | Gemini-Bio products | Cat# 100–108 |
| Doxycycline | Clontech | Cat# 631311 |
| BPTES | Sigma Aldrich | Cat# SML0601 |
| Camptothecin | Sigma Aldrich | Cat# C-9911 |
| Doxorubicin | Selleckchem | Cat# S1208 |
| L13-C6 Arg-HCl | Sigma Aldrich | Cat# 643440 |
| Protease inhibitor | Roche | Cat# 04693159001 |
| Trypan blue dye | Sigma Aldrich | Cat# T8154 |
| Trizol | Invitrogen | Cat# 15596018 |
| Lipofectamine RNAiMAX | Invitrogen | P/N 56532 |
| Puromycin dihydrochloride | Sigma Aldrich | P9620 |
| Polybrene (Hexadimethrine bromide) | Sigma Aldrich | H9268 |
| Chloroform | Alfa Aesar | L14759 |
| 16% Formaldehyde | ThermoFisher Scientific | 28908 |
| Critical Commercial Assays | ||
| L-arginine assay kit | Biovision | Cat# K749–100 |
| qScript cDNA synthesis kit | Quanta Biosciences | Cat#95047–100 |
| PerfeCTa® SYBR® Green Fastmix® for iQ | Quanta Biosciences | P/N 84067 |
| Hotstart Taq DNA polymerase | Bioneer | Cat# E-2017 |
| ChIP Assay Kit | Millipore | Cat# 17–295 |
| Deposited Data | ||
| RNA-seq data | This paper | GEO: GSE125782 |
| Experimental Models: Cell Lines | ||
| MEF-1 [Mouse fibroblast] cell line | ATCC | Cat# CRL-2214; RRID: CVCL_4240 |
| HEK293T cell line | ATCC | Cat# CRL-3216; RRID: CVCL_0063 |
| HT-1080 cell line | ATCC | Cat# CCL-121, RRID: CVCL_0317 |
| EB3 [Human Burkitt lymphoma] cell line | ATCC | Cat# CCL-85; RRID:CVCL_1185 |
| CA46 cell line | ATCC | Cat# CCL-1648, RRID: CVCL_1101 |
| SUP-T1 cell line | ATCC | Cat# CRL-1942, RRID:CVCL_1714 |
| MIA PaCa-2 cell line | ATCC | Cat# CRL-1420, RRID:CVCL_0428 |
| M249 cell line | Provided by Roger S. Lo (UCLA) | Pan et al., 2016 |
| E1A-RAS transformed MEF-1 | Generated in our lab | Pan et al., 2016 |
| SaOS-2 tetracycline inducible for p53 | Provided by Karen Vousden | Bensaad et al., 2006 |
| Experimental Models: Organisms/Strains | ||
| CrTac: Ncr-Foxn1nu athymic male mice | Taconic | Cat# NCRNU Oligonucleotides |
| Oligonucleotides | ||
| siRNA targeting murine Atf4 | GE Dharmacon | L-042737–01-0005 |
| siRNA control | GE Dharmacon | D-001810–10-20 |
| Murine Slc7a3 shRNA | GE Dharmacon | TRCN0000079385; TRCN0000079386 |
| Human Slc7a3 shRNA | GE Dharmacon | TRCN0000043151; TRCN0000043152 |
| Primers for qRT-PCR and ChIP, see Table S2 | This study and Tran et al., 2017 | N/A |
| Recombinant DNA | ||
| pLKO.1 scramble shRNA | This paper and Reid et al., 2013 | Addgene plasmid 1864 |
Highlights.
Glutamine deprivation induces Slc7a3 in a p53-dependent manner
Intracellular arginine increases upon glutamine deprivation in a p53-dependent manner
Slc7a3 expression contributes to mTORC1 activation during glutamine depletion
Knock down of Slc7a3 expression results in delayed xenograft tumor growth
ACKNOWLEDGMENTS
We thank members of the Kong laboratory for helpful comments on the manuscript. We especially thank Dr. Jason Locasale (Duke University, North Carolina) for metabolite analysis. This work was supported by NIH R01CA183989 to M.K. X.H.L. and E.A.H. are supported by NIH NCI T32 CA009054. M.K. is the Pew Scholar in Biomedical Sciences and American Cancer Society Research Scholar (RSG-16–085-01-TBE). Research reported here includes work carried out in Core Facilities, supported by the NIH-NCI under grant numbers P30CA062203 and P30CA33572.
Footnotes
DECLARATION OF INTERESTS
The authors declare no competing interests.
DATA AND SOFTWARE AVAILABILITY
RNA sequencing data is deposited with the dataset ID, GEO: GSE125782.
SUPPLEMENTAL INFORMATION
Supplemental Information can be found with this article online at https://doi.org/10.1016/j.celrep.2019.02.037.
REFERENCES
- Assaily W, Rubinger DA, Wheaton K, Lin Y, Ma W, Xuan W, Brown-Endres L, Tsuchihara K, Mak TW, and Benchimol S (2011). ROS-mediated p53 induction of Lpin1 regulates fatty acid oxidation in response to nutritional stress. Mol. Cell 44, 491–501. [DOI] [PubMed] [Google Scholar]
- Ban H, Shigemitsu K, Yamatsuji T, Haisa M, Nakajo T, Takaoka M, Nobuhisa T, Gunduz M, Tanaka N, and Naomoto Y (2004). Arginine and Leucine regulate p70 S6 kinase and 4E-BP1 in intestinal epithelial cells. Int. J. Mol. Med 13, 537–543. [PubMed] [Google Scholar]
- Bensaad K, Tsuruta A, Selak MA, Vidal MN, Nakano K, Bartrons R, Gottlieb E, and Vousden KH (2006). TIGAR, a p53-inducible regulator of glycolysis and apoptosis. Cell 126, 107–120. [DOI] [PubMed] [Google Scholar]
- Berkers CR, Maddocks OD, Cheung EC, Mor I, and Vousden KH (2013). Metabolic regulation by p53 family members. Cell Metab 18, 617–633. [DOI] [PMC free article] [PubMed] [Google Scholar]
- Chantranupong L, Scaria SM, Saxton RA, Gygi MP, Shen K, Wyant GA, Wang T, Harper JW, Gygi SP, and Sabatini DM (2016). The CASTOR Proteins Are Arginine Sensors for the mTORC1 Pathway. Cell 165, 153–164. [DOI] [PMC free article] [PubMed] [Google Scholar]
- Feng Z, Zhang H, Levine AJ, and Jin S (2005). The coordinate regulation of the p53 and mTOR pathways in cells. Proc. Natl. Acad. Sci. USA 102, 8204–8209. [DOI] [PMC free article] [PubMed] [Google Scholar]
- Gaglio D, Soldati C, Vanoni M, Alberghina L, and Chiaradonna F (2009). Glutamine deprivation induces abortive s-phase rescued by deoxyribonucleotides in k-ras transformed fibroblasts. PLoS One 4, e4715. [DOI] [PMC free article] [PubMed] [Google Scholar]
- Gao P, Tchernyshyov I, Chang TC, Lee YS, Kita K, Ochi T, Zeller KI, De Marzo AM, Van Eyk JE, Mendell JT, and Dang CV (2009). c-Myc suppression of miR-23a/b enhances mitochondrial glutaminase expression and glutamine metabolism. Nature 458, 762–765. [DOI] [PMC free article] [PubMed] [Google Scholar]
- Gu Q, Yang X, Lin L, Li S, Li Q, Zhong S, Peng J, and Cui Z (2014). Genetic ablation of solute carrier family 7a3a leads to hepatic steatosis in zebrafish during fasting. Hepatology 60, 1929–1941. [DOI] [PubMed] [Google Scholar]
- Guenther GG, Liu G, Ramirez MU, McMonigle RJ, Kim SM, McCracken AN, Joo Y, Ushach I, Nguyen NL, and Edinger AL (2014). Loss of TSC2 confers resistance to ceramide and nutrient deprivation. Oncogene 33, 1776–1787. [DOI] [PMC free article] [PubMed] [Google Scholar]
- Han J, Back SH, Hur J, Lin YH, Gildersleeve R, Shan J, Yuan CL, Krokowski D, Wang S, Hatzoglou M, et al. (2013). ER-stress-induced transcriptional regulation increases protein synthesis leading to cell death. Nat. Cell Biol 15, 481–490. [DOI] [PMC free article] [PubMed] [Google Scholar]
- Hosokawa H, Sawamura T, Kobayashi S, Ninomiya H, Miwa S, and Masaki T (1997). Cloning and characterization of a brain-specific cationic amino acid transporter. J. Biol. Chem 272, 8717–8722. [DOI] [PubMed] [Google Scholar]
- Itahana Y, and Itahana K (2018). Emerging Roles of p53 Family Members in Glucose Metabolism. Int. J. Mol. Sci 19, E776. [DOI] [PMC free article] [PubMed] [Google Scholar]
- Kastenhuber ER, and Lowe SW (2017). Putting p53 in Context. Cell 170, 1062–1078. [DOI] [PMC free article] [PubMed] [Google Scholar]
- Krall AS, Xu S, Graeber TG, Braas D, and Christofk HR (2016). Asparagine promotes cancer cell proliferation through use as an amino acid exchange factor. Nat. Commun 7, 11457. [DOI] [PMC free article] [PubMed] [Google Scholar]
- Le A, Lane AN, Hamaker M, Bose S, Gouw A, Barbi J, Tsukamoto T, Rojas CJ, Slusher BS, Zhang H, et al. (2012). Glucose-independent glutamine metabolism via TCA cycling for proliferation and survival in B cells. Cell Metab 15, 110–121. [DOI] [PMC free article] [PubMed] [Google Scholar]
- Ligthart-Melis GC, van de Poll MC, Boelens PG, Dejong CH, Deutz NE, and van Leeuwen PA (2008). Glutamine is an important precursor for de novo synthesis of arginine in humans. Am. J. Clin. Nutr 87, 1282–1289. [DOI] [PubMed] [Google Scholar]
- Liu X, Sadhukhan S, Sun S, Wagner GR, Hirschey MD, Qi L, Lin H, and Locasale JW (2015). High-Resolution Metabolomics with Acyl-CoA Profiling Reveals Widespread Remodeling in Response to Diet. Mol. Cell. Proteomics 14, 1489–1500. [DOI] [PMC free article] [PubMed] [Google Scholar]
- Lopez AB, Wang C, Huang CC, Yaman I, Li Y, Chakravarty K, Johnson PF, Chiang CM, Snider MD, Wek RC, and Hatzoglou M (2007). A feedback transcriptional mechanism controls the level of the arginine/lysine transporter cat-1 during amino acid starvation. Biochem. J 402, 163–173. [DOI] [PMC free article] [PubMed] [Google Scholar]
- Maddocks OD, Berkers CR, Mason SM, Zheng L, Blyth K, Gottlieb E, and Vousden KH (2013). Serine starvation induces stress and p53-dependent metabolic remodelling in cancer cells. Nature 493, 542–546. [DOI] [PMC free article] [PubMed] [Google Scholar]
- Morris SM Jr. (2016). Arginine Metabolism Revisited. J. Nutr 146, 2579S–2586S. [DOI] [PubMed] [Google Scholar]
- Moschetta M, Reale A, Marasco C, Vacca A, and Carratù MR (2014). Therapeutic targeting of the mTOR-signalling pathway in cancer: benefits and limitations. Br. J. Pharmacol 171, 3801–3813. [DOI] [PMC free article] [PubMed] [Google Scholar]
- Nagarajan A, Malvi P, and Wajapeyee N (2016). Oncogene-directed alterations in cancer cell metabolism. Trends Cancer 2, 365–377. [DOI] [PMC free article] [PubMed] [Google Scholar]
- Ochocki JD, Khare S, Hess M, Ackerman D, Qiu B, Daisak JI, Worth AJ, Lin N, Lee P, Xie H, et al. (2018). Arginase 2 Suppresses Renal Carcinoma Progression via Biosynthetic Cofactor Pyridoxal Phosphate Depletion and Increased Polyamine Toxicity. Cell Metab 27, 1263–1280.e1266. [DOI] [PMC free article] [PubMed] [Google Scholar]
- Ou Y, Wang SJ, Jiang L, Zheng B, and Gu W (2015). p53 Protein-mediated regulation of phosphoglycerate dehydrogenase (PHGDH) is crucial for the apoptotic response upon serine starvation. J. Biol. Chem 290, 457–466. [DOI] [PMC free article] [PubMed] [Google Scholar]
- Pan M, Reid MA, Lowman XH, Kulkarni RP, Tran TQ, Liu X, Yang Y, Hernandez-Davies JE, Rosales KK, Li H, et al. (2016). Regional glutamine deficiency in tumours promotes dedifferentiation through inhibition of histone demethylation. Nat. Cell Biol 18, 1090–1101. [DOI] [PMC free article] [PubMed] [Google Scholar]
- Pavlova NN, Hui S, Ghergurovich JM, Fan J, Intlekofer AM, White RM, Rabinowitz JD, Thompson CB, and Zhang J (2018). As Extracellular Glutamine Levels Decline, Asparagine Becomes an Essential Amino Acid. Cell Metab 27, 428–438.e425. [DOI] [PMC free article] [PubMed] [Google Scholar]
- Qing G, Li B, Vu A, Skuli N, Walton ZE, Liu X, Mayes PA, Wise DR, Thompson CB, Maris JM, et al. (2012). ATF4 regulates MYC-mediated neuroblastoma cell death upon glutamine deprivation. Cancer Cell 22, 631–644. [DOI] [PMC free article] [PubMed] [Google Scholar]
- Reid MA, Wang WI, Rosales KR, Welliver MX, Pan M, and Kong M (2013). The B55a subunit of PP2A drives a p53-dependent metabolic adaptation to glutamine deprivation. Mol. Cell 50, 200–211. [DOI] [PubMed] [Google Scholar]
- Roberts E, and Frankel S (1949). Free amino acids in normal and neoplastic tissues of mice as studied by paper chromatography. Cancer Res 9, 645–648, 643 pl. [PubMed] [Google Scholar]
- Tomlinson C, Rafii M, Ball RO, and Pencharz P (2011a). Arginine synthesis from enteral glutamine in healthy adults in the fed state. Am. J. Physiol. Endocrinol. Metab 301, E267–E273. [DOI] [PubMed] [Google Scholar]
- Tomlinson C, Rafii M, Ball RO, and Pencharz PB (2011b). Arginine can be synthesized from enteral proline in healthy adult humans. J. Nutr 141, 1432–1436. [DOI] [PubMed] [Google Scholar]
- Tran TQ, Lowman XH, Reid MA, Mendez-Dorantes C, Pan M, Yang Y, and Kong M (2017). Tumor-associated mutant p53 promotes cancer cell survival upon glutamine deprivation through p21 induction. Oncogene 36, 1991–2001. [DOI] [PMC free article] [PubMed] [Google Scholar]
- Wang S, Tsun ZY, Wolfson RL, Shen K, Wyant GA, Plovanich ME, Yuan ED, Jones TD, Chantranupong L, Comb W, et al. (2015). Metabolism. Lysosomal amino acid transporter SLC38A9 signals arginine sufficiency to mTORC1. Science 347, 188–194. [DOI] [PMC free article] [PubMed] [Google Scholar]
- Wise DR, and Thompson CB (2010). Glutamine addiction: a new therapeutic target in cancer. Trends Biochem. Sci 35, 427–433. [DOI] [PMC free article] [PubMed] [Google Scholar]
- Ye J, Palm W, Peng M, King B, Lindsten T, Li MO, Koumenis C, and Thompson CB (2015). GCN2 sustains mTORC1 suppression upon amino acid deprivation by inducing Sestrin2. Genes Dev 29, 2331–2336. [DOI] [PMC free article] [PubMed] [Google Scholar]
- Yuneva MO, Fan TW, Allen TD, Higashi RM, Ferraris DV, Tsukamoto T, Matés JM, Alonso FJ, Wang C, Seo Y, et al. (2012). The metabolic profile of tumors depends on both the responsible genetic lesion and tissue type. Cell Metab 15, 157–170. [DOI] [PMC free article] [PubMed] [Google Scholar]
- Zabala-Letona A, Arruabarrena-Aristorena A, Martıń-Martıń N, Fernandez-Ruiz S, Sutherland JD, Clasquin M, Tomas-Cortazar J, Jimenez J, Torres I, Quang P, et al. (2017). mTORC1-dependent AMD1 regulation sustains polyamine metabolism in prostate cancer. Nature 547, 109–113. [DOI] [PMC free article] [PubMed] [Google Scholar]
- Zhang J, Fan J, Venneti S, Cross JR, Takagi T, Bhinder B, Djaballah H, Kanai M, Cheng EH, Judkins AR, et al. (2014). Asparagine plays a critical role in regulating cellular adaptation to glutamine depletion. Mol. Cell 56, 205–218. [DOI] [PMC free article] [PubMed] [Google Scholar]
- Zhang J, Pavlova NN, and Thompson CB (2017). Cancer cell metabolism: the essential role of the nonessential amino acid, glutamine. EMBO J 36, 1302–1315. [DOI] [PMC free article] [PubMed] [Google Scholar]
Associated Data
This section collects any data citations, data availability statements, or supplementary materials included in this article.