

Abstract
Photodynamic therapy (PDT) is a well-established treatment modality for cancer and other malignant diseases; however, quantities such as light fluence, and PDT dose do not fully account for all of the dynamic interactions between the key components involved. In particular, fluence rate (ϕ) effects are not accounted for, which has a large effect on the oxygen consumption rate. In this preclinical study, reacted reactive oxygen species ([ROS]rx) was investigated as a dosimetric quantity for PDT outcome. We studied the ability of [ROS]rx to predict the cure index (CI) after PDT of murine tumors; CI = 1 - k/kctr, where k and kctr are the growth rate of PDT-treated and control(untreated) tumor, respectively. Mice bearing radiation induced fibrosarcoma (RIF) tumors were treated with BPD-mediated PDT at different in-air fluences (22.5, 40, 45, 50, 70 and 100 J/cm2) and in-air ϕ (75 and 150 mW/cm2) with a BPD dose of 1 mg/kg and a drug-light interval of 15 mins. Treatment was delivered with a collimated laser beam of 1 cm diameter at 690 nm. Explicit dosimetry of initial tissue oxygen concentration, tissue optical properties, and BPD concentration was used to calculate . ϕ was calculated for the treatment volume based on Monte-Carlo simulations and measured tissue optical properties. CI was used as an endpoint for four dose metrics: light fluence, PDT dose, and [ROS]rx. PDT dose was defined as the product of the time-integral of photosensitizer concentration and ϕ at a 3 mm tumor depth. Preliminary studies show that [ROS]rx best correlates with CI and is an effective dosimetric quantity that can predict treatment outcome. The threshold dose for [ROS]rx is determined to be 0.23 mM and is about 4.3 times smaller than the corresponding value for conventional BPD-mediated PDT using DLI of 3 hrs.
Keywords: photodynamic therapy, explicit dosimetry, macroscopic singlet oxygen model, BPD-mediated PDT, reactive oxygen species
1. INTRODUCTION
Photodynamic therapy (PDT) is a used for treatment of cancer and other localized diseases. PDT leads to fewer side effects than radiation and chemotherapy, because it does not involve ionizing radiation and can be well-localized1,2. Widespread use of PDT has been stilted due to the difficulty in accurately quantifying the dose. PDT is not only “dynamic” but also multifaceted3,4. It incorporates light, photosensitizer, and oxygen to create activated singlet oxygen . to kill cells. To address the need for better dosimetry in PDT, we have developed a singlet oxygen explicit dosimetry model to predict PDT outcome5–8. The four major photochemical parameters in a macroscopic singlet oxygen model have been investigated and determined for the photosensitizer benzoporphyrin derivative monoacid A (BPD).
In this study, reactive oxygen species explicit dosimetry (ROSED) was performed using measured values of light fluence rate, photosensitizer concentration and [ROS] to evaluate the treatment outcomes of BPD-mediated vascular PDT in mice bearing radiation-induced fibrosarcoma (RIF) tumors. Vascular-targeted PDT can be achieved using a short (15 minute) drug light interval9. By inducing vascular shutdown, nutrient supply and removal of metabolic waste is halted which results in RIF tumor cell death. This is beneficial because tumor vasculature is easy to access for targeting, and vascular damage is efficient in cancer cell killing and has a low likelihood of leading to drug resistance.
2. MATERIALS AND METHODS
Tumor Model
RIF cells were cultured and 30 μl were injected at 1 × 10⁷ cells/ml intradermally over the right shoulders of 6 to 8 weeks old female C3H mice (NCI-Frederick, Frederick, Maryland), as described previously10–12. Animals were under the care of the University of Pennsylvania Laboratory Animal Resources. All studies were approved by the University of Pennsylvania Institutional Animal Care and Use Committee. Tumors were treated at a size of ~3 to 5 mm in diameter. Fur within the region of tumor inoculation was clipped prior to injection of cells, and the treatment area was depilated with Nair (Church & Dwight Co., Inc., Ewing, New Jersey) at least 24 h before measurements. Mice were provided a chlorophyll-free (alfalfafree) rodent diet (Harlan Laboratories Inc., Indianapolis, Indiana) starting at least 10 days prior to treatment to eliminate the fluorescence signal from chlorophyll-breakdown products, which have a similar emission range to the BPD fluorescence spectra used to determine the concentration of BPD in the tumor. During the delivery of PDT, mice were kept under anesthesia on a heat pad at 38°C.
PDT Treatment Conditions
PDT was delivered using an optical fiber with a microlens attachment coupled to a diode laser. A 690 nm laser (B&W Tek Inc., Newark, Delaware) was used for PDT after a 15 min drug-light interval. The in-air fluence rate (ϕair) is defined as the calculated irradiance determined by the laser power divided by the treatment area (1 cm diameter spot size). The inair fluence was calculated by multiplying the in-air fluence rate by the treatment time. RIF tumor-bearing mice with no photosensitizer and no light excitation were used as controls (n = 5). Treatment conditions are summarized in Table 1.
Table 1:
In-air light fluence, in-air light fluence rate, BPD concentration in tumors, initial tissue oxygenation, PDT dose, as well as calculated reactive oxygen species concentration.
|
Index |
Mice # |
Fluence rate in air (expected) mW/cm2 |
Fluenc e rate (measu red) on surface mW/c m2 |
Fluence rate in tissue (3mm) mW/cm2 |
Total treatment time seconds |
BPD concentration μM |
PDT dose μMJ/cm2 |
[ROS] Rx μM |
k |
CI |
|---|---|---|---|---|---|---|---|---|---|---|
| 1 | #15-4 | 75.00 | 95.70 | 73.62 | 300.00 | 0.23 | 5.10 | 0.07 | 0.41 | 0.01 |
| 2 | #15-5 | 75.00 | 96.90 | 74.54 | 300.00 | 0.22 | 4.97 | 0.06 | 0.41 | 0.01 |
| 3 | #14-3 | 75.00 | 97.20 | 74.77 | 300.00 | 0.20 | 4.43 | 0.03 | 0.42 | 0.00 |
| 4 | #16-4 | 75.00 | 95.00 | 73.08 | 300.00 | 0.13 | 2.77 | 0.04 | 0.41 | 0.01 |
| 5 | #16-5 | 75.00 | 89.00 | 68.46 | 300.00 | 0.22 | 4.58 | 0.14 | 0.40 | 0.03 |
| 6 | #8-1 | 75.00 | 98.00 | 75.38 | 400.00 | 0.19 | 5.70 | 0.20 | 0.34 | 0.18 |
| 7 | #8-2 | 75.00 | 88.00 | 67.69 | 400.00 | 0.29 | 7.85 | 0.32 | 0.00 | 1.00 |
| 8 | #8-3 | 75.00 | 87.00 | 68.15 | 400.00 | 0.25 | 6.82 | 0.22 | 0.20 | 0.51 |
| 9 | #17-5 | 75.00 | 78.00 | 60.00 | 400.00 | 0.17 | 4.08 | 0.17 | 0.38 | 0.07 |
| 10 | #18-1 | 75.00 | 118.00 | 90.77 | 400.00 | 0.24 | 8.71 | 0.29 | 0.03 | 0.93 |
| 11 | #18-2 | 75.00 | 98.00 | 75.38 | 400.00 | 0.15 | 4.52 | 0.11 | 0.42 | 0.00 |
| 12 | #8-4 | 75.00 | 76.00 | 58.46 | 600.00 | 0.25 | 8.70 | 0.22 | 0.19 | 0.54 |
| 13 | #8-5 | 75.00 | 75.00 | 57.69 | 600.00 | 0.31 | 10.69 | 0.41 | 0.00 | 1.00 |
| 14 | #9-1 | 75.00 | 84.00 | 64.62 | 600.00 | 0.19 | 7.37 | 0.20 | 0.29 | 0.30 |
| 15 | #15-1 | 75.00 | 118.00 | 90.77 | 600.00 | 0.20 | 10.91 | 0.28 | 0.06 | 0.85 |
| 16 | #15-2 | 75.00 | 104.00 | 80.00 | 600.00 | 0.14 | 6.54 | 0.20 | 0.31 | 0.25 |
| 17 | #15-3 | 75.00 | 114.00 | 87.69 | 600.00 | 0.23 | 11.91 | 0.47 | 0.00 | 1.00 |
| 18 | #16-1 | 75.00 | 96.00 | 73.85 | 666.00 | 0.16 | 7.66 | 0.21 | 0.17 | 0.59 |
| 19 | #16-2 | 75.00 | 98.00 | 75.38 | 666.00 | 0.19 | 9.50 | 0.25 | 0.14 | 0.67 |
| 20 | #16-3 | 75.00 | 94.00 | 72.31 | 666.00 | 0.19 | 9.28 | 0.37 | 0.00 | 1.00 |
| 21 | #17-1 | 75.00 | 102.00 | 78.46 | 666.00 | 0.18 | 9.42 | 0.28 | 0.08 | 0.81 |
| 22 | #17-2 | 75.00 | 76.00 | 58.46 | 666.00 | 0.19 | 7.37 | 0.21 | 0.25 | 0.39 |
| 23 | #17-3 | 75.00 | 78.00 | 60.00 | 666.00 | 0.14 | 5.40 | 0.17 | 0.33 | 0.21 |
| 24 | #17-4 | 75.00 | 78.00 | 60.00 | 666.00 | 0.21 | 8.30 | 0.23 | 0.18 | 0.56 |
| 25 | #3-2 | 150.00 | 233.00 | 179.23 | 467.00 | 0.14 | 11.30 | 0.35 | 0.00 | 1.00 |
| 26 | #3-3 | 150.00 | 260.00 | 200.00 | 467.00 | 0.11 | 10.38 | 0.32 | 0.00 | 1.00 |
| 27 | #3-4 | 150.00 | 269.00 | 206.92 | 467.00 | 0.15 | 14.78 | 0.53 | 0.00 | 1.00 |
| 28 | #3-5 | 150.00 | 284.00 | 218.46 | 467.00 | 0.12 | 12.53 | 0.51 | 0.00 | 1.00 |
| 29 | #A-3 | 150.00 | 270.00 | 207.69 | 467.00 | 0.12 | 11.29 | 0.41 | 0.00 | 1.00 |
| 30 | #4-1 | 150.0 | 268.00 | 259.00 | 667.00 | 0.17 | 29.86 | 0.75 | 0.00 | 1.00 |
| 31 | #4-2 | 150.0 | 255.00 | 246.40 | 667.00 | 0.14 | 23.32 | 0.51 | 0.00 | 1.00 |
| 32 | #4-3 | 150.0 | 272.00 | 262.80 | 667.00 | 0.18 | 32.18 | 0.74 | 0.00 | 1.00 |
| 33 | #4-4 | 150.0 | 260.00 | 251.00 | 667.00 | 0.12 | 19.51 | 0.62 | 0.00 | 1.00 |
| 34 | #A-4 | 150.0 | 249.00 | 240.60 | 667.00 | 0.13 | 20.53 | 0.64 | 0.00 | 1.00 |
BPD (trademark Visudyne®) at a dosage of 1 mg/kg was injected through the mouse tail vein as described previously.12,13 At a 15 min drug-light interval, superficial irradiation of the tumor was performed with a 690-nm laser (B&W Tek Inc., Newark, Delaware). A microlens fiber was coupled to the laser to irradiate the tumor uniformly. Animals were assigned to four light dose groups, and each group was comprised of 2 to 3 subgroups with different ϕ. There were a total of 6 treatment groups: 22.5 J/cm2 at 75 Mw/cm2, 30 J/cm2 at 75 mW/cm2, 45 mW/cm2 at 75 mW/cm2, 50 J/cm2 at 75 mW/cm2, 70 J/cm2 at 150 mW/cm2 and 100 J/cm2 at 150 mW/cm2. Tumor-bearing mice that received neither light irradiation nor BPD were used as controls.
Oxygen Measurements
The in vivo tissue oxygen partial pressure pO2 was measured during PDT treatment using a phosphorescence-based ROS probe (OxyLite Pro, Oxford Optronix, Oxford, United Kingdom). A bare-fiber-type probe (NX-BF/O/E, Oxford Optronix, Oxford, United Kingdom) was placed inside the tumor at a 3 mm depth from the treatment surface. The ROS concentration ([ROS]) was calculated by multiplying the measured pO2 with the ROS solubility in tissue, which is 1.295 μM/mmHg.5 Measured [ROS]0 and [ROS](t) were used to calculate reacted oxygen species using the macroscopic singlet oxygen model.14,15
BPD Concentration
Following the drug-light interval of 15 min, measurements of light fluence rate, photosensitizer concentration and [ROS] were performed. BPD fluorescence spectra was obtained using a custom-made multi-fiber contact probe before and after PDT.17 The probe is connected to a 405 nm laser (Power Technology Inc., Little Rock, AR, USA) for the fluorescence excitation of BPD and a multichannel CCD spectrograph (InSpectrum, Princeton Instruments, Trenton, NJ, USA) for the collection of the spectra. The in vivo photosensitizer concentration was obtained by comparing the in vivo BPD spectra with those of phantoms with known photosensitizer concentrations. The attenuation of the fluorescence signal due to light absorption and scattering by tissues was corrected by applying an empirical correction factor described elsewhere.16 The accuracy of in vivo measurements was validated by ex vivo measurements in separate mice.19
Tumor Regrowth Rate Analysis
Tumor volumes were measured daily after PDT . Width (a) and length (b) were measured with slide calibers, and tumor volumes (V) was calculated using .20 Tumor volumes were tracked for 14 days, and the tumor regrowth factor (k) was calculated by the best exponential fit [with a form ]to the measured volumes over the days (d). CI was calculated for each treatment group as
| (1) |
where k is the tumor regrowth factor for each group and kctr is the regrowth factor for the control group, which consisted of tumors exposed to neither BPD nor light illumination.
Reactive Oxygen Species Explicit Dosimetry
Type II PDT process can be described by a set of kinetic equations which can be simplified to describe the creation of [ROS]rx.21,22 These equations are dependent on the temporal and spatial distribution of ϕ, photosensitizer concentration ([S0]), ground state oxygen concentration ([ROS]), and the photosensitizer-specific reaction-rate parameters (β and ξ). The relevant equations are:
| (2) |
where ϕ is the light fluence rate, S is the source term, μa and μs’ are the absorption and reduced scattering coefficients, respectively. The five parameters involved in the kinetic equations are photosensitizer-specific and details of each can be found elsewhere.21 ξ is the photochemical oxygen consumption rate per light fluence rate and photosensitizer concentration under ample ROS supply. β represents the ratio of the monomolecular decay rate of the triplet state photosensitizer to the bimolecular rate of the triplet photosensitizer quenching by ROS. g is the maximum macroscopic oxygen perfusion rate. The reacted oxygen species concentration ([ROS]rx) used as a dosimetric measure in other studies was calculated and compared using an initial ground state oxygen concentration of ([ROS]0) of 40 μM, the measured [ROS]0, the measured [ROS](t) throughout treatment, and the [ROS] determined with blood flow changes measured during treatment. The two parameters used in Eq. (2) are obtained from literature: and β = 11.9 μM.1
3. RESULTS AND DISCUSSION
BPD-mediated PDT with different in-air fluences, different ϕair, and different exposure times was performed in mouse models bearing RIF tumors. Tissue optical properties, photosensitizer concentration, and tissue oxygenation were measured to calculate PDT dose, and [ROS]rx. Table 1 summarizes all of the treatment conditions, BPD concentration was measured both before and after PDT treatment. It is shown in Figure 1, the symbols represent the measured values, and the solid lines are model-calculated photosensitizer concentration during treatment. There are not significant changed.
Figure 1.

BPD concentration versus fluence at 3 mm tumor depth for various treatment conditions. The lines indicate the calculated change in photosensitizer concentration during light delivery for PDT.
Measured was used to refine the photochemical parameters previously determined for the reactive oxygen species explicit dosimetry model used to calculate [ROS]rx, Individually, measured for each mouse was used as shown Figure 2. There are no significant changes during the treatment.
Figure 2.

Temporal changes in ROS concentration during light for PDT with various treatment conditions. The lines represent the calculated changed in ROS concentration during treatment.
Fluence, PDT dose and calculated [ROS]rx at 3 mm were compared as dosimetric quantities to estimate the outcome of BPD-mediated PDT for RIF tumors. Outcome was quantified by the calculation of CI. If there is no tumor regrowth up to 14 days after treatment, then CI = 1. PDT dose is calculated using the product of PS uptake and measured light fluence rate at 3 mm. The fluence rate at 3 mm is determined. We used Eq. (2)19 and photochemical parameters (ζ and β) obtained from literature13 to calculate [ROS]rx. The goodness of the fit and the corresponding upper and lower bounds of the fits (gray area) to the fluence, PDT dose and the calculated [ROS]rx are presented in Figure 3. Figure 3(a) shows that, while fluence correlates sigmoidal with the PDT outcome, it exhibits large uncertainties as defined by the large bounds of the gray area, as well as by the low value of R2 =0.6296. As shown in Figure 3(b), PDT dose allows for reduced subject variation and improved predictive efficacy as compared to fluence and measured [ROS]rx. PDT dose showed a better correlation with CI with a higher value of R2=0.918 and a narrower band of gray area as it accounts for both light dose and tissue [BPD] levels. However, PDT dose overestimates [ROS]rx in the presence of hypoxia as it does not account for the oxygen dependence of ROS quantum yield. The goodness of fit R2 = 0.9843 and the narrowest gray area in Figure 3 (c) shows that the measured [ROS]rx correlates the best with CI. [ROS]rx accounts for the key quantities of light fluence, photosensitizer concentration, and tissue oxygen level.
Figure 3.
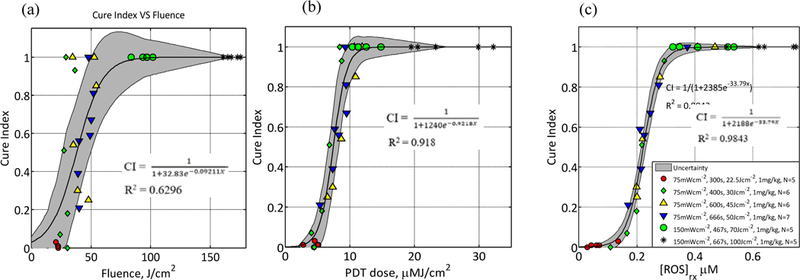
CI plotted as a function of (a) fluence at a 3 mm tumor depth, (b) calculated PDT dose at 3 mm depth, and (c) mean reacted oxygen species at 3 mm depth ([ROS]rx) calculated using Eq. (2) and the parameters summarized are and . The solid lines show the best-fit to the data with functional forms,, and with R2 = 0.6296, 0.918 and 0.9843 for (a), (b), respectively. The gray region indicates the upper and lower bounds of the fit with 95% confidence level.
4. CONCLUSION
The response of mouse RIF tumors to PDT depends on tissue oxygenation, photosensitizer uptake, total energy delivered, and the ϕ at which treatment is delivered. An accurate dosimetry quantity for the evaluation of treatment outcome should account for all of these parameters. This study evaluated the efficacy and outcomes of different PDT treatments and how fluence, PDT dose, and [ROS]rx compare as dosimetric quantities. The correlation between CI and [ROS]rx suggests that [ROS]rx at 3 mm is the best quantity to predict the treatment outcome for a clinically relevant tumor regrowth endpoint. PDT dose is a better dosimetric quantity than fluence, but it is worse than [ROS]rx as it does not account for the consumption of for different ϕ. For BPD in RIF tumors, the temporal dependence of in-vivo oxygen concentration during PDT can’t be well modeled by our macroscopic model (for measurement [ROS], R2 = 0.9843). This implies that it is necessary to make ROSED measurements during PDT to determine [ROS]rx, in conjunction with the photochemical parameters required in Eq.2. This study determines the [ROS]rx threshold dose for vascular BPD-mediated PDT for the first time.
5. Acknowledgments
The authors would like to thank Min Yuan, Joann Miller and Shirron Carter for their advice concerning the mouse studies and protocols. This work was supported by grants from the National Institute of Health (NIH) R44 CA183236, R01 CA85831 and P01 CA87971.
REFERENCES
- [1].Agostinis P, Berg K, Cengel KA, et al. , “Photodynamic therapy of cancer: an update,” CA: a cancer journal for clinicians 61(4), 250–81 (2011). [DOI] [PMC free article] [PubMed] [Google Scholar]
- [2].Castano AP, Demidova TN, Hamblin MR, “Mechanisms in photodynamic therapy: part one-photosensitizers, photochemistry and cellular localization,” Photodiagnosis and photodynamic therapy 1(4), 279–93 (2004). [DOI] [PMC free article] [PubMed] [Google Scholar]
- [3].Penjweini R, Kim MM, Liu B, Zhu TC, “Evaluation of the 2-(1-Hexyloxyethyl)-2-devinyl pyropheophorbide(HPPH) mediated photodynamic therapy by macroscopic singlet oxygen modeling,” Journal of Biophotonics 9(11–12),1344–1354 (2016). [DOI] [PMC free article] [PubMed] [Google Scholar]
- [4].Qiu H, Kim MM, Penjweini R, Zhu TC, “Macroscopic singlet oxygen modeling for dosimetry of Photofrinmediated photodynamic therapy: an in-vivo study,” Journal of biomedical optics 21(8), 88002 (2016). [DOI] [PMC free article] [PubMed] [Google Scholar]
- [5].Wang KKH, Finay JC, Busch TM et al. , “Explicit dosimetry for photodynamic therapy: macroscopic singlet oxygen modeling,” Journal of Biophotonics, 3(5–6), 304–318 (2010). [DOI] [PMC free article] [PubMed] [Google Scholar]
- [6].Liang X, Wang KKH, Zhu TC, “Singlet oxygen dosimetry modeling for photodynamic therapy,” Proc. SPIE, 8210, 8210T-1–8210T-7 (2012). [DOI] [PMC free article] [PubMed] [Google Scholar]
- [7].Mcillan DD, Chen D, Kim MM, Liang X, Zhu TC, “Parameter determination for singlet oxygen modeling of BPD-mediated PDT,” Proc. SPIE, 8568, 856810–1-856810–8 (2013). [DOI] [PMC free article] [PubMed] [Google Scholar]
- [8].Zhu TC, Finlay JC, Zhou X, Li J, “Macroscopic modeling of the singlet oxygen production during PDT,” Proc. SPIE, 6427, 642708–1-642708–12 (2007). [DOI] [PMC free article] [PubMed] [Google Scholar]
- [9].Chen B, Pogue BW, Luna JM, Hardman RL, Hoopes PJ, Hasan T, “Tumor Vascular Permeabilization by Vascular-Targeting Photosensitization: Effects, Mechanism, and Therapeutic Implications,” Clin. Cancer Res, 12(1), 917–23 (2006). [DOI] [PubMed] [Google Scholar]
- [10].Wang KK et al. , “Explicit dosimetry for photodynamic therapy: macroscopic singlet oxygen modeling,” J. Biophoton. 3(5–6), 304–318 (2010). [DOI] [PMC free article] [PubMed] [Google Scholar]
- [11].Zhu TC et al. , “In-vivo singlet oxygen threshold doses for PDT,” Photon. Lasers Med. 4(1), 59–71 (2015). [DOI] [PMC free article] [PubMed] [Google Scholar]
- [12].Liu B et al. , “Comparison of PDT parameters for RIF and H460 tumor models during HPPH-mediated PDT,” Proc. SPIE 8931 89311C (2014). [DOI] [PMC free article] [PubMed] [Google Scholar]
- [13].Kim MM. Ghogare AA, Greer A and Zhu TC, “On the in vivo photochemical rate parameters for PDT reactive oxygen species modeling”. Phys. Med. Biol. 00(2016) 1–48. [DOI] [PMC free article] [PubMed] [Google Scholar]
- [14].Qiu H, Kim MM, Penjweini R, Zhu TC, “Dosimetry study of PHOTOFRIN-mediated photodynamic therapy in a mouse tumor model,” Proc. SPIE 9694, 96940T (2016). [DOI] [PMC free article] [PubMed] [Google Scholar]
- [15].Penjweini R, Liu B, Kim MM, Zhu TC, “Explicit dosimetry for 2-(1-hexyloxyethyl)-2-devinyl pyropheophorbide-a-mediated photodynamic therapy: macroscopic singlet oxygen modeling,” Journal of biomedical optics 20(12), 128003 (2015). [DOI] [PMC free article] [PubMed] [Google Scholar]
- [16].Mesquita RC et al. , “Tumor blood flow differs between mouse strains: consequences for vasoresponse to photodynamic therapy,” PLoS One 7(5), e37322 (2012). [DOI] [PMC free article] [PubMed] [Google Scholar]
- [17].Penjweini R, Kim MM, Liu B, and Zhu TC, “Evaluation of the 2-(1-Hexyloxyethyl)-2-devinylpyropheophorbide (HPPH) mediated photodynamic therapy by macroscopic singlet oxygen modeling,” J. Biophotonics 9(11–12): 1344–1354 (2016). [DOI] [PMC free article] [PubMed] [Google Scholar]
- [18].Qiu H, Kim MM, Penjweini R, and Zhu TC, “Macroscopic singlet oxygen modeling for dosimetry of Photofrinmediated photodynamic therapy: an in vivo study,” J. Biomed. Opt. 21(8): 088002 (2016). [DOI] [PMC free article] [PubMed] [Google Scholar]
- [19].Kim MM, Penjweini R, and Zhu TC, “Evaluation of singlet oxygen explicit dosimetry (SOED) for predicting treatment outcomes of benzoporphyrin derivative monoacid ring A (BPD-MA)-mediated photodynamic therapy,” J. Biomed. Opt. 22(2): 028002 (2017). [DOI] [PMC free article] [PubMed] [Google Scholar]
- [20].Busch TM et al. , “Fluence rate-dependent intratumor heterogeneity in physiologic and cytotoxic responses to photofrin photodynamic therapy,” Photochem. Photobiol. Sci. 8(12), 1683–1693 (2009). [DOI] [PMC free article] [PubMed] [Google Scholar]
- [21].Kim MM, Penjweini R, Ong YH and Zhu TC, “Singlet oxygen explicit dosimetry to predict long-term local tumor control for BPD-mediated photodynamic therapy,” Proc. SPIE 10047, 100470X(2018). [Google Scholar]
- [22].Hu XH, Feng Y, Lu JQ, et al. , “Modeling of a type II photofrin-mediated photodynamic therapy process in a heterogeneous tissue phantom,” Photochemistry and photobiology 81(6), 1460–8 (2005). [DOI] [PubMed] [Google Scholar]