

Abstract
Stimulation and functional imaging studies have revealed the existence of a large network of cortical regions involved in the regulation of heart rate. However, very little is known about the link between cortical neural firing and cardiac-cycle duration (CCD). Here, we analyze single-unit and multiunit data obtained in humans at rest, and show that firing rate covaries with CCD in 16.7% of the sample (25 of 150). The link between firing rate and CCD was most prevalent in the anterior medial temporal lobe (entorhinal and perirhinal cortices, anterior hippocampus, and amygdala), where 36% (18 of 50) of the units show the effect, and to a lesser extent in the mid-to-anterior cingulate cortex (11.1%, 5 of 45). The variance in firing rate explained by CCD ranged from 0.5 to 11%. Several lines of analysis indicate that neural firing influences CCD, rather than the other way around, and that neural firing affects CCD through vagally mediated mechanisms in most cases. These results show that part of the spontaneous fluctuations in firing rate can be attributed to the cortical control of the cardiac cycle. The fine tuning of the regulation of CCD represents a novel physiological factor accounting for spontaneous variance in firing rate. It remains to be determined whether the “noise” introduced in firing rate by the regulation of CCD is detrimental or beneficial to the cognitive information processing carried out in the parahippocampal and cingulate regions.
SIGNIFICANCE STATEMENT Fluctuations in heart rate are known to be under the control of cortical structures, but spontaneous fluctuations in cortical firing rate, or “noise,” have seldom been related to heart rate. Here, we analyze unit activity in humans at rest and show that spontaneous fluctuations in neural firing in the medial temporal lobe, as well as in the mid-to-anterior cingulate cortex, influence heart rate. This phenomenon was particularly pronounced in the entorhinal and perirhinal cortices, where it could be observed in one of three neurons. Our results show that part of spontaneous firing rate variability in regions best known for their cognitive role in spatial navigation and memory corresponds to precise physiological regulations.
Keywords: heart rate, human cortex, resting state, spontaneous neural firing
Introduction
What does the brain at rest do? While there is no simple answer to this question, it is usually agreed that the spatiotemporal structure of spontaneous brain activity is meaningful (Arieli et al., 1996; Berkes et al., 2011) and that it can influence responses to stimuli (Greicius et al., 2004). However, the brain at rest is not only preparing to respond to future stimuli; it is also constantly engaged in monitoring and regulating bodily organs, such as the heart.
Central brain regions engaged in heart-rate regulation include large portions of the cingulate cortex, the ventromedial prefrontal cortex, the insula, and the amygdalohippocampal formation. The role of those regions in heart-rate regulation was established by a combination of anatomical tracing, stimulation, and lesion studies in rats (Cechetto and Saper, 1990; Benarroch, 1993; Verberne and Owens, 1998; Westerhaus and Loewy, 2001), cats, and monkeys (Anand and Dua, 1956). There is good agreement about the areas involved in heart-rate regulation as identified in humans by direct electrical stimulation in patients (Pool and Ransohoff, 1949; Stock et al., 1978; Oppenheimer et al., 1992; Parvizi et al., 2013) or with functional magnetic resonance imaging during tasks (for review, see Cechetto and Shoemaker, 2009; Thayer et al., 2012; Beissner et al., 2013; Gianaros and Wager, 2015) or at rest (Chang et al., 2013; Rebollo et al., 2018). This suggests that neural firing might be directly related to heart-rate regulation, at least in so-called limbic regions.
Surprisingly, the literature on neural variability at the single-neuron level contains very little about the link between neural activity and heart rate. However, the link between local field potentials and respiration has recently been examined (Tort et al., 2018). Spontaneous variations in firing rate are most often attributed to cellular machinery noise (Faisal et al., 2008), or to brain state (Poulet and Petersen, 2008; Deco and Hugues, 2012; McGinley et al., 2015) and fluctuations in excitability (Goris et al., 2014) related to top-down factors (Gilbert and Sigman, 2007). However, some of the ongoing fluctuations in cortical firing rate might be related to heart rate. Indeed, two reports that have received little notice describe a relation between the duration of the cardiac cycle and firing rate in the cat somatosensory thalamus (Massimini et al., 2000), as well as in the human amygdala and hippocampus (Frysinger and Harper, 1989, 1990), i.e., in structures that interact massively with cortical regions.
Here, we directly investigated the link between cardiac-cycle duration (CCD) and spontaneous neural firing rate in single-unit and multiunit activity (SUA and MUA) recorded in humans at rest. Recording sites were determined for diagnostic and therapeutic purposes only, but happened to be often located in regions known to be related to heart rate, i.e., in the medial temporal lobe (MTL; parahippocampal gyrus, hippocampus, and amygdala) and in the cingulate cortex.
Before presenting the results, we remind readers of some basic facts about the heart rate and its central regulation. The CCD, which can be quantified with electrocardiograms (ECGs), varies spontaneously during the resting state (Fig. 1). The CNS can affect CCD (Somsen et al., 2004; Berntson et al., 2007; Thayer et al., 2012; Gianaros and Wager, 2015) by modulating the vagal output to the cardiac pacemaker, resulting in fast, beat-to-beat, but also longer-lasting changes in heart rate. Sympathetic influences affect heart-rate fluctuations with a delay of several seconds and induce long-lasting changes, via the modulation of cardiac contractibility and vessel resistance.
Figure 1.

Measuring the cardiac cycle. A, An example ECG trace showing the QRS complex. CCD is defined as the time between two successive R peaks. B, Histogram of CCD distribution in one patient. C, The CCD time series (bottom) is constructed by assigning each CCD (top) to the central time point (large black dots) between two heartbeats, then interpolating the points with a cubic spline function.
Following the approach used in Frysinger and Harper (1989) and Massimini et al. (2000), we first examined the correlation between neuronal firing rate and CCD, and further characterized the firing properties of the neurons that exhibit a strong correlation. To provide indications on the underlying mechanisms, we then investigated the temporal aspects of the link between firing rate and CCD. Last, we analyzed the directionality of interactions from the neuron to the heart and from the heart to the neuron.
Materials and Methods
Subjects.
Twelve patients with pharmacoresistant focal epilepsy (five male; seven female; mean age, 31.9 ± 8.83 years) were stereotactically implanted with depth electrodes to determine the seizure-onset zone for potential surgical resection. Implantation sites were selected for diagnostic and therapeutic purposes only. During the following seizure monitoring period, participants provided informed and written consent to participate in the study. At the time of recordings, all patients received at least one medication that could interfere with cardiac activity (most often, carbamazepine, lamotrigine, or lacosamide; Table 1). All procedures were approved by the local ethics committee (Comités de Protection des Personnes Paris VI, Institut National de la Santé et de la Recherche Médicale C11-16).
Table 1.
Patients and recording sites
| Patient number | Age (years) | Gender | Medication | Heart rate (beats/min) | MNI mm (x, y, z) | Anatomical description | Number of units | Cardiac-cycle effecta | Contact in seizure-onset zone |
|---|---|---|---|---|---|---|---|---|---|
| 1 | 30 | Male | Oxcarbazepine, lacosamide, clobazam | 61 | −24, −3, −30 | Parahippocampal gyrus | 8 | 1 R− | No |
| −38, −29, −23 | Parahippocampal gyrus | 2 | 0 | No | |||||
| 2 | 26 | Male | Carbamazepine, valproate | 68 | 30, −5, −27 | Parahippocampal gyrus | 1 | 0 | No |
| 41, −54, −15 | Fusiform gyrus | 6 | 0 | No | |||||
| 3 | 23 | Female | Carbamazepine, topiramate, lacosamide | 80 | −25, −14, −16 | Parahippocampal gyrus | 5 | 2 R+ | No |
| −20, −20, −12 | Parahippocampal gyrus | 2 | 0 | No | |||||
| 4 | 32 | Male | Levetiracetam, lamotrigine, carbamazepine | 76 | −17, −5, −21 | Amygdala/parahippocampal gyrus | 7 | 1 R+, 2 R− | Yes |
| −18, −14, −21 | Hippocampus | 9 | 0 | No | |||||
| 5 | 22 | Female | Valproate, lamotrigine | 88 | 5, −4, 49 | Midcingulate sulcus | 8 | 0 | No |
| 10, 20, 27 | Anterior cingulate sulcus | 13 | 1 R− | Yes | |||||
| 6 | 40 | Female | Lacosamide, phenytoine, ventoline, | 71 | −16, −10, −26 | Hippocampus/parahippocampal gyrus | 6 | 0 | No |
| Piasclédine | −9, 38, −20 | Subgenual anterior cingulate | 2 | 0 | No | ||||
| −27, −7, −46 | Parahippocampal gyrus | 7 | 1 R+ | Yes | |||||
| 7 | 48 | Female | Lamotrigine, zonisamide, perampanel | 92 | −20, −2, −31 | Parahippocampal gyrus | 7 | 2 R+ | Yes |
| −24, −20, −16 | Hippocampus/parahippocampal gyrus | 3 | 0 | Yes | |||||
| 8 | 34 | Male | Carbamazepine, lamotrigine | 65 | 24, −14, −26 | Hippocampus/parahippocampal gyrus | 11 | 0 | No |
| 21, −5, −39 | Parahippocampal gyrus | 7 | 0 | No | |||||
| 9 | 26 | Female | Levetiracetam, lacosamide, valproate, fluoxetine, zolpidem, diazepam, propanolol | 63 | 22, −3, −34 | Parahippocampal gyrus | 13 | 11 R− | Unknownb |
| 10 | 25 | Female | Lamotrigine, lacosamide, clobazam | 68 | 10, 18, 30 | Anterior cingulate gyrus | 7 | 0 | No |
| 11 | 47 | Male | Eslicarbazepine, zonisamide | 69 | −18, −65, −10 | Fusiform gyrus | 9 | 0 | No |
| 12 | 30 | Female | Lamotrigine, levetiracetam, carbamazepine, perampanel | 69 | −2, 30, 21 | Anterior cingulate gyrus | 7 | 1 R+ | No |
| −2, 5, 41 | Midcingulate gyrus | 10 | 1 R+, 2 R− | No |
aR+: unit showing a positive correlation between firing rate and cardiac cycle duration (p < 0.05, FDR corrected); R−: unit showing a negative correlation.
bPremature interruption of the clinical procedure; no seizure recorded.
Recordings.
The depth electrodes (AdTech, Behnke-Fried type) consisted of eight macrocontacts (platinum; diameter, 1.3 mm) embedded on the surface of a polyurethane tube with a hollow lumen. Eight 40-μm-diameter platinum microwires, including one used as a reference, protruded 3–6 mm into the cerebral tissue beyond the tip of the deepest macrocontact. The ECG was recorded from two cutaneous electrodes on the upper chest, but the exact positioning was not standardized. All signals were collected using a 160-channel recording system (Neuralynx, Atlas) with a 32 kHz sampling rate and a 0.1–8000 Hz bandpass filter for microwire data and a 4 kHz sampling rate and 0.1–1000 Hz bandpass filter for the ECG.
Experimental design.
During data collection, seated subjects fixated a central point on a gray background displayed on a laptop monitor. The extracellular neural signals analyzed in the current study came from either one continuous recording during resting-state fixation lasting 5–6 min, or from shorter blocks of 13–30 s of resting-state fixation embedded within a task (Babo-Rebelo et al., 2016).
Electrode localization.
Anatomical localization was based on individual postoperative MRI warped to the MNI brain using the EpiLoc toolbox developed on the STIM platform (stereotaxy, techniques, images, models; http://pf-stim.cricm.upmc.fr), as well as on the computed tomography scan aligned with MRI data. Note that the microelectrode bundle opens at the tip of the macroelectrode, with a distance of a few millimeters between microwires. The localization described in Table 1 provides an anatomical description of all eight microwires, which in some cases could span different regions.
Spike detection and spike time series.
An adaptive filtering procedure (Keshtkaran and Yang, 2014) was applied to the raw data to limit power-line interference as well as harmonics. Spike detection and waveform sorting were performed using the semiautomatic procedure implemented in the software wave_clus (Quiroga et al., 2004). Data were first bandpass filtered between 300 and 3000 Hz (elliptic bandpass filter, fourth order) and spikes were detected using the automatic amplitude threshold algorithm. Thresholds for spike detection ranged between 3.5 and 5.5 SDs. Waveforms were then clustered according to the superparamagnetic clustering algorithm. Typically, one to three clusters were isolated from each microelectrode where spikes had been identified. A number of additional steps were applied for selecting valid units after cluster isolation.
First, we observed waveforms for each cluster and discarded clusters displaying multiple peaks (n = 5). Second, we discarded clusters without any spike for ≥45 consecutive cardiac cycles (n = 7). We then removed the five clusters with the lowest firing rate (<0.2 spikes/s). All remaining clusters (150) were considered valid units. Units were further identified as single or multiunit based on the percentage of very short interspike intervals (ISIs). Units with <1% of ISIs <3 ms were classified as single units. All others were classified as multiunits. After applying all the steps described above, 108 single units and 42 multiunits were selected for further analysis.
Spike times were downsampled from 32 to 1 kHz. Spike density, a continuous estimate of instantaneous firing rate, was estimated by convoluting the spike time series with a Gaussian kernel (20 ms SD). The spike-density time series were used for the spectral analysis and for the computation of coherence with heart-rate variability (HRV), as well as to search for transient changes in firing rate in response to heartbeats.
CCD and CCD time series.
We detected R peaks in the ECG using a semiautomatic procedure that involved correlating the ECG with a template QRS complex defined on a subject-by-subject basis, and the manual verification of all R peaks separated from their neighbors by very short or very long intervals. R-peak timings were downsampled from 4 to 1 kHz. CCD, or interbeat interval, was defined as the latency difference between two successive R peaks (Fig. 1A,B). In the four patients with ≥5 min of continuous recordings, CCD time series were created by assigning each CCD to the central time point between the heartbeats corresponding to the cardiac cycle, and interpolating with a cubic spline function (Fig. 1C). These time series were used for the spectral analysis of HRV as well as for cross-correlation between the ISI and CCD time series.
Linear correlation analysis between firing rate and CCD.
To quantify the correlation between firing rate and CCD in each unit, we computed the mean firing rate at each cardiac cycle (number of spikes during a cardiac cycle divided by cycle duration, spike/s) and computed for each unit the Pearson correlation coefficient between the firing rate and CCD, across all cardiac cycles. Statistical significance was evaluated using a permutation-based procedure, where the original order of CCDs was shuffled 10,000 times. The resulting Monte-Carlo p values were corrected for multiple comparisons across recording sites using the false discovery rate (FDR) procedure (Hochberg and Benjamini, 1990).
Spectral analysis of HRV and spike density.
We analyzed both HRV and spike-density time series in the frequency domain in the four patients in whom we recorded 5 min of continuous data. Spectral analysis was performed using the FieldTrip toolbox for Matlab (Oostenveld et al., 2011), resulting in a multitaper frequency transformation in sliding 60 s time windows with 6 s overlap. Coherence between the HRV and spike-density spectral estimates was computed using the FieldTrip function ft_connectivityanalysis.m.
Cross-correlation and coupling between inter spike interval (ISI) and CCD time series.
To assess whether the fluctuations of neuronal spiking and heartbeat activity are correlated, we computed cross-correlograms between a smoothed neuronal ISI and CCD time series. Created in a manner similar to that used to produce a CCD time series, a neuronal ISI time series was generated by assigning to each ISI center time point the ISI duration. Then, interpolation was applied using cubic splines. We estimated the coupling kernel, α(t), which expresses the systematic interaction between the two smoothed time series over the whole recording duration: CCD(t) = ∑lα(l) · ISI(t – l). Specifically, we calculated this kernel using (inverse) Fourier transforms, α(t) = ifft{fft(CCD(t))/fft(ISI(t))}.
Computations were performed for each continuous recording block. Results were averaged across the available blocks. The contribution of each block was weighted by its duration.
Detection of transient changes in instantaneous firing rate in response to heartbeats.
Data were epoched from one R peak of the ECG to the next. Data analysis was performed by analyzing the data locked to the onset of the epoch, by analyzing the data locked to the end of the epoch, or by normalizing epoch duration from the current heartbeat to the next, latencies being then expressed in percentage of CCD. Results were similar in all three cases and the results reported here correspond to the normalized epoch duration. The existence of transient increases or decreases in firing rate in the spike-density time series was then assessed by a cluster-based permutation procedure (Maris and Oostenveld, 2007) that intrinsically corrects for multiple comparisons. For each unit, we created 10,000 surrogate datasets where R-peak latencies were shuffled, but the CCD distribution was preserved. We compared at each time point the observed spike-density value with the distribution of the 10,000 surrogate spike-density value to derive a Monte-Carlo p value. Adjacent time points with a Monte-Carlo p value <0.01 defined candidate clusters. Monte-Carlo p values were then converted into z scores. In a second step, we summed over time the z scores of each candidate cluster. We repeated this procedure on the 10,000 surrogate datasets, retaining for each surrogate dataset the largest z sum, to obtain the maximum (z sum) distribution that could be obtained under the null hypothesis. The comparison between the observed z sum and distribution of surrogate z sum identifies clusters of significantly increased or decreased firing in the original data, with a Monte-Carlo p < 0.05, two-tailed. The resulting Monte-Carlo p values were corrected for multiple comparisons across recording sites using the FDR procedure (Hochberg and Benjamini, 1990).
Phase–response analysis.
To quantify the effect of occurrence and timing of spikes on CCD, we calculated phase–response curves (PRCs) using a method adopted from Blot et al. (2016; where these curves are referred to as delayed spike curves due to the specific context). The PRC measures how much a spike within a cardiac cycle shortens or lengthens the current CCD on average. In particular, defining T− as the time duration since the previous heartbeat and T+(T−) as the time duration to the next heartbeat (which naturally depends on T−), the PRC is expressed as the averaged difference of the duration T+(T−) observed (using heartbeat and spike times) and the duration 〈T+(T−)〉exp that is expected based on knowledge of the CCD distribution only: PRC(T−) = <T+(T−) − <T+(T−)>exp>, where the latter term is calculated by
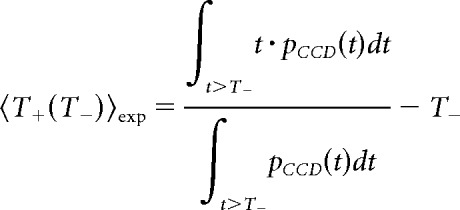 |
and the (outer) average < > is calculated using a suitable binning of CCDs. We considered two types of binning: only one bin corresponding to the whole cardiac cycle, and two bins of different lengths corresponding to systole and diastole. Systole duration was determined in each patient according to the formula proposed by Fridericia (2003):
where RR is the mean CCD of the patient. Diastole was defined, at each cardiac cycle, as the remaining part of the cardiac cycle. Note that this method cannot easily be extended to the analysis of adjacent cycles in a meaningful way.
To test for significance, we applied a permutation-based procedure using a large number (10,000) of surrogate spike trains generated by shuffling the ISI of the original data. We used the Hochberg and Benjamini procedure (Hochberg and Benjamini, 1990) to control for multiple comparisons across recording sites by maintaining the FDR at p < 0.05.
PRC values computed over one cardiac cycle are positive in cells showing a positive correlation between firing rate and CCD (R+ cells) and negative in R− cells. Considering the two-bin (systole, diastole) PRC, we tested for the existence of a significant reduction in PRC from systole to diastole (i.e., positive or negative values getting closer to zero) by multiplying systolic and diastolic PRC values in R− cells by −1, and comparing the resulting PRC values in systole and diastole using a two-tailed paired t test.
Statistical analysis.
As described above, all statistical analysis relied first on the estimation of a Monte-Carlo p value at each recording site, obtained by comparing the empirical result with the distribution under the null hypothesis computed on data in which CCDs have been shuffled, and then on a control for multiple comparisons across recording sites using the Hochberg and Benjamini procedure (Hochberg and Benjamini, 1990) to maintain the FDR at p < 0.05.
Bayes factors were computed using the online tool (http://pcl.missouri.edu/bayesfactor), which is based on Liang et al. (2008). Here, a Bayes factor >10 indicates strong evidence for the null hypothesis, between 3.2 and 10 indicates substantial evidence for the null hypothesis, and <3.2 indicates inconclusive evidence for or against the null hypothesis (Kass and Raftery, 1995).
Code accessibility.
Matlab/Python code is freely available at https://github.com/neuromethods/neural-firing-and-cardiac-cycle-duration.
Results
Data summary
We recorded unit activity together with the ECG in 12 epileptic patients (Table 1) with normal heart rate (mean ± SEM: 72.5 ± 2.8 beats/min; range, 61.4–91.8) during passive fixation. We isolated 150 units (108 SUAs, 42 MUAs), recorded from 112 microelectrodes at 22 recording sites. The average firing rate across all units was (mean ± SEM) 2.54 ± 0.10 spikes/s (SUA, 2.28 ± 0.09; MUA, 3.19 ± 0.12 spikes/s). Fourteen recording sites (Fig. 2A), corresponding to 88 units, were located in the MTL (parahippocampal gyrus, hippocampus, and amygdala). Five recording sites (45 units) were located in the midcingulate and anterior cingulate regions while the ventral visual pathway (two recording sites in the fusiform gyrus, 15 units) or the subgenual anterior cingulate cortex (one recording site, two units) were only occasionally sampled.
Figure 2.

Anatomical description of recording sites. A, All 22 recording sites from 12 patients projected on the medial view of an inflated hemisphere, with left and right hemispheres collapsed for visualization purposes. Each recording site is represented by a dot, with size indicating the number of cells isolated. Dot color indicates sites with at least one unit with a significant increase in firing rate for slower heart rate (positive correlation between firing rate and CCD, pink), with at least one unit with a significant decrease in firing rate for slower heart rate (negative correlation, green), or both (red). Sites where no unit showed a significant link between firing rate and heart rate are presented in gray. B, Coronal brain views with a projection of medial temporal recording sites with y comprised between −10 and −30 (black contour, left) and sites with y comprised between −2 and −7 (yellow contour, right), corresponding to the black and yellow brackets in A.
Correlation between spontaneous firing rate and CCD
Like Frysinger and Harper (1989) and Massimini et al. (2000), we first computed the mean firing rate during each cardiac cycle, and observed a correlation between spontaneous firing rate and CCD. Figure 3A,B shows an example of a cell in the parahippocampal gyrus whose spontaneous firing rate is negatively correlated with CCD. Figure 3C,D shows an example of a cell in the anterior cingulate gyrus whose firing rate is positively correlated with CCD.
Figure 3.

Correlation between firing rate and CCD. A, Example cell (#128, patient #9, parahippocampal gyrus) with a negative correlation between firing rate (spikes/s) and CCD. The left panel is the spike raster plot where the y-axis corresponds to 30 consecutive cardiac cycles, organized by order of occurrence from first (bottom) to last (top), and the x-axis corresponds to the time from current R peak to the next R peak marked by the orange triangle. The middle panel corresponds to the same raster as the left one, but the data are sorted according to increasing CCDs, from short (bottom) to long (top) cardiac cycles. B, Mean firing rate (±SEM) as a function of CCD duration (quintiles, from short to long CCD), in the same cell as in A, for the full dataset (365 cardiac cycles). The inset illustrates the distribution of correlation coefficients between firing rate and CCD derived from surrogate data. The green arrow indicates the correlation coefficient of the empirical data. C, D, Example cell (#162, patient #12, anterior cingulate), showing a positive correlation between firing rate and CCD. Conventions are the same as in A and B. E, Population histogram (n = 150 units) of the correlation coefficient between firing rate and CCD. The colored bars indicate cells with significant positive (pink) and negative (green) correlation between firing rate and CCD (FDR corrected, p < 0.05). F, Comparison of spike waveform amplitude peak between first and last CCD in quintile (n = 25). Horizontal black bars indicate mean of waveform peak amplitude within first and last CCD in quintile over 25 significant units. The top two insets show example waveforms averaged over first and last CCD in quintile. The peak amplitude is indicated by the arrow.
Across all units, the correlation coefficient shows a bias toward negative values (Fig. 3E; mean Pearson r = −0.027 ± 0.008, t test against 0 on Fischer-Z-transformed correlation coefficients, t(149)= −3.51, p < 10−3). This result indicates that at the population level, the firing rate is higher when the heart is beating faster. However, this effect was not evenly distributed among units.
We therefore tested the significance of the correlation between firing rate and CCD at the level of each individual unit. We found that 25 of 150 units (16.7%, from eight different patients and nine recording sites) showed a significant correlation between firing rate and CCD (Fig. 3E; Pearson correlation, all FDR-corrected p's < 0.05). In those 25 neurons, CCD explained on average 4.25 ± 0.53% of spontaneous firing-rate variance, ranging from 0.5 to 11%.
In 17 of these neurons (seven SUAs, 10 MUAs), the correlation was negative, i.e., elevated firing rates corresponded to shorter cardiac cycles (mean r = −0.22 ± 0.014) and in eight neurons (seven SUAs, one MUA), the correlation was positive, i.e., elevated firing rates corresponded to longer cardiac cycles (mean r = 0.14 ± 0.014). Those neurons will be hereafter referred to as R− and R+ neurons, respectively. The firing-rate variance explained by CCD was significantly larger for R− units (5.26 ± 0.62%) than for R+ units (2.1 ± 0.4%; Mann–Whitney U test p = 0.002).
The correlation between spontaneous firing rate and CCD is most prominent in the anterior part of the MTL and cingulate cortex
The MTL was well represented in our dataset. In the MTL, 22.7% of the units (20 of 88) showed a significant correlation with CCD. The most anterior MTL regions, corresponding to the anterior parahippocampal cortex, a region that encompasses the entorhinal and perirhinal cortices, anterior hippocampus, and amygdala, seemed to be particularly involved (Fig. 2). To quantify the difference between posterior and anterior MTL regions, we labeled MTL regions anterior if y ≥ −7 and posterior if y ≤ −10. The anterior MTL regions contained the highest proportion of units (36%, 18 of 50 units) with a significant CCD effect (Fig. 2B; Table 1). This percentage fell to 5.3% (two units of 38) for posterior (y ≤ −10) MTL recording sites. In the midcingulate and anterior cingulate sites, 11.1% of the units showed a significant CCD effect (five of 45 units; proportion lower but not significantly different from that found in MTL, χ2 test, χ2 = 2.63, df = 1, p = 0.10). Last, no CCD effect was observed in regions with fewer samples (fusiform gyrus, zero of 15 units, two patients; subgenual anterior cingulate gyrus, zero of two units, one patient). All the contacts showing a significant correlation between firing rate and CCD broadly belong to the mid-to-anterior cingulate cortex, and to the amygdalohippocampal formation and adjacent cortices.
Positive and negative correlations between firing rate and CCD could be found in the same region (Fig. 2A) in different patients. In two instances, we even found positive and negative correlations at the same location in the same patient in neurons recorded by different microwires, i.e., separated by a few millimeters only (patient #4, amygdala/parahippocampal gyrus, one R+, two R−; patient #12, midcingulate cortex, one R+, two R−).
Neurons showing a significant CCD effect are more variable
Does firing rate in neurons with a significant CCD effect differ from firing rate in other neurons? We first compared the firing rate in neurons with a significant CCD effect (n = 25; mean firing rate, 2.14 ± 1.28 spike/s) to the firing rate of all other neurons (n = 125; mean firing rate, 2.62 ± 2.21 spike/s), but found no significant difference [unpaired t test; t(148) = −1.03; p = 0.30; Bayes factor (BF), 2.79; inconclusive]. The firing of R− neurons (2.13 ± 1.07 spike/s) was similar to that of R+ neurons (2.17 ± 1.74 spikes/s; unpaired t test; t(23) = 0.08; p = 0.94; BF, 2.58; inconclusive).
We then computed a compact measure of firing variability, the Fano factor (FF; Fig. 4A), corresponding to the mean number of spikes divided by the variance in number of spikes, computed over 1 s time windows. The FF of neurons showing a significant CCD effect (n = 25; FF, 3.78 ± 3.90) was significantly larger than the FF of nonsignificant neurons (n = 125; FF, 1.62 ± 1.18; unpaired t test; t(148) = 5.18; p < 10−6). The FF was increasing with cardiac-related variance (Fig. 4B), with a significant correlation between the two (n = 150, Pearson correlation, r = 0.51, p < 10−9).
Figure 4.

FF and cardiac-related variance. A, Violin plot indicating mean (red) and median (black) of FF of units showing no significant correlation (NS) and units showing significant correlation with CCD (R+, R−). B, The FF (on a log10 scale for graphical purpose only) is plotted as a function of variance in spontaneous firing rate explained by CCD, for units showing no significant correlation (gray), a negative correlation (green), and a positive correlation (pink) between firing rate and CCD. *p < 10-6.
Controls on recording stability and epileptic activity
We examined whether the link between spontaneous spiking activity and CCD could be due to some cardiac-related recording instability. We tested whether the spike waveform differed depending on CCD, as proposed by Frysinger and Harper (1989). We measured waveform peak amplitude in spikes occurring in the 20% shortest versus the 20% longest cardiac cycles and tested for possible differences. The spike waveform was stable and did not depend on CCD in the 25 neurons showing a significant cardiac effect (Fig. 3F; waveform peak amplitude, paired t test between spikes occurring in short and long cardiac cycles, t(24) = 0.043; p = 0.97; BF, 4.65; indicating substantial evidence for the null hypothesis) or across the 150 neurons tested (paired t test; t(149) = 0.099; p = 0.92; BF, 10.9; indicating strong evidence for the null hypothesis). Thus, the relationship between spontaneous firing rate and CCD does not arise from cardiac-related recording instability.
We also verified that spike waveform peak amplitude was stable across recording time. The waveform peak amplitude in the first 20% of the recordings was not different from the last 20% in the 25 neurons showing significant CCD effect (paired t test; t(24) = 0.13; p = 0.90; BF, 4.62; indicating substantial evidence for the null hypothesis) or in the 150 neurons analyzed (paired t test; t(149) = 0.098; p = 0.92; BF, 10.91; indicating strong evidence for the null hypothesis).
Last, we verified that the correlation between firing rate and CCD was not confined to the seizure-onset zone, which could be determined for all but one patient (Table 1). Four of the nine recording sites showing the correlation were located outside the seizure-onset zone (two in the anterior parahippocampal cortex, two in the cingulate cortex).
Temporal extension of the link between firing rate and CCD
So far, we have analyzed neural firing within the current cardiac cycle. We further investigated whether the link between spontaneous firing rate and CCD extends over a few cycles only, indicating a vagally mediated process, or over longer time periods, compatible with sympathetic influences. This analysis was performed in the subset of four patients from whom we recorded continuous segments of data of ≥5 min, i.e., the data length recommended to properly evaluate fluctuations in heart rate (Task Force of the European Society of Cardiology and the North American Society of Pacing and Electrophysiology, 1996). In those four patients, 10 cells showed a significant CCD effect (six R+, four R−). We first computed the correlation between firing rate in a given cardiac cycle and the duration of subsequent cardiac cycles. As can be seen in Figure 5 in six cells, located either in the MTL or the cingulate cortex, the correlation was maximal for the current CCD, and decreased over time, a pattern suggesting vagal influences. In the remaining four cells, all located in the MTL, the correlation increased after a few cycles and was maintained for much longer durations, ≤12 cardiac cycles later, compatible with either sympathetic or vagal influences.
Figure 5.
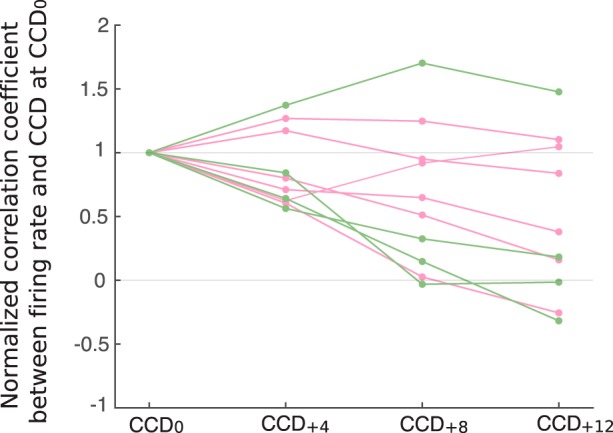
Correlation between firing rate and CCD over time. Firing rate at a given cardiac cycle is correlated with duration of this cardiac cycle (CCD0), or with CCD occurring four (CCD+4), eight (CCD+8), or 12 (CCD+12) cardiac cycles later. All correlation coefficients are normalized to 1 at CCD0. Colors indicate units showing significant positive (pink) and negative (green) correlation between firing rate and CCD0.
In the same 10 cells, we then investigated whether the correlation between firing rate and CCD was modulated by respiration, as observed in the cat, in somatosensory thalamic neurons (Massimini et al., 2000). Indeed, CCD typically decreases during inspiration and increases during expiration. This modulation can be quantified by the spectral analysis of fluctuations in CCD over time, also known as HRV, where a peak between 0.15 and 0.4 Hz captures cardiac-rate changes locked to respiration. All patients showed normal HRV spectra (Fig. 6A,D), but the coherence between firing rate and HRV spectra did not reveal any distinctive peak in either the low-frequency or high-frequency range in any of the 10 cells analyzed (Fig. 6B,E). The coupling between firing rate and CCD that extends over several cycles is thus not related to respiration.
Figure 6.

A, D, Power spectrum of HRV in patient #6 (A) and patient #12 (D). B, E, Coherence between HRV and firing rate in two units. No distinctive peak corresponding to high-frequency or low-frequency HRV could be observed. C, F, Coupling kernel (α) between the smoothed ISI and CCD time series for two units.
Fast, beat-to-beat fluctuations
The analysis across several cycles shows that the coupling between firing rate and CCD can persist over several seconds, but that it is not linked to cardiorespiratory modulation. To test whether the coupling also has a fast component related to beat-to-beat changes that would be a hallmark of vagal influences, we used a different method to assess short-range temporal correlations between variations in firing rate and CCD. In the 25 neurons showing a significant correlation, we extracted the effective coupling kernel between smoothed ISI and CCD time series, which is independent from the autocorrelation structure of each time series. All coupling kernels showed a marked narrow peak at zero time lag and very limited slower modulations (Fig. 6C,F). The interaction between the two time series occurred at a fast time scale, suggesting that the link between firing rate and CCD is partly explained, at least in part, by short-lived, beat-to-beat fluctuations.
Directionality of the interaction between firing rate and CCD
The correlation between firing rate and CCD does not inform us about the directionality of the effect. We first searched for evidence of directed interactions going from the heart to spiking activity by testing whether heartbeats trigger a transient change in firing rate. We analyzed the spike-density function locked to heartbeats and tested whether a heartbeat would trigger a transient increase or decrease in firing rate in any of the 25 neurons with a significant CCD effect. Of the 25 neurons, only two showed a transient increase in firing rate and one showed a transient decrease. None of those observations survived correction for multiple comparisons. We then used a model-based approach to test whether heartbeats elicit transient changes of neuronal firing activity. Each cell was described by a simple spiking neuron model with noisy background inputs and an additional input current triggered by heartbeats. Parameters were fitted using the observed spike trains and heartbeat times (Ladenbauer et al., 2018). Significance was assessed using a permutation-based procedure based on shuffled data. None of the 25 neurons showed a significant modulation of firing rate caused by heartbeats, according to this analysis. Thus, there is little evidence that heartbeats trigger a transient neural response in the 25 neurons showing a CCD effect.
We then searched for evidence of directed interactions in the other direction, i.e., an influence of neural firing on CCD. To test whether the spiking activity of any of the 25 significant neurons exerts an effect on CCD, we used a phase–response analysis that quantifies how much cardiac cycles are shortened or lengthened depending on the occurrence and timing of spikes within the cardiac cycle (Fig. 7A; see Materials and Methods). In all 25 neurons, we found that neuronal spikes were significantly associated with a lengthening or shortening of the cardiac cycle (all FDR-corrected Monte-Carlo p's < 0.05). Depending on neurons, the mean cardiac-cycle shortening or lengthening induced by neural firing varied from −87.2 to +25.3 ms (Fig. 7B). Cardiac-cycle lengthening or shortening revealed by the phase–response analysis was directly related to the strength and sign of the correlation between firing rate and CCD (Fig. 7B; correlation between cardiac-cycle lengthening and Pearson correlation coefficient between firing rate and CCD, Pearson r = 0.75, p < 10−4). The correlation between firing rate and CCD can thus mostly be accounted for by the influence of individual spikes on CCD.
Figure 7.

Effects of spikes and their timing on CCD. A, Change of current CCD caused by spikes depending on their timing since the last heartbeat compared with the expected CCD (gray dots) and mean impact on CCD averaged across all spikes regardless of their timing (green line for shortening, pink line for lengthening) for three example units. B, Mean impact on CCD versus correlation coefficient between firing rate and CCD for the 25 units with significant correlation. C, Average change of CCD caused by spikes during systole and diastole separately for the 25 units from B (green or pink dots indicate a significant difference from 0). Lines connect average impact on CCD by unit. The influence of spikes on CCD was larger during systole in 20 of 25 units.
Because of transmission delays between the recorded structures and the heart, spikes occurring early in the cardiac cycle (systole) should have more influence on the timing of the next heartbeat than spikes occurring late in the cardiac cycle (diastole). We found that it was indeed the case (Fig. 7C) in 20 of 25 neurons, with a significantly larger influence of spikes in systole than in diastole (paired t test, t(24) = 3.13, p = 0.0045). Altogether, these results speak in favor of a directionality of interaction flowing from spiking activity to the heart.
Last, we found that R+ and R− neurons could be observed in the same region, from microwires only a few millimeters apart. We tested whether colocalized R+ and R− neurons systematically display a negative correlation between their firing rate, i.e., whether when a R− neuron fires and shortens the cardiac cycle, the R+ neuron remains relatively quiet. The data do not speak in favor of such a simple mechanism. We correlated the firing rate per cardiac cycle in the four pairs of (R+, R−) neurons available in the recordings (Table 1) and observed all possible patterns: two negative correlations (one nonsignificant; one significant p = 0.0026 uncorrected), two positive correlations (one nonsignificant; one significant p = 0.0007 uncorrected).
Discussion
We recorded single-unit and multiunit activity in humans and found that spontaneous firing rate is directly related to CCD in more than a third of the neurons in the anterior parahippocampal gyrus (36%, 18 of 50), a region that encompasses both entorhinal and perirhinal cortices. We observed the same phenomenon, but in smaller proportion, in the mid-to-anterior cingulate cortex (11%, five of 45), and verified that this effect was not due to cardiac-related recording instability. Up to 11% of the variance of spontaneous firing rates was linked to fast, beat-to-beat changes in CCD, and neurons with a significant correlation between firing rate and CCD displayed an increased temporal variability in mean firing rate. The analysis of directed interactions pointed toward a direction of information flow from neurons to the heart. The detailed analysis of the temporal delays in neuron–heart coupling further reveals the involvement of a vagally mediated influence.
CCD and firing rate in anterior parahippocampal regions and cingulate cortex
The regions where we find the correlation between firing rate and CCD are known to be related to HRV. Both cingulate regions (Ter Horst et al., 1996) and the amygdala and surrounding parahippocampal structures (Price and Amaral, 1981; Schwaber et al., 1982) project to autonomic nuclei, and the electrical stimulation of those regions alters CCD both in monkeys (Smith, 1945) and humans (Selimbeyoglu and Parvizi, 2010). Moreover, the BOLD signal in both cingulate and MTL regions fluctuates with HRV during tasks (Thayer et al., 2012; Beissner et al., 2013) as well as during resting state (Chang et al., 2013; Rebollo et al., 2018). Our results further show that the link between neural activity and CCD in both cingulate and medial temporal regions is directly reflected in fluctuations of spontaneous firing rate.
Perhaps the most striking feature of our results is the very large prevalence (36%, 18 of 50) of cardiac-related units in the anterior part of the parahippocampal gyrus, confirming earlier findings (Frysinger and Harper, 1989). The anterior parahippocampal gyrus contains the entorhinal and perirhinal cortices, located at the interface between the neocortex and the hippocampus. These cortices play an important role in spatial navigation and memory (Fyhn et al., 2004). Neuronal loss in this region is associated with cognitive impairments (Braak and Braak, 1991; Gómez-Isla et al., 1996). Spatial navigation, a behavior that strongly engages the entorhinal cortex (Fyhn et al., 2004), could benefit from a fast and precise regulation of heart rate to anticipate, and react to, the metabolic demands of walking and running.
The data presented here come from epileptic patients, which raises the question of whether the present results extend to healthy organisms. Epileptic patients tend to show a moderate reduction in HRV (Sevcencu and Struijk, 2010) that may be related to medication or epilepsy (Tomson et al., 1998). The data analyzed here corresponded to a quiet resting state, devoid of any seizure. Several arguments suggest that the results presented here are not specific to epileptic patients. First, the regions where we find a link between firing rate and CCD show no systematic relationship with the seizure-onset zone. Second, as detailed above, the regions where we find the CCD effect are known to be involved in cardiovascular regulation, either in animals or healthy human participants. Last, while all patients were under medication at the time of recordings, there was no consistent pattern between the presence of any given drug and the presence of the CCD effect.
Cortical influence on heart rate
We found that changes in firing rate influenced heart rate, with several characteristics suggesting a vagal pathway: (1) the correlation between firing rate at time t and subsequent CCDs broke down after a few cycles in a number of cells, (2) the coupling between firing and CCD included a fast component, acting within a single cardiac cycle, and (3) the directed interaction from the neuron to the heart was most pronounced at systole. Note that slower modulations could also be observed, with a link between firing rate and heart rate spanning several cycles. The slower mechanism could coexist with the fast, vagal influence in the same neuron. A putative anatomical pathway for such modulation relies on the projections of the parahippocampal areas (Pitkänen et al., 2000) and cingulate regions (Pandya et al., 1981) to the amygdala, which in turn projects directly to the vagal nuclei in the medulla, the nucleus ambiguus, and dorsal motor nucleus of the vagus nerve (Hopkins and Holstege, 1978; Schwaber et al., 1982; Spyer, 1994). Still, the analysis we performed cannot rule out the possibility that the link between firing rate and CCD is mediated by another structure, not investigated in the present dataset, that would influence both firing in entorhinal and cingulate cortices on the one hand, and CCD on the other. In line with previous results from Frysinger and Harper (1989), the correlation between firing rate and CCD did not appear to be linked to the respiratory-related changes in heart rate (Eckberg, 2009).
Our results further emphasize the colocalization of neurons that increases or decreases heart rate within the same region. This finding is in line with the observation that the stimulation of the central nucleus of the rat amygdala (Iwata et al., 1987) or of the monkey entorhinal cortex (Reis and Oliphant, 1964) can trigger either increases or decreases in heart rate. Similarly, in humans, both heart-rate increases and decreases are related to activity in the cingulate cortex, as measured with fMRI (Gianaros and Wager, 2015).
A novel factor accounting for the spontaneous variations in firing rate
So far, spontaneous variations in firing rate have been attributed to cellular machinery noise (Faisal et al., 2008), to brain state (Poulet and Petersen, 2008; Deco and Hugues, 2012; McGinley et al., 2015), and to fluctuations in excitability (Gilbert and Sigman, 2007; Goris et al., 2014). Our results suggest that in the parahippocampal region, and to a lesser extent in the cingulate cortex, the fine tuning of the CCD represents a novel, physiological factor accounting for a non-negligible part of the spontaneous variance in firing rate.
Changes in heart rate are often thought to be confined to emotions, pain, stress, and physical effort. It is worth emphasizing that nonemotional standard tasks, such as visual or auditory detection tasks (Lacey and Lacey, 1978; Bradley, 2009; Park et al., 2014; Raimondo et al., 2017), are associated with a precise and reproducible change in CCD. The functional imaging literature in humans has stressed the convergence of cognitive function and cardiac regulation in both the cingulate cortex (Critchley et al., 2003) and in the amygdalohippocampal region (Gianaros et al., 2004). It remains to be determined whether the variance in firing rate related to cardiac-cycle regulation is detrimental, or beneficial (Harris and Wolpert, 1998; McDonnell and Ward, 2011) to the cognitive information processing carried out in the parahippocampal and cingulate regions.
Footnotes
This work was supported by the European Research Council under the European Union's Horizon 2020 research and innovation program (Grant Agreement No. 670325, Advanced Grant Bravius) and a senior fellowship from the Canadian Institute for Advanced Research program in Brain, Mind & Consciousness to C.T.-B., as well as from ANR-10-LABX-0087 Institut d'Études cognitives, ANR-10-IDEX-0001-02 PSL University, ANR-10-IAIHU-06, and the Brain & Spine Institute–L'Institute du Cerveau et de las Moelle épinière. M.B.-R. was supported by Fundação para a Ciência e Tecnologia Grant SFRH/BD/85127/2012. The authors thank neurosurgeons Stéphane Clémenceau and Bernard Mathon, the clinical staff of the epileptology unit, and the patients who participated in the study.
The authors declare no competing financial interests.
References
- Anand BK, Dua S (1956) Circulatory and respiratory changes induced by electrical stimulation of limbic system (visceral brain). J Neurophysiol 19:393–400. 10.1152/jn.1956.19.5.393 [DOI] [PubMed] [Google Scholar]
- Arieli A, Sterkin A, Grinvald A, Aertsen A (1996) Dynamics of ongoing activity: explanation of the large variability in evoked cortical responses. Science 273:1868–1871. 10.1126/science.273.5283.1868 [DOI] [PubMed] [Google Scholar]
- Babo-Rebelo M, Richter CG, Tallon-Baudry C (2016) Neural responses to heartbeats in the default network encode the self in spontaneous thoughts. J Neurosci 36:7829–7840. 10.1523/JNEUROSCI.0262-16.2016 [DOI] [PMC free article] [PubMed] [Google Scholar]
- Beissner F, Meissner K, Bär KJ, Napadow V (2013) The autonomic brain: An activation likelihood estimation meta-analysis for central processing of autonomic function. J Neurosci 33:10503–10511. 10.1523/JNEUROSCI.1103-13.2013 [DOI] [PMC free article] [PubMed] [Google Scholar]
- Benarroch EE. (1993) The central autonomic network: functional organization, dysfunction, and perspective. Mayo Clin Proc 68:988–1001. [DOI] [PubMed] [Google Scholar]
- Berkes P, Orbán G, Lengyel M, Fiser J (2011) Spontaneous cortical activity reveals hallmarks of an optimal internal model of the environment. Science 331:83–87. 10.1126/science.1195870 [DOI] [PMC free article] [PubMed] [Google Scholar]
- Berntson GG, Quigley KS, Lozano D (2007) Cardiovascular psychophysiology. In: Handbook of psychophysiology (Cacioppo JT, Tassinary LG, Berntson GG, eds), pp 182–210. Cambridge, United Kingdom: Cambridge UP. [Google Scholar]
- Blot A, de Solages C, Ostojic S, Szapiro G, Hakim V, Léna C (2016) Time-invariant feed-forward inhibition of Purkinje cells in the cerebellar cortex in vivo. J Physiol 594:2729–2749. 10.1113/JP271518 [DOI] [PMC free article] [PubMed] [Google Scholar]
- Braak H, Braak E (1991) Neuropathological staging of Alzheimer-related changes. Acta Neuropathol 82:239–259. 10.1007/BF00308809 [DOI] [PubMed] [Google Scholar]
- Bradley MM. (2009) Natural selective attention: Orienting and emotion. Psychophysiology 46:1–11. 10.1111/j.1469-8986.2008.00702.x [DOI] [PMC free article] [PubMed] [Google Scholar]
- Cechetto DF, Saper CB (1990) Role of the cerebral cortex in autonomic function. In: Central regulation of autonomic functions (Loewy AD, Spyer KM, eds), pp 208–223. Oxford: Oxford UP. [Google Scholar]
- Cechetto DF, Shoemaker JK (2009) Functional neuroanatomy of autonomic regulation. Neuroimage 47:795–803. 10.1016/j.neuroimage.2009.05.024 [DOI] [PubMed] [Google Scholar]
- Chang C, Metzger CD, Glover GH, Duyn JH, Heinze HJ, Walter M (2013) Association between heart rate variability and fluctuations in resting-state functional connectivity. Neuroimage 68:93–104. 10.1016/j.neuroimage.2012.11.038 [DOI] [PMC free article] [PubMed] [Google Scholar]
- Critchley HD, Mathias CJ, Josephs O, O'Doherty J, Zanini S, Dewar BK, Cipolotti L, Shallice T, Dolan RJ (2003) Human cingulate cortex and autonomic control: converging neuroimaging and clinical evidence. Brain 126:2139–2152. 10.1093/brain/awg216 [DOI] [PubMed] [Google Scholar]
- Deco G, Hugues E (2012) Neural network mechanisms underlying stimulus driven variability reduction. PLoS Comput Biol 8:e1002395. 10.1371/journal.pcbi.1002395 [DOI] [PMC free article] [PubMed] [Google Scholar]
- Eckberg DL. (2009) Point:Counterpoint: Respiratory sinus arrythmia is due to a central mechanism vs respiratory sinus arrhythmia is due to the baroreflex mechanism. J Appl Physiol 106:1740–1744. 10.1152/japplphysiol.91107.2008 [DOI] [PubMed] [Google Scholar]
- Faisal AA, Selen LP, Wolpert DM (2008) Noise in the nervous system. Nat Rev Neurosci 9:292–303. 10.1038/nrn2258 [DOI] [PMC free article] [PubMed] [Google Scholar]
- Fridericia LS. (2003) The duration of systole in an electrocardiogram in normal humans and in patients with heart disease. Ann Noninvasive Electrocardiol 8:343–351. 10.1046/j.1542-474X.2003.08413.x [DOI] [PMC free article] [PubMed] [Google Scholar]
- Frysinger RC, Harper RM (1989) Cardiac and respiratory correlations with unit discharge in human amygdala and hippocampus. Electroencephalogr Clin Neurophysiol 72:463–470. 10.1016/0013-4694(89)90222-8 [DOI] [PubMed] [Google Scholar]
- Frysinger RC, Harper RM (1990) Cardiac and respiratory correlations with unit discharge in epileptic human temporal lobe. Epilepsia 31:162–171. 10.1111/j.1528-1167.1990.tb06301.x [DOI] [PubMed] [Google Scholar]
- Fyhn M, Molden S, Witter MP, Moser EI, Moser MB (2004) Spatial representation in the entorhinal cortex. Science 305:1258–1264. 10.1126/science.1099901 [DOI] [PubMed] [Google Scholar]
- Gianaros PJ, Wager TD (2015) Brain-body pathways linking psychological stress and physical health. Curr Dir Psychol Sci 24:313–321. 10.1177/0963721415581476 [DOI] [PMC free article] [PubMed] [Google Scholar]
- Gianaros PJ, Van Der Veen FM, Jennings JR (2004) Regional cerebral blood flow correlates with heart period and high-frequency heart period variability during working-memory tasks: Implications for the cortical and subcortical regulation of cardiac autonomic activity. Psychophysiology 41:521–530. 10.1111/1469-8986.2004.00179.x [DOI] [PMC free article] [PubMed] [Google Scholar]
- Gilbert CD, Sigman M (2007) Brain states: Top-down influences in sensory processing. Neuron 54:677–696. 10.1016/j.neuron.2007.05.019 [DOI] [PubMed] [Google Scholar]
- Gómez-Isla T, Price JL, McKeel DW Jr, Morris JC, Growdon JH, Hyman BT (1996) Profound loss of layer II entorhinal cortex neurons occurs in very mild Alzheimer's disease. J Neurosci 16:4491–4500. 10.1523/JNEUROSCI.16-14-04491.1996 [DOI] [PMC free article] [PubMed] [Google Scholar]
- Goris RL, Movshon JA, Simoncelli EP (2014) Partitioning neuronal variability. Nat Neurosci 17:858–865. 10.1038/nn.3711 [DOI] [PMC free article] [PubMed] [Google Scholar]
- Greicius MD, Srivastava G, Reiss AL, Menon V (2004) Default-mode network activity distinguishes Alzheimer's disease from healthy aging: evidence from functional MRI. Proc Natl Acad Sci U S A 101:4637–4642. 10.1073/pnas.0308627101 [DOI] [PMC free article] [PubMed] [Google Scholar]
- Harris CM, Wolpert DM (1998) Signal-dependent noise determines motor planning. Nature 394:780–784. 10.1038/29528 [DOI] [PubMed] [Google Scholar]
- Hochberg Y, Benjamini Y (1990) More powerful procedures for multiple significance testing. Stat Med 9:811–818. 10.1002/sim.4780090710 [DOI] [PubMed] [Google Scholar]
- Hopkins DA, Holstege G (1978) Amygdaloid projections to the mesencephalon, pons and medulla oblongata in the cat. Exp Brain Res 32:529–547. [DOI] [PubMed] [Google Scholar]
- Iwata J, Chida K, LeDoux JE (1987) Cardiovascular responses elicited by stimulation of neurons in the central amygdaloid nucleus in awake but not anesthetized rats resemble conditioned emotional responses. Brain Res 418:183–188. 10.1016/0006-8993(87)90978-4 [DOI] [PubMed] [Google Scholar]
- Kass RE, Raftery AE (1995) Bayes factors. J Am Stat Assoc 90:773–795. 10.1080/01621459.1995.10476572 [DOI] [Google Scholar]
- Keshtkaran MR, Yang Z (2014) A fast, robust algorithm for power line interference cancellation in neural recording. J Neural Eng 11:026017. 10.1088/1741-2560/11/2/026017 [DOI] [PubMed] [Google Scholar]
- Lacey BC, Lacey JI (1978) Two-way communication between the heart and the brain: significance of time within the cardiac cycle. Am Psychol 33:99–113. 10.1037/0003-066X.33.2.99 [DOI] [PubMed] [Google Scholar]
- Ladenbauer J, McKenzie S, English DF, Hagens O, Ostojic S (2018) Inferring and validating mechanistic models of neural microcircuits based on spike-train data. bioRxiv. Advance online publication. Retrieved June 13, 2018 10.1101/261016 10.1101/261016 [DOI] [PMC free article] [PubMed] [Google Scholar]
- Liang F, Paulo R, Molina G, Clyde M a, Berger JO (2008) Mixtures of g priors for Bayesian variable selection. J Am Stat Assoc 103:410–423. 10.1198/016214507000001337 [DOI] [Google Scholar]
- Maris E, Oostenveld R (2007) Nonparametric statistical testing of EEG- and MEG-data. J Neurosci Methods 164:177–190. 10.1016/j.jneumeth.2007.03.024 [DOI] [PubMed] [Google Scholar]
- Massimini M, Porta A, Mariotti M, Malliani A, Montano N (2000) Heart rate variability is encoded in the spontaneous discharge of thalamic somatosensory neurones in cat. J Physiol 526:387–396. 10.1111/j.1469-7793.2000.t01-1-00387.x [DOI] [PMC free article] [PubMed] [Google Scholar]
- McDonnell MD, Ward LM (2011) The benefits of noise in neural systems: bridging theory and experiment. Nat Rev Neurosci 12:415–426. 10.1038/nrn3061 [DOI] [PubMed] [Google Scholar]
- McGinley MJ, Vinck M, Reimer J, Batista-Brito R, Zagha E, Cadwell CR, Tolias AS, Cardin JA, McCormick DA (2015) Waking state: rapid variations modulate neural and behavioral responses. Neuron 87:1143–1161. 10.1016/j.neuron.2015.09.012 [DOI] [PMC free article] [PubMed] [Google Scholar]
- Oostenveld R, Fries P, Maris E, Schoffelen JM (2011) FieldTrip: Open source software for advanced analysis of MEG, EEG, and invasive electrophysiological data. Comput Intell Neurosci 2011:156869. [DOI] [PMC free article] [PubMed] [Google Scholar]
- Oppenheimer SM, Gelb A, Girvin JP, Hachinski VC (1992) Cardiovascular effects of human insular cortex stimulation. Neurology 42:1727–1732. 10.1212/WNL.42.9.1727 [DOI] [PubMed] [Google Scholar]
- Pandya DN, Van Hoesen GW, Mesulam MM (1981) Efferent connections of the cingulate gyrus in the rhesus monkey. Exp Brain Res 42:319–330. [DOI] [PubMed] [Google Scholar]
- Park HD, Correia S, Ducorps A, Tallon-Baudry C (2014) Spontaneous fluctuations in neural responses to heartbeats predict visual detection. Nat Neurosci 17:612–618. 10.1038/nn.3671 [DOI] [PubMed] [Google Scholar]
- Parvizi J, Rangarajan V, Shirer WR, Desai N, Greicius MD (2013) The will to persevere induced by electrical stimulation of the human cingulate gyrus. Neuron 80:1359–1367. 10.1016/j.neuron.2013.10.057 [DOI] [PMC free article] [PubMed] [Google Scholar]
- Pitkänen A, Pikkarainen M, Nurminen N, Ylinen A (2000) Reciprocal connections between the amygdala and the hippocampal formation, perirhinal cortex, and postrhinal cortex in rat: A review. Ann N Y Acad Sci 911:369–391. 10.1111/j.1749-6632.2000.tb06738.x [DOI] [PubMed] [Google Scholar]
- Pool JL, Ransohoff J (1949) Autonomic effects on stimulating rostral portion of cingulate gyri in man. J Neurophysiol 12:385–392. 10.1152/jn.1949.12.6.385 [DOI] [PubMed] [Google Scholar]
- Poulet JF, Petersen CC (2008) Internal brain state regulates membrane potential synchrony in barrel cortex of behaving mice. Nature 454:881–885. 10.1038/nature07150 [DOI] [PubMed] [Google Scholar]
- Price JL, Amaral DG (1981) An autoradiographic study of the projections of the central nucleus of the monkey amygdala. J Neurosci 1:1242–1259. 10.1523/JNEUROSCI.01-11-01242.1981 [DOI] [PMC free article] [PubMed] [Google Scholar]
- Quiroga RQ, Nadasdy Z, Ben-Shaul Y (2004) Unsupervised spike detection and sorting with wavelets and superparamagnetic clustering. Neural Comput 16:1661–1687. 10.1162/089976604774201631 [DOI] [PubMed] [Google Scholar]
- Raimondo F, Rohaut B, Demertzi A, Valente M, Engemann DA, Salti M, Fernandez Slezak D, Naccache L, Sitt JD (2017) Brain–heart interactions reveal consciousness in noncommunicating patients. Ann Neurol 82:578–591. 10.1002/ana.25045 [DOI] [PubMed] [Google Scholar]
- Rebollo I, Devauchelle AD, Béranger B, Tallon-Baudry C (2018) Stomach–brain synchrony reveals a novel, delayed-connectivity resting-state network in humans. Elife 7:e33321. 10.7554/eLife.33321 [DOI] [PMC free article] [PubMed] [Google Scholar]
- Reis DJ, Oliphant MC (1964) Bradycardia and tachycardia following electrical stimulation of the amygdaloid region in monkey. J Neurophysiol 27:893–912. 10.1152/jn.1964.27.5.893 [DOI] [PubMed] [Google Scholar]
- Schwaber JS, Kapp BS, Higgins GA, Rapp PR (1982) Amygdaloid and basal forebrain direct connections with the nucleus of the solitary tract and the dorsal motor nucleus. J Neurosci 2:1424–1438. 10.1523/JNEUROSCI.02-10-01424.1982 [DOI] [PMC free article] [PubMed] [Google Scholar]
- Selimbeyoglu A, Parvizi J (2010) Electrical stimulation of the human brain: perceptual and behavioral phenomena reported in the old and new literature. Front Hum Neurosci 4:46. [DOI] [PMC free article] [PubMed] [Google Scholar]
- Sevcencu C, Struijk JJ (2010) Autonomic alterations and cardiac changes in epilepsy. Epilepsia 51:725–737. 10.1111/j.1528-1167.2009.02479.x [DOI] [PubMed] [Google Scholar]
- Smith W. (1945) The functional significance of the rostral cingular cortex and revealed by its responses to electrical stimulation. J Neurophysiol 8:241–255. 10.1152/jn.1945.8.4.241 [DOI] [Google Scholar]
- Somsen RJ, Jennings JR, Van der Molen MW (2004) The cardiac cycle time effect revisited: temporal dynamics of the central-vagal modulation of heart rate in human reaction time tasks. Psychophysiology 41:941–953. 10.1111/j.1469-8986.2004.00241.x [DOI] [PubMed] [Google Scholar]
- Spyer KM. (1994) Annual review prize lecture. Central nervous mechanisms contributing to cardiovascular control. J Physiol 474:1–19. 10.1113/jphysiol.1994.sp019997 [DOI] [PMC free article] [PubMed] [Google Scholar]
- Stock G, Schlör KH, Heidt H, Buss J (1978) Psychomotor behaviour and cardiovascular patterns during stimulation of the amygdala. Pflugers Arch 376:177–184. [DOI] [PubMed] [Google Scholar]
- Task Force of the European Society of Cardiology and the North American Society of Pacing and Electrophysiology (1996) Heart rate variability. Standards of measurement, physiological interpretation, and clinical use. Circulation 93:1043–1065. [PubMed] [Google Scholar]
- Ter Horst GJ, Hautvast RW, De Jongste MJ, Korf J (1996) Neuroanatomy of cardiac activity-regulating circuitry: A transneuronal retrograde viral labelling study in the rat. Eur J Neurosci 8:2029–2041. [DOI] [PubMed] [Google Scholar]
- Thayer JF, Åhs F, Fredrikson M, Sollers JJ 3rd, Wager TD (2012) A meta-analysis of heart rate variability and neuroimaging studies: Implications for heart rate variability as a marker of stress and health. Neurosci Biobehav Rev 36:747–756. 10.1016/j.neubiorev.2011.11.009 [DOI] [PubMed] [Google Scholar]
- Tomson T, Ericson M, Ihrman C, Lindblad LE (1998) Heart rate variability in patients with epilepsy. Epilepsy Res 30:77–83. 10.1016/S0920-1211(97)00094-6 [DOI] [PubMed] [Google Scholar]
- Tort ABL, Brankačk J, Draguhn A (2018) Respiration-entrained brain rhythms are global but often overlooked. Trends Neurosci 41:186–197. 10.1016/j.tins.2018.01.007 [DOI] [PubMed] [Google Scholar]
- Verberne AJ, Owens NC (1998) Cortical modulation of the cardiovascular system. Prog Neurobiol 54:149–168. [DOI] [PubMed] [Google Scholar]
- Westerhaus MJ, Loewy AD (2001) Central representation of the sympathetic nervous system in the cerebral cortex. Brain Res 903:117–127. [DOI] [PubMed] [Google Scholar]