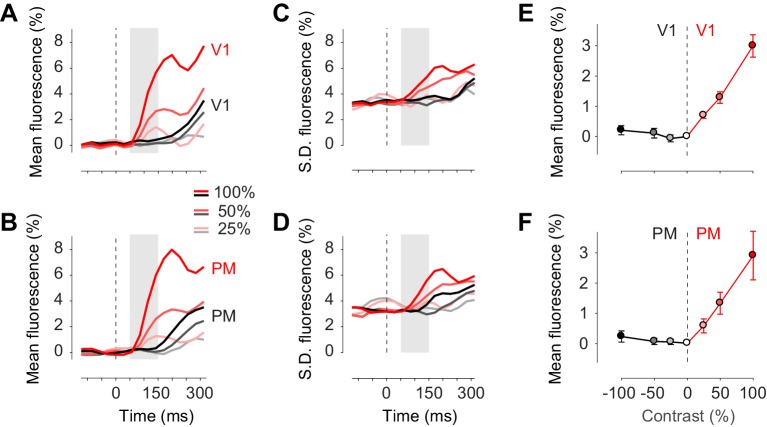
Figure 4. Task stimuli evoke unilateral responses and do not quench bilateral fluctuations.
(A) Mean calcium signal across trials from seven animals in the right stimulated V1 (red) and in the left unstimulated V1 (black). Time period of 50–150 ms after stimulus onset (shaded area) was used for subsequent analysis of visually evoked response. (B) Same as (A) in PM. (C.D) Same as panels (A) and (B) for standard deviation across trials. (E) Average neural activity 50–150 ms after visual stimulation to different contrasts (contrast-response curve) in V1. Activity in the stimulated and unstimulated V1 is shown as red and black lines. Error bars indicate S.E. across seven animals. (F) Same as panel (E) in PM.

