Abstract
In high-resolution imagery, shadows may cause problems in object segmentation and recognition due to their low reflectance. For instance, the spectral reflectance of shadows and water are similar, particularly in the visible band. In precision agriculture, the vegetation condition in terms of plant water use, plant water stress, and chlorophyll content can be estimated using vegetation indices. Normalized Difference Vegetation Index (NDVI), Leaf Area Index (LAI) and Enhanced Vegetation Index (EVI) are widely used vegetation indices for characterizing the condition of the vegetation. In addition, many soil indices have been developed for describing soil characteristics, such as Soil-Adjusted Vegetation Index (SAVI). However, shadows can have an influence on the performance of these vegetation and soil indices.Moreover, enhancing spatial resolution heightens the impact of shadows in the imagery. In this study, the behavior of vegetation and soil indices are evaluated using four sets of high-resolution imagery captured by the Utah State University AggieAir unmanned aerial vehicle (UAV) system. These indices were obtained from flights conducted in 2014, 2015, and 2016 over a commercial vineyard located in California for the USDA Agricultural Research Service Grape Remote sensing Atmospheric Profile and Evapotranspiration Experiment (GRAPEX) Program. Different shadow restoration methods are used to alleviate the impact of shadows in information products that might be developed from the high-resolution imagery. The histogram pattern of vegetation and soil indices before and after shadow compensation, are compared using sanalysi of variance (ANOVA). The results of this study indicate how shadows can affect the vegetation/soil indices and whether shadow compensation methods are able to remove the statistical difference between sunlit and shadowed vegetation/soil indices.
Keywords: shadow restoration, NDVI, LAI, EVI, SAVI, Vineyard, GRAPeX, ANOVA
1. Introduction
In aerial images, shadows appear when part or all of elevated objects such as clouds, mountains, building, and trees block solar illumination. Although shadow features (mostly shadow length) contain geometric information such as the height and the shape of the object (Lillesand and Kiefer, 2000 [10])and also the position of the light source (Bethsda, 1997 [3]) (Sirmacek and Unsalan, 2008 [17]), they hamper extractionof useful information from the spectral data. Shadows cause a reduction in reflectance, thereby leading to attenuation in the accuracy classificationof map (Saha et al., 2005 [15]) or change detection (Liu and Yamazaki, 2012 [11]) or even misinterpretation of biophysical parameters (Lorenzi et al. 2012 [12]) from remotely sensed data. Hence, development of shadow detection and restoration techniques for satellite imagery has received widespread attention.
Many research studies have focused on removing shadows from satellite imagery. Ma et al (2008) [13] presented a robust method for shadow segmentation and compensation for IKNOS images using Normalized Saturation-Value Difference Index (NSVDI) in Hue-Saturation-Value (HSV) and histogram matching. The results showed that some dark objects like water still cannot be separated from shadow pixels using this approach. Wu and Bauer (2013) [19] used both pixel-based and object-based algorithms for detecting shadows from QuickBird images. Also, they employed a k-nearest neighbor algorithm and linear correlation correction for the spectroradiometric restoration. The results indicated that the pixel-based method can recognize more shaded pixels than object-based algorithms and that both restoration methods significantly reduced the shaded area. Wang et al. (2008) [18] proposed a new shadow restoration algorithm called “shadow restoration by matching the statistical feature of neighboring pixels” and tested using QuickBird imagery. The results for this method illustrated its high speed and high degree of automation in recovering weak spectral information in the shaded pixels. Zhang and Chen (2010) [20] classified high-resolution imagery from QuickBird satellite into shadow, non-shadow, and transition regions using a semi-automated human-computer interaction and then equalized the histogram of the shaded pixels to the non-shaded pixels using histogram transformation. Based on visual inspection, the recovered images showed significant enhancement. One of the advantage of this approach is that it requires no prior knowledge about scenes or the position of the illumination source. Liu and Yamazaki (2012) [11] employed an object-based classification method for shadow detection and a linear function for shadow correction. The semi-automated shadow-correction method is applied to high-resolution images from the QuickBird and WorldView-2 satellites. This method showed a significant restoration of NDVI from the recovered brightness values while remaining highly sensitive to shadow impact.
According to the literature reviews, the impact of shadows is more pronounced in the high-resolution imagery captured by satellites such as IKONOS and QuickBird. Thus, the influence of shadows on the super-high-resolution (finer than 0.5m) images provided by UAVs should be even more significant. Given the recent advances in UAV capabilities for monitoring agricultural fields and urban areas, evaluation of different shadow detection and correction method continues to be an important topic, particularly as it relates to minimizing errors in precision agriculture. However, few studies have been conducted that evaluate the performance of the shadow detection and restoration in high-resolution imagery for monitoring crop conditions.
In precision agriculture, numerous empirical equations have been developed based on soil and vegetation indices. For instance, investigations proved that there is a strong correlation between NDVI and leaf area index (LAI) (Fuentes et al. 2014 [5]), plant water stress (Jones et al, 2004 [9]), net primary production (Goward et al 1985 [6]), gross primary production (Hashimoto, 2012 [7]), and evapotranspiration (Nemani and Running. 1989 [14]). The question remains whether the behavior of soil/vegetation indices are different in sunlit and shaded parts of aerial imagery. A significant difference could lead to a bias in the results of empirical or even semi-empirical models.
In the present study, the behavior of vegetation/soil indices is evaluated in shaded and non-shaded parts of high resolution UAV imagery. Then the performance of the two dominant shadow compensation methods, linear-correlation correction and gamma correction, are assessed for vegetation and soil indices.
2. Methods
2.1. Study Area
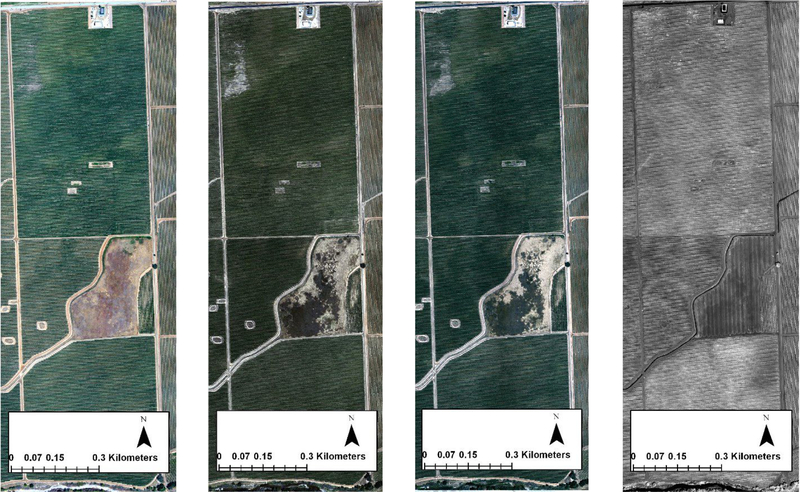
Four sets of super high-resolution imagery (20 cm and finer) were captured by a fixed wing UAV over a vineyard located near Lodi, California (38.29 N 121.12 W), in Sacramento County as a part of the GRAPEX project. These images were captured in August, 2014, June and July 2015, and May 2016 near the times when Landsat satellite passed over the field. The fixed wing UAV was operated by the AggieAir Remote Sensing Group at the Utah Water Research Laboratory at Utah State University. The canopy height was about 2 m, and the row spacing was about 3.35 m. Aerial images of the study area captured by the AggieAir UAV are shown in Fig 1, and detailed information about the images is summarized in Table 1.
Fig 1.
Aerial images of the study area captured by the AggieAir UAV on August 2014 (a), June 2015 (b), July 2015 (c), and May 2016 (d)
Table 1:
Dates, times, cameras, and optical filters used in the UAV to capture images
| Date | UAV Flight Time (PDT) | Cameras and Optical Filters | |||
|---|---|---|---|---|---|
| Launch Time | Landing Time | RGB | NIR | Spectral Response | |
| 9-Aug-14 | 11:30 AM | 11:50 AM | Cannon S95 | Cannon S95 modified (Manufacturer NIR block filter removed) | RGB: typical CMOS NIR: extended CMOS NIR + Kodak Wratten 750 nm LongPass filter |
| 2-Jun-15 | 11:21AM | 12:06 PM | Lumenera Lt65R Color | Lumenera Lt65R Monochrome | RGB: typical CMOS NIR: Schneider 820 nm LongPass filter |
| 11-Jul-15 | 11:26 AM | 12:00 PM | Lumenera Lt65R Color | Lumenera Lt65R Monochrome | RGB: typical CMOS NIR: Schneider 820 nm LongPass filter |
| 2-May-16 | 12:53 PM | 1:17 PM | Lumenera Lt65R Mono | Lumenera Lt65R Mono | RED: Landsat 8 Red Filter equivalent NIR: Landsat 8 NIR Filter equivalent |
The 2014 and 2015 images include five bands (Red, Green, Blue, NIR, and Thermal), and the 2016 image has three bands (Red, NIR, and Thermal). As described in Table 1, The UAV used point-and-shoot Canon S95 cameras in 2014 and industrial type Lumenera Lt65R cameras fitted with narrowband filters equivalent to Landsat 8 specifications in 2015 and 2016. For each of these images, radiometric calibration, image mosaicking and orthorectification were done by the AggieAir team. In radiometric calibration, the digital images are converted into reflectance by estimating the ratio of reference images from pre- and post-flight reference panel readings. In the image mosaicking and orthorectification processes, all images were combined into one large mosaic with a local coordinate system (WGS84 N10) using the Agisoft [2] software and GPS ground measurements. A further discussion about image pre-processing and a sensor description can be found in Elarab et al. (2015) [4].
2.2. Methodology
The process of the study is illustrated in Fig 2.
Fig 2.
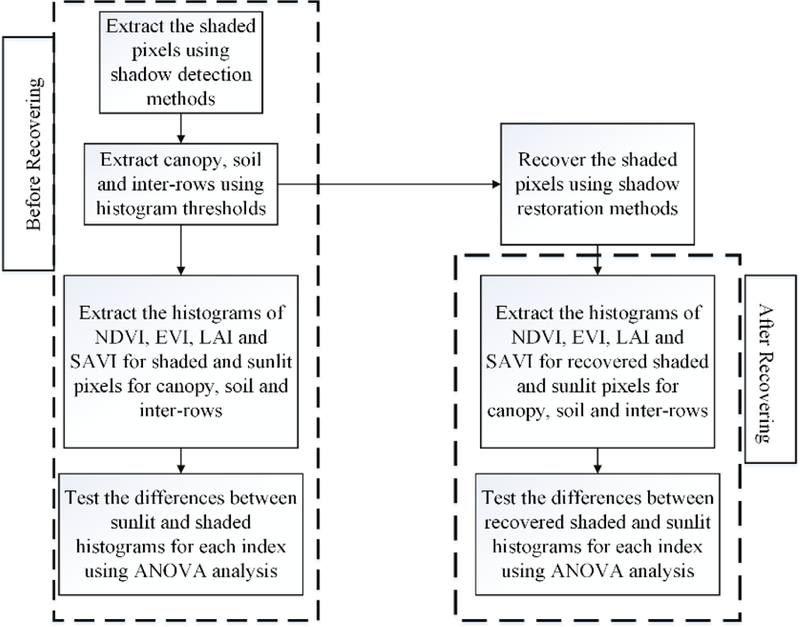
A flowchart illustrating the process of the study
Figure 2 provides a graphical description of the workflow for this study. Before the recovering procedure, the shaded pixels are detected using the index-based method presented by Aboutalebi et al. (2017) [1]. Then the canopy, soil and inter-rows are separated from each other using thresholds from the histogram of NDVI. Next, the histograms of NDVI, EVI, LAI and SAVI are extracted for shaded and non-shaded pixel over the canopy, soil and inter-rows. To statistically determine the impact of shadows on each of the indices, an analysis of variance (ANOVA) was implemented. The ANOVA analysis compares the mean of each index on shadowed and non-shadowed pixels over the canopy, soil and inter-rows. Afterwards, the shaded pixels are recovered using two dominant shadow compensation techniques: “Linear Correlation Correction” (Eq. 5) and “Gamma Correction” (Eq. 6). After recovering, the histograms of the indices are extracted for sunlit and recovered shaded pixels of canopy, soil and inter-rows. Moreover, ANOVA analysis is implemented again to evaluate the performance of each of shadow compensation method.
2.2.3. Soil and Vegetation indices
In this study, the behavior of four different indices in sunlit and shaded pixels are evaluated. These indices are NDVI, LAI, EVI and SAVI. The formulations are as follows:
| (1) |
| (2) |
| (3) |
| (4) |
in which R, B, G, and NIR = reflectance at red, blue, green, and near-infrared wavelengths. C1, C2 are coefficient used to correct aerosol scattering in EVI. In general, D1 = 2.5, D2 = 1, C1 = 6, C2 = 7. (Huete et al. 1997 [8]). The value of L depends upon the cover of green vegetation; in very dense vegetation, L = 0 and for the bare soil L = 1. In general, L = 0.5 works well for most situation.
2.2.4. Linear Correlation Correction (LCC)
Linear correlation correction (LCC) is one of the shadow compensation methods that relates the recovered digital number for the shaded pixels to standard deviation and the mean value of shaded and sunlit pixels using a linear function. This linear function can be defined as Eq. 5 (Sarabandi et al. 2004 [16])
| (5) |
in which DNrecovered = digital number for recovered shaded pixels, DNshadow = digital number for shaded pixels, σnon-shadow = standard deviation of sunlit pixels, σshadow = standard deviation of shaded pixels, μshadow = mean of shaded pixels, μnonshadow = mean of sunlit pixels.
2.2.5. Gamma Correction
Gamma correction is another shadow compensation technique that tries to recover the shaded pixels using a nonlinear function. This non-linear function can be defined as Eq. 6
| (6) |
where γ is a parameter that can be determined using Eq. 7
| (7) |
in which = mean of logarithmic value of digital number for shaded pixels, = mean of logarithmic value of digital number for sunlit pixels.
2.2.6. ANOVA
To test the mean of equality of two histograms, ANOVA was used as in Eq. 8 and Eq. 9. The null and alternative hypotheses for evaluating differences between soil/vegetation indices on sunlit versus shaded or sunlit versus recovered shaded pixels are as follows:
| (8) |
| (9) |
in which H0 and H1 are the null (the average of the two populations are similar) and alternative hypotheses, respectively, and µ1 and µ2 are the mean of the two groups.
3. Results and Discussion
3.1. Histograms Before and After shadow restoration
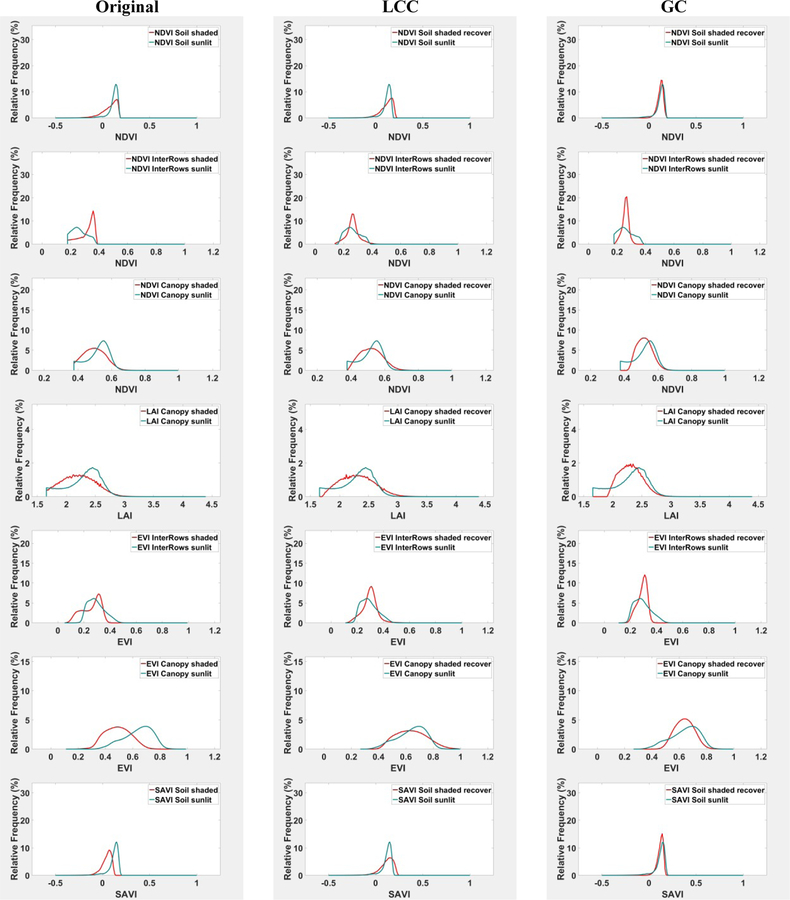
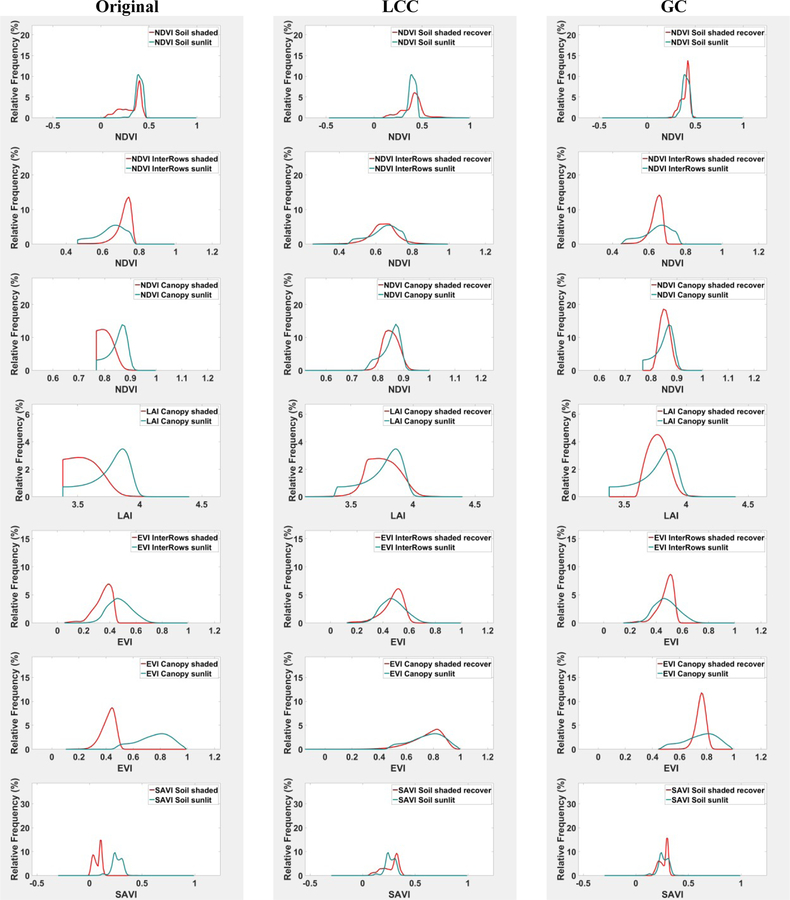
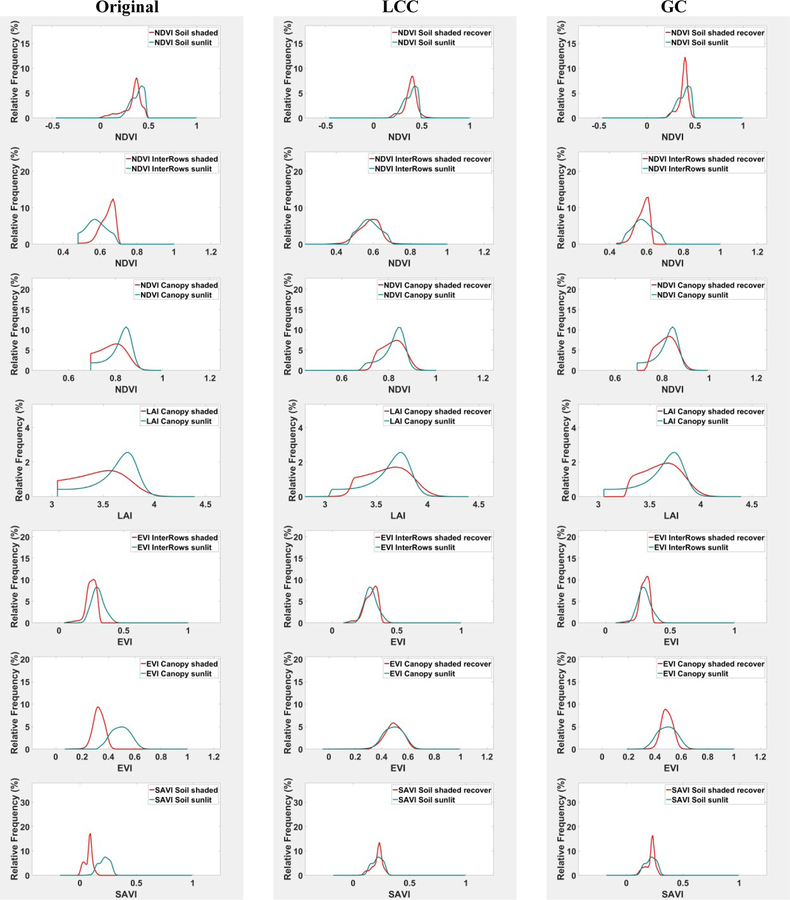
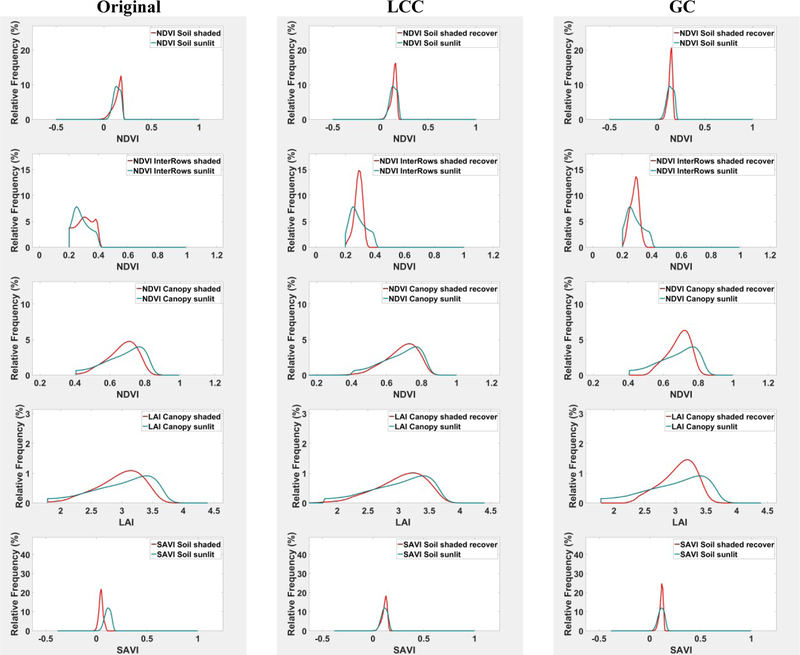
The histograms of aforementioned indices for 2014, June 2015, July 2015, and 2016 flights are shown in Figs 3, 4, 5, and 6, respectively.
Fig 3.
Soil/vegetation indices histograms the for 2014 original imagery and after shaded recovering using LCC and GC
Fig 4.
Soil/vegetation indices histograms the for June 2015 original imagery and after shaded recovering using LCC and GC
Fig 5.
Soil/vegetation indices histograms the for July 2015 original imagery and after shaded recovering using LCC and GC
Fig 6.
Soil/vegetation indices histograms the for 2016 original imagery and after shaded recovering using LCC and GC
Figs 3–6 illustrate the histograms of soil/vegetation indices for the original imagery and recovered imagery using LCC and GC. From visual inspection of the histograms from the original images, it is evident that the difference is mostly in the mean value of the histograms of the shaded and sunlit pixels before applying shadow compensation techniques. Also, we can conclude that NDVI, LAI, EVI and SAVI in sunlit pixels have higher values than those same indices in shaded pixels, except for NDVI in inter-rows. This part of the results shows the importance of shadow compensation techniques when we want to use empirical equations in which those soil/vegetation indices are critical parameters, particularly with very high-resolution imagery. It should be noted that EVI cannot be calculated for the 2016 flight because it has only R, NIR, and thermal bands. Concerning the results of shadow restoration techniques, we can conclude that the performance of LCC, in general, is better than GC. However, the recovered shaded pixels cannot lead to a good estimation of EVI from inter-rows and NDVI form the canopy. It seems GC fails in recovering indices calculated over the vegetated area. The results of ANOVA analysis are summarized in Table 2. The “x” in each cell indicates a significant difference between the histograms of those indices in shaded and sunlit pixels. Table 2. The results of ANOVA for the soil/vegetation indices before and after shadow compensation
Table 2.
The results of ANOVA for the soil/vegetation indices before and after shadow compensation
| Indices | 2014 | June 2015 | July 2015 | 2016 | ||||||||
|---|---|---|---|---|---|---|---|---|---|---|---|---|
| Original | LCC | GC | Original | LCC | GC | Original | LCC | GC | Original | LCC | GC | |
| NDVI-Soil | x | x | x | |||||||||
| NDVI-Inter-row | x | x | x | x | x | x | ||||||
| NDVI-Canopy | x | x | x | x | x | x | x | x | x | x | x | x |
| LAI-Canopy | x | x | x | x | x | x | x | x | x | x | x | x |
| EVI-Inter-row | x | x | x | x | x | x | x | - | - | - | ||
| EVI-Canopy | x | x | x | x | x | - | - | - | ||||
| SAVI-Soil | x | x | x | x | ||||||||
Table 2 shows a significant difference in the mean of the soil/vegetation indices in sunlit and shaded for original images, except for NDVI calculated for the soil in the 2016 imagery. According to Table 2, after recovering the shaded pixels using both LCC and GC, there is no significant difference in NDVI and SAVI calculated for the soil component, which is a smooth surface without any rapid changes in elevation and slope. In the comparison of LCC versus GC, we can see that the mean of NDVI (in inter-rows) and EVI (in canopy) calculated from recovered shaded pixels using LCC matches with the mean of those indices in sunlit regions. However, after compensating for the shadows using both techniques, there are still significant differences in EVI (in inter-rows) and NDVI (in canopy) in sunlit pixels versus EVI (in inter-rows) and NDVI (in canopy) in recovered shaded pixels.
4. Conclusion
Shadows are an unavoidable component of high-resolution RS imagery, and the impact of shadows will increase as the spatial resolution of the imagery increases. In this study, the behavior of soil and vegetation indices has been evaluated in shaded and sunlit pixels over different components before and after recovering shadows. Two different shadow compensation methods, LCC and GC, were employed to recover the shaded pixels in very-high-resolution images captured by a UAV at various times over a GRAPEX vineyard. The results from visual and statistical assessments indicated a significant difference between soil/vegetation indices in sunlit and shaded pixels. This difference can be diminished by applying shadow restoration techniques. Though the performance of LCC, generally, was better than GC, both fail in recovering EVI over the inter-rows and NDVI over the canopy with rapidly changing slope and elevation. It seems LCC and GC work very well in correcting shadows over smooth surfaces such as soil, particularly in NDVI and SAVI for the soil component. Evaluating other statistical shadow restoration techniques or developing a new shadow recovery method is needed to recover the shaded pixels over the vegetated area. Since a significant difference exists between soil/vegetation indices in sunlit and shaded pixels, shadow restoration techniques must be employed before using the empirical equation developed based on these indices.
Acknowledgement
This project was financially supported under Cooperative Agreement No. 58–8042-7–006 from the U.S. Department of Agriculture, by award No. 200906 NNX17AF51G from NASA, and by the Utah Water Research Laboratory at Utah State University. The authors wish to thank E&J Gallo Winery for their continued collaborative support of this research, and the AggieAir UAV Remote Sensing Group at the Utah Water Research Laboratory for their UAV technology and their skill and hard work in acquiring the scientific quality, high-resolution aerial imagery used in this project.
References
- [1].Aboutalebi M Torres-Rua A, McKee M, Kustas WP, Nieto H “Evaluation of different shadow detection and restoration methods and their impact on vegetation indices using UAV high-resolution imageries over vineyards” AGU Fall meeting (2017). [Google Scholar]
- [2].AgiSoft, L. L. C., and Russia St Petersburg. “Agisoft photoscan.” Professional Edition (2016). [Google Scholar]
- [3].Bethsda MD “Manual of Photographic Interpretation” 2nd edition, American Society Photogrammetry and remote sensing (ASPRS) (1997). [Google Scholar]
- [4].Elarab M, Ticlavilca AM, Torres-Rua AF, Maslova I, and McKee M “Estimating chlorophyll with thermal and broadband multispectral high resolution imagery from an unmanned aerial system using relevance vector machines for precision agriculture” International Journal of Applied Earth Observation and Geoinformation 43, 32–42 (2015). [Google Scholar]
- [5].Fuentes S, Poblete-Echeverra C, Ortega-Farias S, Tyerman S, and De Bei R “Automated estimation of leaf area index from grapevine canopies using cover photography video and computational analysis methods” Australian Journal of Grape Wine Research 20(3), 465–473 (2014). [Google Scholar]
- [6].Goward SN, Tucker CJ, and Dye DG “North American vegetation patterns observed with the NOAA-7 advanced very high resolution radiometer” Plant Ecology, 64(1), 3–14 (1985). [Google Scholar]
- [7].Hashimoto H, Wang W, Milesi C, et al. “Exploring simple algorithms for estimating gross primary production in forested areas from satellite data” Remote Sensing, 4, 303–326 (2012). [Google Scholar]
- [8].Huete AR, Liu HQ, Batchily K, and YanLeeuwen W “A comparison of vegetation indices global set of TM images for EOS-MODIS” Remote Sensing of Environment 59:440–451 (1997). [Google Scholar]
- [9].Jones CL, Weckler PR, Maness NO, Stone ML, and Jayasekara R “Estimating water Stress in Plants Using Hyperspectral Sensing” ASAE/CSAE Annual International Meeting, Ottawa, Ontario, Canada, (2004). [Google Scholar]
- [10].Lillesand TM, and Kiefer RW “Remote Sensing and Image Interpretation” 4th edition. New York, Wiley; (2000). [Google Scholar]
- [11].Liu W, and Yamazaki F “Object-based shadow extraction and correction of high-resolution optical satellite images” IEEE Journal of Selected Topics in Applied Earth Observation and Remote Sesning, 5(4): 1296–1302 (2012). [Google Scholar]
- [12].Lorenzi L, Melgani F and Mercier G “A complete processing chain for shadow detection and reconstruction in VHR images” IEEE Trans. Geosci. Remote Sens, 50(9), 3440–3452 (2012). [Google Scholar]
- [13].Ma H, Qin Q, and Shen X “Shadow segmentation and compensation in high resolution satellite images” in Proc. IEEE IGARSS, 2, 1036–1039 (2008). [Google Scholar]
- [14].Nemani RR, and Running SW “Estimation of regional surface resistance to evapotranspiration from NDVI and thermal IR AVHRR data” Journal of Applied Meteorology, 28, 276 –284 (1989). [Google Scholar]
- [15].Saha KA, Arora MK, Csaplovics E et al. “Land covers classification using IRS LISS III image and DEM in a rugged terrain: A case study in Himalayas” Geocarto International, 20(2): 33–40 (2005). [Google Scholar]
- [16].Sarabandi P, Yamazaki F, Matsuoka M, and Kiremidjian A “Shadow detection and radiometric restoration in satellite high resolution images” Proceedings of IGARSS-2004, Anchorage, Alaska (New York: IEEE; ), CDROM (2004). [Google Scholar]
- [17].Sirmacek B, and Unsalan C “Building detection from aerial images using invariant color features and shadow information” Proceedings of the 23rd International Symposium on Computer and Information Sciences (ISCIS 2008), Istanbul, Turkey, October 27–29, 1–5 (2008). [Google Scholar]
- [18].Wang QJ, Tian QJ, Lin QZ et al. “An improved algorithm for shadow restoration of high spatial resolution imagery” Proceedings of SPIE7123, Remote Sensing of the Environment: 16th National Symposium on Remote Sensing of China, 7123, 1–7 (2008). [Google Scholar]
- [19].Wu J, Bauer ME “Evaluating the effects of shadow detection on QuickBird image classification and spectroradiometric restoration” Remote Sensing 5, 4450–4469 (2013). [Google Scholar]
- [20].Zhang Z and Chen F “A shadow processing method of high spatial resolution remote sensing image” in Proc. 3rd Int. Congr. Image and Signal Processing, 2, 816–820 (2010). [Google Scholar]


