

Summary
Mammalian nephrons arise from a limited nephron progenitor pool through a reiterative inductive process extending over days (mouse) or weeks (human) of kidney development. Here, we present evidence that human nephron patterning reflects a time-dependent process of recruitment of mesenchymal progenitors into an epithelial nephron precursor. Progressive recruitment predicted from high resolution image analysis and 3D reconstruction of human nephrogenesis was confirmed through direct visualization and cell fate analysis of mouse kidney organ cultures. Single-cell RNA sequencing of the human nephrogenic niche provided molecular insights into these early patterning processes and predicted developmental trajectories adopted by nephron progenitor cells in forming segment-specific domains of the human nephron. The temporal-recruitment model for nephron polarity and patterning suggested by direct analysis of human kidney development provides a framework for integrating signaling pathways driving mammalian nephrogenesis.
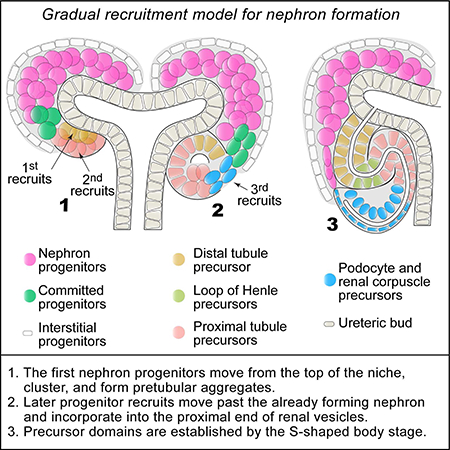
Graphical Abstract
Introduction
The mammalian nephron comprises at least 14 physiologically distinct functional cell-types (Lee et al., 2015). These are organized within segmental domains with a proximal-distal axis of polarity: proximal cell identities generate key components of a filtering structure, the renal corpuscle, while the most distal cells connect the distal tubule segment to the urine transporting collecting duct system (O’Brien and McMahon, 2014). Genetic, cellular and molecular studies predominantly in the mouse have demonstrated that mesenchymal Six2+/Cited1+ nephron progenitor cells (NPCs) undergo a reiterative inductive process that generates a pretubular aggregate (PTA) which epithelializes into a renal vesicle (RV) in conjunction with the parallel branching growth of the adjacent collecting duct network. Morphogenetic processes transform the RV through comma- and s-shaped body stages (CSBs and SSBs) to mature nephron structures (reviewed by Desgrange and Cereghini, 2015; McMahon, 2016).
Aggregation and epithelialization have largely been viewed as tightly coupled processes with nephron patterning initiating after PTA formation and evident in the RV as distinct proximal and distal cellular domains of gene activity (Georgas et al., 2009; Mugford et al., 2009; O’Brien and McMahon, 2014; Yang et al., 2013). Patterning requires regional Wnt, Bmp, Notch, and Fgf-signaling to specify proximal-distal fates (Cheng et al., 2007; Grieshammer et al., 2005; Lindström et al., 2015) through the actions of several transcription factors including Pou3f3, Lhx1, Irx2, Hnf1b, Foxc2, and Mafb (Heliot et al., 2013; Kobayashi et al., 2005; Moriguchi et al., 2006; Nakai et al., 2003; Reggiani et al., 2007; Takemoto et al., 2006). However, the mechanisms initiating axial polarity in early nephron-forming stages are not understood (O’Brien and McMahon, 2014).
We present multiple lines of evidence that RV formation is not a singular event in time. Rather, NPCs are progressively recruited with the time of recruitment predicting proximal-distal cell fate. The findings prompt a reevaluation of nephron patterning pathways in the context of a Time-dependent Cell-fate Acquisition (TCA) model of nephron patterning.
Results
Nephron progenitors stream from the niche into forming nephrons over time.
We recently reported that human SIX2+ NPCs make a continuous connection with the epithelializing renal vesicle (Lindström et al., 2018a; Fig. 1A, B; S1A–C; week 8, 15, 16, and 18). Close scrutiny of the more rapidly developing mouse kidney identified similar structures, albeit infrequently (Lindström et al., 2018a). Thus, the greater temporal resolution of the human nephrogenic program highlights a conserved mode of progenitor recruitment that could significantly impact nephron forming processes (Lindström et al., 2018a, 2018b). In the human kidney, streaming NPCs connecting to PTAs and RVs upregulate LEF1 and PAX8, molecular readouts of NPC induction (Lindström et al., 2018a). Committed NPCs within the stream are primed to incorporate into nascent nephron structures over what is likely an extensive period of time.
Fig.1. Three dimensional images and single-cell RNA-seq analyses show nephron progenitor cells form a continuum from niche to nascent nephron.

(A) Schematic of nephrogenesis from NPC to PTA, RV, and SSB. Colors denote indicated cell fates. Cells connecting NPCs and nascent nephron indicated with ‘*’. (B) Immunofluorescent stain of structures as depicted in (A); cellular connection indicated by arrowheads. (C) Immunofluorescent staining to show a developmental progression from PTA to SSB coupled to changes in the levels of SIX1 and JAG1. Dashed yellow lines indicates where intensity measurements were made and corresponds to x-axis for graph. (D-E) 3D reconstruction of cell-connections (arrowheads) from NPCs to PTA/RV – see also Movie 1. JAG1 and MAFB shown as heatmap signals (green, high; blue, low). (F) Time-lapse of NPCs forming nephrons in the mouse kidney. Culture time as indicated. Four cells marked by numbers 1–4 per nephron. These show the order of inclusion; see also Movies 2–3). (G) Time-lapse and immunofluorescent stains of nephrons and migrating mGFP+ cells; arrowheads indicate mGFP+ cells incorporating into nephron. Genetic strains, fluorescent proteins and immunostains as indicated. UB: ureteric bud, PTA: pretubular aggregate, RV: renal vesicle, SSB: s-shaped body nephron, D: distal, M: Medial, P: Proximal, CNT: connecting tubule, LOHa: loop of Henle anlagen, Pt: proximal tubule, Pe: parietal epithelium, Po: podocytes. See also Supplementary figure 1 and Movies 1–3.
To examine this process, we performed two (Fig.1B, C, S1A–D; week 8, 15, 16, 18) and three-dimensional (3D) (Fig.1D, Movie 1; week 13 and 16) imaging of the developing human kidney. Cell-streaming was persistent from PTA to late RV stages. Expression of NPC markers SIX1 and CITED1 decreased in a proximal-to-distal direction suggesting gradual decay over time from the SIX1/CITED1 producing NPCs (Fig. 1C; S1D). SIX2+ NPCs connected directly to JAG1+ PTAs (Fig.1C: field1, 1D, Movie 1). Interestingly, the cellular connection was structured into two layers suggesting a pre-epithelial segregation of NPC populations within the nephrogenic niche (Fig. 1C; S1A, Movie 1). By the RV stage, the interconnection progressively reduced and eventually exclusively linked to the proximal end of the forming RV (farthest from the ureteric epithelium (Fig. 1C: fields2–4; S1D: fields2–4)) adjacent to early forming MAFB+ podocyte precursors (Fig. 1D; S1B; Movie 1). This organization was readily observed in human fetal kidney samples from weeks 8 to 18 reflecting a general feature of the nephrogenic program (N > 30; Fig. S1C).
Nephron formation can be visualized in real-time using mouse kidney organ culture models. To monitor NPCs and their derivatives, we sporadically labelled NPCs with myristoylated-GFP (mGFP; Six2CreERT2 and Rosa26mTmG strains; Kobayashi et al., 2008 and Muzumdar et al., 2007, respectively), visualizing cells in the subjacent branching ureteric epithelium with either CFP or venus fluorescent proteins (Cdh1CFP and tgHoxb7-Venus; Snippert et al., 2010 and Chi et al., 2009, respectively; Fig 1F–G). Cdh1CFP and tgHoxb7Venus also weakly labelled the distal epithelializing nephron (Fig. 1G; S1E–G; E11.5 and E15.5). Labelled cells were tracked for 24 to 48-hours to monitor their recruitment into the nephron anlagen. Strikingly, NPCs initiating PTA formation were positioned directly adjacent to the ureteric epithelium under the branch tip where they underwent a mesenchymal-to-epithelial transition generating polarized Cdh1CFP+ or tgHoxb7-Venus+ cells (Fig. 1F–G; S1F–G; Movies 2–3; E11.5-E12.5 kidneys). NPCs that arrived later, once a PTA or RV was established, incorporated into the proximal end of the forming nephron precursor (Movie 2–3, Fig.1G). To determine how the positioning of cells related to distinct cellular identities at the RV stage, we performed immunofluorescent whole-mount analysis following time-lapse imaging to examine Wt1 (a proximally-restricted transcriptional determinant) and Jag1 (a distal PTA and medial RV-restricted Notch-ligand) activity in mGFP+ cells. NPCs incorporated early into forming PTAs exhibited a tgHoxb7-Venus+/Jag1low/Wt1- distal identity (Fig.1G-right). The last recruited NPCs displayed a tgHoxb7-Venus-/Jag1-/Wt1high proximal-identity and an epithelial morphology characteristic of proximal-most podocyte/parietal cell fates. Thus, NPCs adopted distinct predictable proximal-distal cell fates depending on the time of their recruitment. Interestingly, distal cells also accumulate a weak endogenous fluorescent signal that may reflect RNA or protein transfer from the adjacent ureteric epithelium.
Single-cell analyses of the human nephron lineage predicts developmental progression of segment-specific fates.
To explore regional patterning during human nephrogenesis, we segregated nephron forming lineages in single-cell transcriptomic data generated from nephron forming regions of two ~17 week human kidneys (Fig.S2A, replicates merged) as previously described (Lindström et al., 2018c). This yielded 3367 cells clustering into cell groups consisting of NPCs (TMEM100+, WASF3+, MEOX1+), NPCs primed for differentiation (HEY1+, LYPD1+), induced/differentiating cells (HES1+, LHX1+, PAX8+), podocyte precursors and podocytes (MAFB+/ PTPRO+), proximal precursors (CDH6+, JAG1+), distal precursors (MAL+, SOX9+), and maturing cell types of the loop of Henle (LOH: SLC12A1+), and proximal (SLC3A1+) and distal (ALDH1A1+, GATA3+) tubules (Fig. 2A–C; Table S1A). In situ hybridization (SISH) for known marker genes confirmed the clusters contained a mixture of early and late precursors for each fate (Fig.S2D; week 15–16). The inclusion of MEOX1+, MAFB+, SLC12A1+ and SLC3A1+, and GATA3+ cells suggested the selected cells comprise primarily of NPC, PTA, RV, and SSB cells, with only rare cells from Capillary Loop Stage nephrons consistent with the cortical isolation procedure (Fig.2A–C; S2D). Hierarchical clustering suggested a close similarity between podocyte precursors (clusters 20 and 21) and NPCs (clusters 2–5), and a more distant relationship between NPCs and tubular precursors (clusters 14–16, 18) (Fig.3C). To explore the developmental relationships between these cellular states we computed the pairwise Bhattacharyya distances between the estimated distributions for corresponding clusters (Bhattacharyya, 1943). These distances reveal a close similarity between podocyte precursors (clusters 20 and 21) and NPCs (clusters 2–5), and a more distant relationship between NPCs and tubular precursors (clusters 14–16, 18) (Fig. 3C). The minimum spanning tree based on these pairwise distances suggests podocytes form via a distinct developmental trajectory compared to the proximal and distal tubular nephron fates (Fig. S3A; Table S1B).
Fig.2. Single-cell RNA-seq analyses of nephrogenic trajectories show differences in the order of segment-fates acquisition.

(A) Unbiased clustering of nephron lineage cells analyzed by single-cell RNA-seq displayed in tSNE plot. (B) Gene expression plots for marker genes; cluster numbers as indicated. (C) Cluster hierarchy indicating cluster similarities and representative differentially expressed genes, dendrogram axis CDD: Cluster Distribution Distance. (D) Pseudotime analysis of nephrogenic lineage (the full step-wise analysis used to break trajectories into single paths is shown in S3C). Proliferating cells branch due to collective cell-cycling signature and the first subsequent split is between tubular proximal/distal precursors and the podocytes. (E) Heatmaps of selected genes’ whose expression changes along predicted pseudotime trajectories and gene expression plots. Differentiation trajectories to podocytes (Path 2), proximal fates (Path 5), and medial, LOH, and distal precursors (Path 6) are shown; path numbers are as indicated in Fig.S3C. (F) Immunofluorescent and in situ hybridization detection of indicated protein or mRNA transcripts for genes with changing expression profiles along pseudotime trajectories. Antibody in red, DAPI in gray, mRNA-probe in blue. NPC: nephron progenitor cell, LOH: Loop of Henle, UB: ureteric bud, CNT: connecting tubule, PTA: pretubular aggregate, RV: renal vesicle, Prolif: proliferating, Prim: primed for differentiation, Diff: differentiating, D: distal segment, M: Medial segment, L: loop of Henle analagen, Pt: Proximal tubule, Pe: Parietal epithelium, Po: Podocyte. Segmented lines in (F) show SSB axis, green segmented line indicates domain with strong protein localization or gene expression. See also Supplementary figures 2–3.
Fig. 3. Gene correlation networks demark nephron segment fates along temporal trajectories.

(A) Gene modules with representative genes highlighted, validated genes in bold, and GO-term analyses. (B) Eigengene expression across single cells. (C) Genes and proteins validated by in situ hybridization and immunofluorescent stains. Dashed line indicates axis of RV or SSB. (D-E) Module-specific smooth spline fitting of the relationship between pseudotime values inferred from Monocle2 as shown in Fig.2D:Path1 and eigengene expression in each single-cell. Pseudotime on the x-axis and eigengene expression on the y-axis. NPC: nephron progenitor cell, RV: renal vesicle, SSB: S-shaped body nephron, LOH: loop of Henle anlagen, CLN: Capillary loop stage nephron, Diff: differentiated. See also Supplementary figure 4.
Pseudotime temporal analyses of the nephrogenic lineage were performed with Monocle 2 to predict the single-cell level differentiation trajectories resulting in proximal-distal positional identities (Qiu et al., 2017; Trapnell et al., 2014). Through reiterative pseudo-temporal analyses, NPCs were again found to generate distinct trajectories to podocytes and to proximal/distal tubule precursor fates (Fig.2D). In pseudotime, NPC clusters were ordered closer to podocyte precursor than distal and proximal precursor (Fig.S3B). Further pseudo-temporal analyses divided precursor fates into 3 paths corresponding to: path2: NPCs to podocyte fate, path5: NPC to proximal precursors, path6: NPC to medial, distal, and loop of Henle precursors (Fig.S3C). Gene expression profiles were identified that predicted specific cell-types identifiable with by known markers (Fig.2E). Representative genes from each group were selected and their regionally-restricted expression along the proximal-distal axis confirmed, validating the modeling of differentiation trajectories (Fig.2F; S3C; week 15–17). The pseudotime differentiation trajectories, along with direct analysis of inter-cluster relationships via distributional distances, are consistent with podocyte fates segregating from the NPC population through a different trajectory than that adopted by cells forming tubular epithelial nephron components.
Gene networks define developing cell identities along a differentiation time line.
To determine if gene-networks linked to cellular identities could be identified directly from their correlation within the single-cells in this dataset, we performed Weighted Gene Correlation Network Analyses (WGCNAs; Langfelder and Horvath, 2008) on the single-cell RNA-seq data. Distinct gene-modules/genesets emerged from this approach (M1-M26; Fig.3A; Table S1C). Thirteen were recognizable by marker genes validated in human kidney analyzes (Lindström et al., 2018a, 2018b, 2018c) and seven of these were enriched for biological process GO-terms linked to the kidney (Fig.3A; Table S1D). The gene-sets correlated closely to cells (Fig.3B), and specific clusters (Fig.S4), suggesting they were linked to known cellular identities. The gene sets identified differentiating cells encompassing a range of maturing signatures (M1M5, M7-M8, M11), as well as mature differentiated signatures of LOH and proximal cell-fates (M9-M10) (Fig.3A,B; S4).
To validate the correlation between gene-sets and specific cell-identities we compared genes with known expression patterns in the mouse kidney (TCF21, NPHS2, ERBB4, MECOM, EMX2, and POU3F3), and uncharacterized genes (CLDN5, OLFM3, ASS1, KDM2B, PAPPA2). Each gene’s expression followed the predicted cell fate assigned to the module; as examples, CLDN5, OLMF3, TCF21 and NPHS2 were expressed within podocytes (M6) though CLDN5 and OLMF3 specifically demarcated developing podocytes from late RV stage to late SSB stage, while TCF21 and NPHS2 were upregulated in maturing podocytes (Fig.3C; S2E). Similarly, ADAMTS1, ASS1, PAPPA2, ERBB4, MECOM, KDM2B, EMX2, and POU3F3 were expressed in the segments predicted by network and tSNE analyses (Fig.3A–C; S2E; week 15–17).
To determine if gene-sets could be linked to pseudo-temporal differentiation-trajectories, we examined the relationship between WGCNA gene-sets and the pseudotime path of the nephrogenic lineage. The NPC gene set (M1) displayed a strong correlation to cells early in the projected differentiation trajectory while proximal, medial/LOH, and distal identity modules peaked later in pseudotime (Fig.3D–E). Expression of the NPC gene-set of the NPC cluster decreased as induction and differentiation modules were activated along pseudotime (Fig.3D) and as in earlier analyses, genes associated with the formation of podocytes were predicted to be activated in cells closer to a NPC state than genes associated with proximal and distal tubular nephron fates (Fig.1–2; Fig.3E). These data combined are consistent with NPCs differentiating directly into podocytes at a late-stage of a protracted program of NPC commitment to the nephron-forming RV.
Novel marker genes for nephron segment fates emerge in positions consistent with gradual recruitment of nephron progenitors over time.
Our data suggest a temporal and spatial order to the emergence of regional domains in the forming nephron. By the SSB stage, distinct proximal-distal regions are highlighted by markers predicted from transcriptomic analyses (Fig.2–3): distal (SOX9, KRT8, and EMX2); distal/medial (MECOM and ERBB4), medial (JAG1); proximal (CDH6), and podocytes (MAFB and CLDN5) (Fig.4A; week 15–16). To determine where and when distal, medial, and proximal domains form, we identified the first appearance of SOX9, JAG1, and MAFB in the PTA-to-RV transition (Fig.4B). As anchor points in this analysis, position 1 demarcates the first recruited cells positioned under the ureteric bud contacting the ureteric epithelium while position 2 demarcates the most recently recruited from the stream of NPCs that connects to the NPC niche.
Fig.4. Positional identities in the nephron are specified by gradual recruitment of progenitor cells.

(A) Immunofluorescent analysis of nephron-segment identity markers in (A) SSBs where fates are demarked as follows: D: distal tubule, L: loop of Henle anlagen, M: medial segment, Pt: proximal tubule, Pe: parietal epithelium, Po: podocytes. (B) emerging proximal-distal polarities at 2 positions (1 and 2) during PTA-RV-CSB stages. Scale bars 10 μm. Immunofluorescent stains as indicated. Nephron development stage indicated above fields in B. (C) Top: Schematic model for progressive recruitment of NPCs over time and sequential cell fate acquisition. Bottom: Specification of cell-fates along cumulative time as indicated by pseudotime. PTA: pretubular aggregate, RV: renal vesicle, SSB: S-shaped body nephron, UB: ureteric bud, NPC: nephron progenitor, LOH: loop of Henle analage, RC: renal corpuscle precursor.
In the PTA, low levels of JAG1 were detected at position 1. JAG1 levels were elevated in cells in the same position by early RV stages and by mid-RV stages low level SOX9 activity was also evident in this cell population. At this time, weak MAFB+ cells first appeared at position 2. Continued RV development was accompanied by consolidation and distal-medial segregation of positional markers: SOX9 was further upregulated in cells at position 1 while JAG1 expanded proximally. By the late RV stage, distinct distal SOX9high/JAG1low and medial SOX9-/JAG1high domains were evident while MABF+ podocyte precursors were located just above the connecting streaming NPCs consistent with the 3D reconstruction in Fig. 1D. Though there are no unique markers to distinguish parietal epithelium precursors of the renal corpuscle, the last recruited cells beneath the MAFB+ population is likely to correspond to the parietal lineage. Collectively, these data support a model of progressive establishment of cellular identities along the proximal-distal axis of the nephron anlagen.
Discussion
Our data identifies a dynamic cellular process that provides a mechanistic framework for how positional identities are initiated in formation of the mammalian nephron. The timing of NPC recruitment dictates the spatial positioning of each cell and the subsequent fate of cells along the proximal-distal axis of the nephron (Fig.4C). This raises the question of how time of recruitment and position can regulate cell fate outcomes?
Localized Wn9b secreted by the ureteric epithelium has been proposed to initiate proximal-distal axial asymmetry in the nephron (Carroll et al., 2005; Lindström et al., 2015; Schneider et al., 2015). In a Time-dependent Cell-fate Acquisition (TCA) process, NPCs would likely be subject to different concentrations of Wnt9b/WNT9B for varying periods of time with early recruits receiving a higher and longer dose. Other nephron-intrinsic signaling networks, composed of Bmp and Fgf, also play a role in conjunction with Wnt signaling to regulate distal nephron development (Grieshammer et al., 2005; Lindström et al., 2015) while proximal cell fate specification requires Notch signaling (Cheng et al., 2007) through the Notch ligand Jag1 (Liu et al., 2013). Our analyzes of how distal-to-proximal identities emerge during nephrogenesis raises the possibility that distal fates initially form with a medial JAG1+ identity but over time distal cells downregulate JAG1 and upregulate SOX9, with medial identity shifting proximally. Integration of duration and concentration of signaling has been demonstrated in a diversity of patterning processes (Sagner and Briscoe, 2017). Delineating cell-cell interactions through deeper single-cell RNA-seq analysis with greater gene resolution and live imaging of mutant mouse models will shed light on how these cellular signaling events incorporate into the TCA model.
Recently, several groups have reported the generation of nephron-like structures with proximal-distal polarity from directed differentiation of pluripotent stem cells (Morizane et al., 2015; Taguchi et al., 2014; Takasato et al., 2015). However, no evidence of a normal nephrogenic niche organization has been presented for these models and the identities of emerging cell-types remain to be clarified. In the light of the data here, in vitro nephrogenic programs may not fully recapitulate the diversity of cell states observed in the normal kidney. Distal cell fates that normally develop in close association with the ureteric epithelium are predicted to be particularly susceptible to a disruption of normal nephrogenic processes.
Methods
Contract for Reagent and Resource Sharing
Further information and requests for resources and reagents should be directed to and will be fulfilled by Andrew Smith (andrewds@usc.edu) and Andrew P. McMahon (amcmahon@med.usc.edu).
Experimental Model and Subject Details
Animal studies
Institutional Animal Care and Use Committees (IACUC) at the University of Southern California reviewed and approved all animal work as performed in this study. All work adhered to institutional guidelines. Timed matings were set up to recover embryos at the appropriate age (embryonic day 11.5 to 12.5), sex not known. The Six2GCE strain B6;129-Six2tm3(EGFP/cre/ERT2)Amc/J) was generated as previously described (Kobayashi et al., 2008) by placing a EGFP CreERT2 construct into the Six2 locus. The Rosa26mTmG reporter line (B6.129(Cg)-Gt(ROSA)26Sortm4(ACTB-tdTomato,-EGFP)Luo/J) (Muzumdar et al., 2007), the Cdh1CFP line (B6.129P2(Cg)-Cdh1tm1Cle/J) (Snippert et al., 2010), and the Tg(Hoxb7-Venus*)17Cos/J (Chi et al., 2009) were obtained from JAX and are reporter mouse strains that in cre-dependent and independent manners label cells and structures in the kidney. Heterozygous Six2-GCE animals were crossed with female Rosa26mTmG homozygous females; double heterozygous males were crossed with homozygous Cdh1CFP or tgHoxb7Venus females; mice all adults. Progeny was bred to reporter-strain homozygosity. E11.5-E12.5 kidneys were cultured in media (see Confocal live imaging section below) as previously described with 1μM 4-hydroxy tamoxifen (SIGMA H7904) (Lindström et al., 2015); cultures were performed on Transwell filter inserts. Analysis was performed on three Six2CE/+; Rosa26mTmG/mTmG; Cdh1CFP/CFP and eleven Six2CE/+; Rosa26mTmG/+; tgHoxb7Venus imaged kidneys.
Human kidney studies
Consented, anonymized, human fetal kidney tissue was obtained from elective terminations following review of the study by Keck School of Medicine of the University of Southern California’s Institutional Review Board. Kidney samples ranging in age from 8 to 18 weeks of gestation were supplied by collaborators at the Children’s Hospital of Los Angeles. Gestational age was determined per guidelines specified by the American College of Obstetricians and Gynecologists using ultrasound, heel to toe, and crown to rump measurements following published Carnegie Stages (O’Rahilly and Müller, 2010; O’Rahilly et al., 1987; Strachan et al., 1997). The sex of the specimen was not reported. Consented samples were received immediately after elective terminations and transported from the Children’s Hospital of Los Angeles on ice at 4°C in 10% fetal bovine serum, 25mM Hepes, high glucose DMEM (SigmaAldrich).
Methods details
3D reconstructions of cell-streaming
Three dimensional imaging was performed as previously described (Lindström et al., 2018b) by carrying out whole-mount immunofluorescent stains on slices of human kidney cortex. Slices were fixed in 4% formaldehyde in 1× phosphate buffer saline (PBS) on ice for 45 min, washed in 1XPBS, blocked in 1xPBS with 0.1% TritonX100 and 2% SEA Block (ThermoFisher Scientific) for 1 hr, and sequentially incubated in primary and secondary antibodies overnight. Primary and secondary antibodies were diluted in the block solution. To clear tissue slices, the slices were dehydrated in methanol via increasing concentrations 50%, 75%, 100%, diluted in PBS - each for 1hr - and subsequently submerged in a 50:50 benzyl benzoate/benzyl alcohol (BABB):methanol solution, followed by 100% BABB; full details in (Lindström et al., 2018b). Imaging of nascent nephrons was performed on a Leica SP8 using a 40X objective (1.3Oil, HC PL APO CS2). To generate 3D models, nephrons and tips were digitally segmented by hand and visualized in AMIRA 6.4 (FEI Thermo Fisher Scientific). Sixteen nascent nephrons were analyzed at week 13 and 24 nephrons at week 16–17.
Confocal live imaging
Kidneys were dissected at E11.5-E12.5 and cultured o/n at 37°C on a Transwell filter (Corning) in FluoroBrite DMEM (Life technologies, A18967–01) supplemented with 10% fetal calf serum, 1% Pen/Strep, and 1X Glutamax (Thermofisher). Filter inserts were transferred to 35mm MatTek glass bottom dishes in customized holders and imaged for 24–48 hour periods using a Leica SP8 system using a 25× HC FLUOTAR L 25×/0.95 water immersion objective. The water immersion was maintained through a Leica water cap with a modified water and drainage system allowing for continues flow of water.
Immunofluorescent staining and in situ hybridization
Immunofluorescent detection of proteins and in situ hybridization detection of mRNAs was performed as previously described (Lindström et al., 2018b). In brief, kidneys were fixed in 4% PFA overnight, immersed in 30% sucrose for 24 hrs, embedded in Optimal Cutting Temperature solution, and cryo-sectioned into 10 μm sections. For antibody stains, slides were washed in 1xPBS, blocked in 1XPBS with 0.25% TritonX100 and 1.5% SEA Block for 30min, and then sequentially incubated in primary and secondary antibodies at 4°C overnight; full details of protocol as described (Lindström et al., 2018b). Primary antibodies and dilutions as follows: ALDH1A1 (Abcam, ab52492, 1:300), HES1 (Cell Signaling, 11988, 1:300), CDH6 (R&D, AF2715, 1:1000), HNF1B (Santa Cruz, sc-22840, 1:300), MAFB (R&D, MAB3810, 1:500), CLDN5 (Novus Biologicals, NB120–15107, 1:100) ERBB4 (R&D, MAB1131, 1:300), MECOM (R&D, MAB75061, 1:300), SIX2 (Sigma Aldrich, SAB1401533, 1:500), SIX2 (MyBioSource, MBS610128; 1:1000), CITED1 (Abcam, ab55467; 1:300, KRT8 (DSHB, troma-1; 1:50), CDH1 (BD Transduction Laboratories, 610182; 1:300), PAPPA2 (R&D, AF1668; 1:300). Secondary antibodies were purchased from Molecular Probes AlexaFluor 488, 555, 594, and 647. Nuclei were labelled with 1 μg/ml Hoechst 33342 (Molecular Probes) in PBS for 5 min. Sections were mounted in ProLong Gold Antifade Reagent (Life technologies) and imaged at 63X.
Single-cell RNA-seq data – isolation of cells and sequencing
Single-cell transcriptomes were obtained as previously described (Lindström et al., 2018c) from two replicate week 17 kidneys by digestion of the nephrogenic zone. In brief, whole kidneys were placed in collagenase A/ pancreatin enzyme mix (Brown et al., 2015) and placed on a nutator to release cells from the nephrogenic niche. Live and intact cells were collected by FACS, positively selecting for DRAQ5+ cells (ThermoFisher Scientific) and excluding DAPI+ (ThermoFisher Scientific) cells. 8000 cells were input into the 10X Chromium system and processed for single-cell library construction as per 10× Genomics instructions and as we describe previously (Lindström et al., 2018c). The data is available at GEO accession number GSE112570. Quality control, mapping (to GRCh37.p13) and count table assembly of the library was performed using the CellRanger pipeline version 2.1 (as consistent with 10× Genomics guidelines) and as described in our previous work (Lindström et al., 2018c).
Quantification and Statistical Analysis
Quantification of protein intensity during gradual recruitment
Fiji was used to quantify SIX1, CITED1, JAG1, PAX8, and DAPI intensity profiles in 2D cryo-sections (as shown in Fig.1 and S1) along the proximal-to-distal axis of the nephron. Images were captured at equivalent settings per range, in 8-bit, and a 9 μm segmented line (comparable to nuclei size) was fitted along the thickest part of the lateral sides of the nephron (as indicated on Fig.1 and S1). The plot profile function was used to measure the average intensity across the line along its length. The SIX1 and CITED1 signals were presented as percentages of the signal detected in adjacent NPC populations where the signal was the highest, while JAG1 and PAX8 were presented as raw 8-bit signals.
Computational isolation of nephrogenic lineage
The initial step of our analysis required isolating nephrogenic lineage cells from other cells in the sample (e.g. interstitial lineage and blood cells). For consistency with previous analysis we applied the same procedure as outlined in (Lindström et al., 2018c); cells were selected based on expression of nephrogenic lineage markers and absence of markers indicate interstitial, ureteric, vascular, or immune cell lineages. We initially calculated 3 quality control metrics for each cell: (1) the number of genes with one or more mapped reads, (2) the percentage of reads mapped to genes annotated as mitochondrial, (3) the Good-Turing estimate of cell saturation (Good, 1953). Based on visual inspection of the histograms of these 3 metrics, we filtered out cells expressing fewer than 1,000 genes, as well as cells mapping more than 5% of their reads to mitochondrial genes and cells whose Good-Turing estimate was smaller than 0.7. The remaining 7,343 cells were clustered using the Seurat R package. We ran Principal Component Analysis on the dataset and used 39 PCs based on the JackStraw test (p < 0.05) and clustered the cells using the Seurat FindClusters function with 39 PCs and default remaining parameters. We found 16 resulting clusters, displayed in a t-SNE plot in Supplementary Figure 4A. Based on the differential expression test (FindAllMarkers function, bimod test) and the cluster hierarchy (BuildClusterTree function), We inferred that 5 of the clusters (11, 13, 14, 15 and 16), totalizing 3,367 cells, belonged to the nephrogenic lineage, and were selected for secondary analysis.
Identifying variable genes and dimensionality reduction
Raw read counts from the nephrogenic lineage cells were analyzed using the Seurat R package (Satija et al., 2015). Standard Seurat log-normalization, variable gene selection and Principal Component Analysis (PCA) were performed using the LogNormalize, FindVariableGenes, ScaleData and RunPCA functions, respectively, with the same parameters used in the previous step. This yielded 1,168 genes that are variable across cells and 19 statistically significant principal components (cutoff of p=0.05, JackStraw test).
Identifying distinct cell types within the nephrogenic lineage
The 3,367 nephrogenic lineage cells were clustered using the Gaussian Mixture Model (GMM) based on the 19-dimensional PC space (see above), as implemented in the mclust package (Scrucca et al., 2016). GMM is particularly well-suited for the context where cells transition into states through continuous differentiation, as it allows for probabilistic assignment of cells to clusters and the estimated probability distribution associated with each cluster. We determined the number of clusters using Bayesian Information Criterion (BIC) (Schwarz, 1978), evaluating BIC for 1 to 50 clusters, and retaining 22 clusters, for which BIC was maximized. These 22 clusters defined 22 distinct cell types within the nephrogenic lineage.
Measuring similarity between identified cell types
The estimated means and covariances of each cluster were used as the basis for assessing relationships between cell types. We chose to apply the Bhattacharyya distance metric (BD) (Bhattacharyya, 1943) to quantify the dissimilarity between cluster distributions as given by their estimated mean and covariance matrices. This metric approximates the amount of overlap between the density functions for two distributions. Because BD accounts for the distribution variances, it distinguishes the similarities between two pairs of distributions that have equal centroid distances but overlap in different ways in high dimension, and is an accurate estimate of the classification error between points generated from pairs of distributions (Choi and Lee, 2003).
The BD between clusters was used as input to build the cluster hierarchy with complete linkage (Fig. 2C). To identify pairs of phenotypes that were most likely related through developmental transitions, we calculated the minimum spanning tree using BD as edge values between clusters (Supplementary figure 3A).
Pseudotemporal reconstruction of lineages
We used the Monocle2 algorithm (Qiu et al., 2017) to reconstruct the differentiation pathways across the 3,367 cells. We used the 1,168 aforementioned variable genes with the Seurat-normalized expression values as input and used the reduceDimension function to run the DDRTree algorithm and estimate the ordering of cells along a trajectory. Both the cluster identities and the known marker genes for different phenotypes were used to infer the start of the trajectory (Fig. 2D – top). We selected cells that were projected onto specific lineages based on the branches (cell “states”, as assigned by the orderCells function in Monocle) they were projected onto. Initially, we selected only cells from the branch that did not contain the cycling lineage (Fig. 2D – bottom). Subsequently, we reran the Monocle algorithm by manually selecting cells assigned to the branch that contained most cells from nephron progenitor clusters and each other individual branch until only a single trajectory was identified. The branches selected in each iterative step are shown in Supplementary figure 3C. Each trajectory was recalculated using the reduceDimension and orderCells functions with default parameters. The unbranched paths were analyzed to identify genes that vary along pseudotime using Monocle’s generalized additive model (Trapnell et al., 2014) implemented in the differentialGeneTest function.
Clustering genes into correlated modules
We used Weighted Gene Correlation Network Analysis (WGCNA) (Zhang and Horvath, 2005) to group differentially expressed genes into correlated modules. We constructed a signed network, wherein every pair of genes is connected by a power of their correlation. We used the pickSoftThreshold method in WGCNA to choose the correlation power estimate (β=3). We used the blockwiseModules function in WGCNA to obtain the modules shown in (Fig.3A), which resulted in disjoint sets of correlated genes. Single cells were scored for each module by their eigengene expression (Fig.3B – displayed as feature plot heatmap in main figure and boxplots in Supplementary figure 4). For a fixed module Mj, the first PC using only the genes in Mj was calculated, and each single cell i was projected into this component, yielding a set of eigengene values mij as cell i’s coordinate in module j’s first PC. The larger the value of mij, the higher the expression of the module genes for cell i. For each module, a smooth spline was fitted for the pseudotime value inferred from the main trajectory and the module eigengene (function smooth.spline in R with smoothing parameter equal to 1) – (Fig.3D–E).
Gene-list GO-term ontology queries
Differentially expressed genes or gene module lists were queried by PANTHER (Mi et al., 2013) identifying Biological Processes.
Data and Software availability
The single cell RNA sequencing data is available at GEO accession number GSE112570.
Supplementary Material
Table1A-D Gene expression and network analyses from single-cell RNA-seq of week 17 human kidney as relating to Fig.2-3.
Tab 1 (A). Differentially expressed genes relating to Figure 2A–C. Tab 2 (B) Bhattacharyya distance matrix relating to Figure 2C; S2A. Tab 3 (C) Modules, relating to Figure 3; S4. Tab 4 (D) GO-Term analyses from single-cell RNA-seq analyses relating to Figure 3A.
Movie 1. Cell-connection between NPC population and forming nephron as relating to Fig. 1D–E. 3D rendering of human nephrons forming with prominent cellular connections bridging the NPC populations and the nephrons. Stains, stages, and structures are indicated in the movie. PTA: pretubular aggregate, RV: renal vesicle.
Movie 2. Gradual recruitment and specification of cell-fates visualized by confocal time-lapse imaging of Six2CreERT2; Rosa26mTmG; Cdh1CFP kidney cultures as relating to Fig.1F.
Movie 3. Gradual recruitment and specification of cell-fates visualized by confocal time-lapse imaging of Six2CreERT2; Rosa26mTmG; tgHoxb7-Venus kidney cultures as relating to Fig. 1G. Two nephrons shown with late/proximal recruitment, or early/distal recruitment.
Acknowledgements
We thank all members of the McMahon lab for helpful discussion. We thank Drs Rachel Steward and Melissa Wilson for their help providing tissue samples and IRB approval processes.
Funding
Work in APM’s laboratory was supported by grants from the National Institutes of Health (DK107350, DK094526, DK110792) and the California Institute for Regenerative Medicine (LA1–06536).
Footnotes
Declaration of Interests
The authors declare no conflict of interest.
References
- Bhattacharyya A (1943). On A Measure of Divergence Between Two Statistical Populations Defined by their Probability Distributions. Bull. Calcutta Methematical Soc 35, 99–109. [Google Scholar]
- Brown AC, Muthukrishnan SD, and Oxburgh L (2015). A Synthetic Niche for Nephron Progenitor Cells. Dev. Cell 34, 229–241. [DOI] [PMC free article] [PubMed] [Google Scholar]
- Carroll TJ, Park J-S, Hayashi S, Majumdar A, and McMahon AP (2005). Wnt9b plays a central role in the regulation of mesenchymal to epithelial transitions underlying organogenesis of the mammalian urogenital system. Dev. Cell 9, 283–292. [DOI] [PubMed] [Google Scholar]
- Cheng H-T, Kim M, Valerius MT, Surendran K, Schuster-Gossler K, Gossler A, McMahon AP, and Kopan R (2007). Notch2, but not Notch1, is required for proximal fate acquisition in the mammalian nephron. Development 134, 801–811. [DOI] [PMC free article] [PubMed] [Google Scholar]
- Chi X, Hadjantonakis AK, Wu Z, Hyink D, and Costantini F (2009). A transgenic mouse that reveals cell shape and arrangement during ureteric bud branching. Genesis 47, 61–66. [DOI] [PMC free article] [PubMed] [Google Scholar]
- Choi E, and Lee C (2003). Feature extraction based on the Bhattacharyya distance. Pattern Recognit 36, 1703–1709. [Google Scholar]
- Desgrange A, and Cereghini S (2015). Nephron Patterning: Lessons from Xenopus, Zebrafish, and Mouse Studies. Cells 4, 483–499. [DOI] [PMC free article] [PubMed] [Google Scholar]
- Georgas K, Rumballe B, Valerius MT, Chiu HS, Thiagarajan RD, Lesieur E, Aronow BJ, Brunskill EW, Combes AN, Tang D, et al. (2009). Analysis of early nephron patterning reveals a role for distal RV proliferation in fusion to the ureteric tip via a cap mesenchyme-derived connecting segment. Dev. Biol 332, 273–286. [DOI] [PubMed] [Google Scholar]
- Good IJ (1953). The population frequencies of species and the estimation of population parameters. Biometrika 40, 237–264. [Google Scholar]
- Grieshammer U, Cebrián C, Ilagan R, Meyers E, Herzlinger D, and Martin GR (2005). FGF8 is required for cell survival at distinct stages of nephrogenesis and for regulation of gene expression in nascent nephrons. Development 132, 3847–3857. [DOI] [PubMed] [Google Scholar]
- Heliot C, Desgrange A, Buisson I, Prunskaite-Hyyryläinen R, Shan J, Vainio S, Umbhauer M, and Cereghini S (2013). HNF1B controls proximal-intermediate nephron segment identity in vertebrates by regulating Notch signalling components and Irx1/2. Development 140, 873–885. [DOI] [PubMed] [Google Scholar]
- Kobayashi A, Kwan K-M, Carroll TJ, McMahon AP, Mendelsohn CL, and Behringer RR (2005). Distinct and sequential tissue-specific activities of the LIM-class homeobox gene Lim1 for tubular morphogenesis during kidney development. Development 132, 2809 LP–2823. [DOI] [PubMed] [Google Scholar]
- Kobayashi A, Valerius MT, Mugford JW, Carroll TJ, Self M, Oliver G, and McMahon AP (2008). Six2 Defines and Regulates a Multipotent Self-Renewing Nephron Progenitor Population throughout Mammalian Kidney Development. Cell Stem Cell 3, 169–181. [DOI] [PMC free article] [PubMed] [Google Scholar]
- Langfelder P, and Horvath S (2008). WGCNA: an R package for weighted correlation network analysis. BMC Bioinformatics 9, 559. [DOI] [PMC free article] [PubMed] [Google Scholar]
- Lee JW, Chou C-L, and Knepper M. a. (2015). Deep Sequencing in Microdissected Renal Tubules Identifies Nephron Segment-Specific Transcriptomes. J. Am. Soc. Nephrol 26, 2669–2677. [DOI] [PMC free article] [PubMed] [Google Scholar]
- Lindström NO, Lawrence ML, Burn SF, Johansson JA, Bakker ER, Ridgway RA, Chang C-H, Karolak MJ, Oxburgh L, Headon DJ, et al. (2015). Integrated β-catenin, BMP, PTEN, and Notch signalling patterns the nephron. Elife 4, e04000. [DOI] [PMC free article] [PubMed] [Google Scholar]
- Lindström NO, Tran T, Guo J, Rutledge E, Parvez RK, Thornton ME, Grubbs B, McMahon JA, and McMahon AP (2018a). Conserved and Divergent Molecular and Anatomic Features of Human and Mouse Nephron Patterning. J. Am. Soc. Nephrol ASN.2017091036. [DOI] [PMC free article] [PubMed] [Google Scholar]
- Lindström NO, McMahon JA, Guo J, Tran T, Guo Q, Rutledge E, Parvez RK, Saribekyan G, Schuler RE, Liao C, et al. (2018b). Conserved and Divergent Features of Human and Mouse Kidney Organogenesis. J. Am. Soc. Nephrol ASN.2017080887. [DOI] [PMC free article] [PubMed] [Google Scholar]
- Lindström NO, Guo J, Kim AD, Tran T, Guo Q, De Sena Brandine G, Ransick A, Parvez RK, Thornton ME, Basking L, et al. (2018c). Conserved and Divergent Features of Mesenchymal Progenitor Cell Types within the Cortical Nephrogenic Niche of the Human and Mouse Kidney. J. Am. Soc. Nephrol ASN.2017080890. [DOI] [PMC free article] [PubMed] [Google Scholar]
- Liu Z, Chen S, Boyle S, Zhu Y, Zhang A, Piwnica-Worms DR, Ilagan MXG, and Kopan R (2013). The Extracellular Domain of Notch2 Increases Its Cell-Surface Abundance and Ligand Responsiveness during Kidney Development. Dev. Cell 25, 585–598. [DOI] [PMC free article] [PubMed] [Google Scholar]
- McMahon AP (2016). Development of the Mammalian Kidney. In Current Topics in Developmental Biology, pp. 31–64. [DOI] [PMC free article] [PubMed] [Google Scholar]
- Mi H, Muruganujan A, Casagrande JT, and Thomas PD (2013). Large-scale gene function analysis with the PANTHER classification system. Nat. Protoc 8, 1551–1566. [DOI] [PMC free article] [PubMed] [Google Scholar]
- Moriguchi T, Hamada M, Morito N, Terunuma T, Hasegawa K, Zhang C, Yokomizo T, Esaki R, Kuroda E, Yoh K, et al. (2006). MafB Is Essential for Renal Development and F4/80 Expression in Macrophages. Mol. Cell. Biol 26, 5715–5727. [DOI] [PMC free article] [PubMed] [Google Scholar]
- Morizane R, Lam AQ, Freedman BS, Kishi S, Valerius MT, and Bonventre JV (2015). Nephron organoids derived from human pluripotent stem cells model kidney development and injury. Nat. Biotechnol 33, 1193–1200. [DOI] [PMC free article] [PubMed] [Google Scholar]
- Mugford JW, Yu J, Kobayashi A, and McMahon AP (2009). High-resolution gene expression analysis of the developing mouse kidney defines novel cellular compartments within the nephron progenitor population. Dev. Biol 333, 312–323. [DOI] [PMC free article] [PubMed] [Google Scholar]
- Muzumdar MD, Tasic B, Miyamichi K, Li N, and Luo L (2007). A global double-fluorescent cre reporter mouse. Genesis 45, 593–605. [DOI] [PubMed] [Google Scholar]
- Nakai S, Sugitani Y, Sato H, Ito S, Miura Y, Ogawa M, Nishi M, Jishage K, Minowa O, and Noda T (2003). Crucial roles of Brn1 in distal tubule formation and function in mouse kidney. Development 130, 4751–4759. [DOI] [PubMed] [Google Scholar]
- O’Brien LL, and McMahon AP (2014). Induction and patterning of the metanephric nephron. Semin. Cell Dev. Biol 36, 31–38. [DOI] [PMC free article] [PubMed] [Google Scholar]
- O’Rahilly R, and Müller F (2010). Developmental stages in human embryos: Revised and new measurements. Cells Tissues Organs 192, 73–84. [DOI] [PubMed] [Google Scholar]
- O’Rahilly R, Müller F, and Streeter GL (1987). Developmental stages in human embryos: including a revision of Streeter’s “Horizons” and a survey of the Carnegie Collection (Carnegie Institution of Washington; ). [Google Scholar]
- Qiu X, Mao Q, Tang Y, Wang L, Chawla R, Pliner HA, and Trapnell C (2017). Reversed graph embedding resolves complex single-cell trajectories. Nat. Methods [DOI] [PMC free article] [PubMed] [Google Scholar]
- Reggiani L, Raciti D, Airik R, Kispert A, and Brandli AW (2007). The prepattern transcription factor Irx3 directs nephron segment identity. Genes Dev. 21, 2358–2370. [DOI] [PMC free article] [PubMed] [Google Scholar]
- Sagner A, and Briscoe J (2017). Morphogen interpretation: concentration, time, competence, and signaling dynamics. Wiley Interdiscip. Rev. Dev. Biol 6. [DOI] [PMC free article] [PubMed] [Google Scholar]
- Satija R, Farrell JA, Gennert D, Schier AF, and Regev A (2015). Spatial reconstruction of single-cell gene expression data. Nat. Biotechnol 33, 495–502. [DOI] [PMC free article] [PubMed] [Google Scholar]
- Schneider J, Arraf A. a, Grinstein M, Yelin R, and Schultheiss TM (2015). Wnt signaling orients the proximal-distal axis of chick kidney nephrons. Development 142, 2686–2695. [DOI] [PubMed] [Google Scholar]
- Schwarz G (1978). Estimating the Dimension of a Model. Ann. Stat 6, 461–464. [Google Scholar]
- Scrucca L, Fop M, Murphy TB, and Raftery AE (2016). mclust 5: Clustering, Classification and Density Estimation Using Gaussian Finite Mixture Models. R J. 8, 289–317. [PMC free article] [PubMed] [Google Scholar]
- Snippert HJ, van der Flier LG, Sato T, van Es JH, van den Born M, Kroon-Veenboer C, Barker N, Klein AM, van Rheenen J, Simons BD, et al. (2010). Intestinal crypt homeostasis results from neutral competition between symmetrically dividing Lgr5 stem cells. Cell 143, 134–144. [DOI] [PubMed] [Google Scholar]
- Strachan T, Lindsay S, and Wilson DI (1997). Molecular Genetics of Early Human Development (Oxford: BIOS Scientific Publishers 1997; ). [Google Scholar]
- Taguchi A, Kaku Y, Ohmori T, Sharmin S, Ogawa M, Sasaki H, and Nishinakamura R (2014). Redefining the in vivo origin of metanephric nephron progenitors enables generation of complex kidney structures from pluripotent stem cells. Cell Stem Cell 14, 53–67. [DOI] [PubMed] [Google Scholar]
- Takasato M, Er PX, Chiu HS, Maier B, Baillie GJ, Ferguson C, Parton RG, Wolvetang EJ, Roost MS, Chuva de Sousa Lopes SM, et al. (2015). Kidney organoids from human iPS cells contain multiple lineages and model human nephrogenesis. Nature 526, 564–568. [DOI] [PubMed] [Google Scholar]
- Takemoto M, He L, Norlin J, Patrakka J, Xiao Z, Petrova T, Bondjers C, Asp J, Wallgard E, Sun Y, et al. (2006). Large-scale identification of genes implicated in kidney glomerulus development and function. EMBO J. 25, 1160–1174. [DOI] [PMC free article] [PubMed] [Google Scholar]
- Trapnell C, Cacchiarelli D, Grimsby J, Pokharel P, Li S, Morse M, Lennon NJ, Livak KJ, Mikkelsen TS, and Rinn JL (2014). The dynamics and regulators of cell fate decisions are revealed by pseudotemporal ordering of single cells. Nat Biotech 32, 381–386. [DOI] [PMC free article] [PubMed] [Google Scholar]
- Yang Z, Zimmerman S, Brakeman PR, Beaudoin GM, Reichardt LF, and Marciano DK (2013). De novo lumen formation and elongation in the developing nephron: a central role for afadin in apical polarity. Development 140, 1774–1784. [DOI] [PMC free article] [PubMed] [Google Scholar]
- Zhang B, and Horvath S (2005). Statistical Applications in Genetics and Molecular Biology A General Framework for Weighted Gene Co- Expression Network Analysis A General Framework for Weighted Gene Co- Expression Network Analysis. Stat. Appl. Genet. Mol. Biol 4. [DOI] [PubMed] [Google Scholar]
Associated Data
This section collects any data citations, data availability statements, or supplementary materials included in this article.
Supplementary Materials
Table1A-D Gene expression and network analyses from single-cell RNA-seq of week 17 human kidney as relating to Fig.2-3.
Tab 1 (A). Differentially expressed genes relating to Figure 2A–C. Tab 2 (B) Bhattacharyya distance matrix relating to Figure 2C; S2A. Tab 3 (C) Modules, relating to Figure 3; S4. Tab 4 (D) GO-Term analyses from single-cell RNA-seq analyses relating to Figure 3A.
Movie 1. Cell-connection between NPC population and forming nephron as relating to Fig. 1D–E. 3D rendering of human nephrons forming with prominent cellular connections bridging the NPC populations and the nephrons. Stains, stages, and structures are indicated in the movie. PTA: pretubular aggregate, RV: renal vesicle.
Movie 2. Gradual recruitment and specification of cell-fates visualized by confocal time-lapse imaging of Six2CreERT2; Rosa26mTmG; Cdh1CFP kidney cultures as relating to Fig.1F.
Movie 3. Gradual recruitment and specification of cell-fates visualized by confocal time-lapse imaging of Six2CreERT2; Rosa26mTmG; tgHoxb7-Venus kidney cultures as relating to Fig. 1G. Two nephrons shown with late/proximal recruitment, or early/distal recruitment.
Data Availability Statement
The single cell RNA sequencing data is available at GEO accession number GSE112570.