Abstract
Purpose:
Noninvasive measurement of mechanical properties of brain tissue using Magnetic Resonance Elastography (MRE) has been a promising method for investigating neurological disorders such as multiple sclerosis, hydrocephalus and Alzheimer’s. However, due to the regional and directional dependency of brain stiffness, estimating anisotropic stiffness is important. This study investigates both isotropic and anisotropic stiffness together and independently compare with age and with each other.
Methods:
MRE and Diffusion Tensor Imaging (DTI) were performed on 28 healthy subjects with age range 18 through 62 years. Isotropic and anisotropic stiffness was measured and compared with age for different regions of interest such as the thalamus, corpus callosum, gray matter, white matter, and whole brain.
Results:
Isotropic stiffness in gray matter (rs=−0.57; p=0.001) showed a significant decrease with age. Anisotropic stiffness in gray matter showed a significant decrease with age in C11 through C66 and in the thalamus only in C33. Between anisotropic and isotropic stiffness, gray matter showed a significant positive correlation in C11 through C66; C22 and C66 showed a significant negative correlation in the thalamus and whole brain, and C44 showed a negative correlation in the corpus callosum. No significant difference between genders was observed in any measurements.
Conclusion:
This study demonstrated a change in isotropic and anisotropic stiffness with age in different regions of the brain along with a correlation of anisotropic stiffness to isotropic stiffness.
Keywords: Magnetic resonance elastography, Brain Stiffness, anisotropic stiffness, isotropic stiffness, Brain MRE, DTI
Introduction
Physiological aging of the brain involves degeneration of neurons and oligodendrocytes [1]. Any changes in the cellular matrix can impact its mechanical properties such as stiffness [2]. As a result of aging, changes in brain stiffness have been reported in previous studies [3–5]. Noninvasive measurement of mechanical properties of the brain tissue has been studied lately using Magnetic Resonance Elastography (MRE) and has been a potentially promising method for investigating neurological disorders such as multiple sclerosis [6], hydrocephalus [7, 8], and Alzheimer’s [9]. However, due to the regional and directional dependency of brain stiffness [4, 5, 10], estimating the anisotropic stiffness is important. Some previous studies have estimated anisotropic stiffness measurements using both Diffusion Tensor Imaging (DTI) and MRE in humans [11, 12] and animal brain [13, 14].
MRE is a noninvasive imaging technique that has been used to measure the viscoelastic properties of brain tissue [15–18]. In this technique, mechanical waves are synchronized with the motion-encoding gradient to generate wave images. These wave images are mathematically converted to generate stiffness maps. DTI on the other hand provides the orientation of muscle fibers by exploiting the fact that water molecules diffuse preferably in the direction of the fiber bundle. Therefore, MRE displacement fields are resolved along and across the fibers to obtain anisotropic stiffness measurements [11, 12].
A phantom study by Qin E et al. [19] using MRE and DTI was able to distinguish between phantoms with varying anisotropy levels, which were not evident in the isotropic method due to averaging effects. Some in-vitro studies [5, 13, 20] investigated gray and white matter in animal brains and found white matter to be stiffer along the fibers parallel to the direction of shear, while no orientation dependence was detected in gray matter. This shows that the brain has some anisotropic regions and just measuring the isotropic measurements will not be sufficient.
As per our knowledge, so far anisotropic stiffness in only white matter and corticospinal tracts (CSTs) have been studied in in-vivo human brains [11, 12]; gray matter and white matter in ex-vivo lamb brains [13] and white matter in the ex-vivo porcine brain [14]. Other studies only looked into isotropic measurements in different brain regions [3, 15, 18]. This is the first study that investigated both isotropic and anisotropic together and also independently compared the two with age and with each other. The objective of this study is to understand isotropic as well as anisotropic stiffness and their correlations to each other for different regions in the brain in healthy subjects as a function of age.
Methods
Brain MRE and DTI were performed on 28 healthy subjects (n = 17 males, n = 11 females; mean age: 34.3yrs, age range 18-62yrs). Written informed consent was obtained from each subject under the approval of the Institutional Review Board.
Experimental Setup
All imaging was performed in a 3T MRI scanner (Tim Trio, Siemens Healthcare, Erlangen, Germany). Subjects were positioned in the supine position with the head first. A pneumatic driver system (Resoundant Inc, Rochester, MN) was used to induce 60 Hz vibrations into the brain as shown in Figure 1. A soft pillow-like driver was placed inside the head coil underneath subject’s head to induce vibrations. The overall scan time was ~26 minutes for both MRE and DTI together. MRE and DTI scans were performed subsequently with the same resolution.
Figure 1:
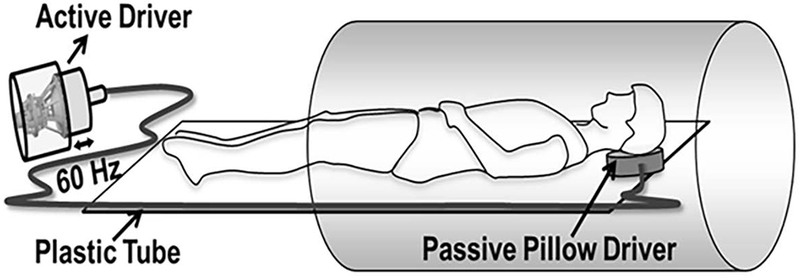
Schematic of MRE driver setup. A pillow driver is placed posterior to the head, and acoustic waves are noninvasively transmitted from the active driver to the pillow, and into the subject’s brain. These waves are subsequently imaged and used to calculate the shear modulus.
To assess the reproducibility of stiffness measurements, MRE and DTI were performed 4 times on a volunteer (two scans on the same day while the other two within a week) where each time the volunteer was asked to step out of the scanner and was repositioned for the repeat scan while using the same protocol parameters mentioned below.
Image Acquisition
MRE
A GRE MRE sequence [21] was performed to obtain axial slices of the entire brain. Imaging parameters included: FOV: 320 mm x 320 mm; flip angle: 16°; matrix size: 128×128; TR/TE: 25/20.7 ms; GeneRalized Autocalibration Partial Parallel Acquisition (GRAPPA): 3; motion encoding gradient (MEG): 60Hz; 3 MEG directions x, y and z both positive and negative; MRE phase offsets: 4; number of slices: 45-60; slice thickness: 2.5 mm; resolution: 2.5×2.5×2.5 mm3.
DTI
Product diffusion-weighted (DW) single shot spin-echo (SE) echo-planar imaging (EPI) multi-slice sequence that has inbuilt distortion correction was used to acquire short axis slices covering the entire brain. Imaging parameters included: diffusion encoding directions = 30; TR = 6400 ms; TE = 87 ms; slice thickness = 2.5 mm; matrix = 128×128; FOV = 320×320 mm2; b values = 1000 s/mm2; acquisition voxel = 2.5×2.5×2.5 mm3; number of averages = 1.
Image Analysis
For isotropic stiffness measurements, MRE-Lab software (Mayo Clinic, Rochester, MN, USA) was used to generate shear stiffness maps of the brain using 3D Local Frequency Estimation (LFE) inversion algorithm [22, 23]. In this method, curl processing was performed to remove longitudinal waves and then directionally filtered to remove reflected waves. Finally, a 3D weighted stiffness map was generated by processing first harmonic displacements from all the spatial directions and the weighting was based on the first harmonic displacement fields. In order to take care of boundary effects on the stiffness measurements, we eroded about 8 pixels from the whole brain stiffness map.
For anisotropic stiffness measurements, diffusion tensors were generated using FMRIB Software Library (FSL). Additional processing was performed on the diffusion tensors to filter the noise using 3D anisotropic diffusion filter, Perona-Malik as described elsewhere [24–26]. Elastic tensor model (i.e. Orthotropic) [11, 12] and elastic coefficients were calculated as following. A local coordinate system was defined (n1, n2, n3) where n3 corresponds to the dominant fiber direction, n1 corresponds to the sheet direction and n2 corresponds to the direction normal to the sheet. A spatial-spectral filter was applied to the first harmonic of MRE displacements to identify waves traveling in the direction relative to fiber orientation using a spectral window (5×5×5) followed by Helmholtz decomposition to isolate total field into its longitudinal and transverse components [27]. The principal frequency of the spatially-spectrally filtered first harmonic displacement data was computed for longitudinal and transverse components [28]. Next, approximate wavenumbers in each direction were obtained followed by narrowband spatial spectral filters with a window of +/−20 rad/m centered on these wavenumbers were defined for the same spectral volume (5×5×5). The tensor is solved using the following anisotropic equation of motion as described in Romano et al. [11] :
where, u(nl) and xl (l = 1, 2 or 3) represent the directionally filtered displacements and the differential parameters along the local axes (n1, n2, n3) respectively.
A region of interest (ROI) for different regions in the brain such as white matter, gray matter, thalamus, corpus callosum and whole brain were created by using the brain atlas available in the SPM12 software (The FIL Methods group, UCL, UK) to obtain isotropic and anisotropic stiffness measurements. Lateral ventricle was excluded when reporting both the isotropic and anisotropic stiffness measurements. Additionally, any overlapping regions between all regions of interest were removed manually for each volunteer dataset.
Statistical Analysis
The associations between isotropic stiffness versus age, anisotropic stiffness versus age and isotropic versus anisotropic stiffness for each ROI was analyzed by using Spearman correlation method. A t-test was performed to determine any significant difference in gender when estimating isotropic and anisotropic stiffness measurements. To assess the reproducibility of stiffness measurements, coefficient of variation was performed using the first scan as the reference. Analyses were conducted by using SAS 14 (SAS Institute Inc; Cary, NC) and graphs were generated by using Minitab 17(Minitab Inc; State college, PA). P-value < 0.05 was considered to be significant.
Results
Table 3 and Table 4 shows the reproducibility study measurements (i.e. repositioning the volunteer after each scan) in a volunteer repeated 4 times for both isotropic and anisotropic stiffness, respectively. Coefficient of variation in stiffness measurements for 4 repetitions was found to be in between 0.17% to 2.4% demonstrating good reproducibility of isotropic and anisotropic measurements.
Table 3.
Reproducibility study measurements for Isotropic Stiffness in kPa in one volunteer.
| CC | TH | WM | GM | WB | |
|---|---|---|---|---|---|
| Scan1 | 1.32 | 1.22 | 1.52 | 1.45 | 1.48 |
| Scan2 | 1.47 | 1.38 | 1.63 | 1.54 | 1.60 |
| Scan3 | 1.36 | 1.23 | 1.40 | 1.46 | 1.50 |
| Scan4 | 1.39 | 1.23 | 1.35 | 1.44 | 1.45 |
Table 4.
Reproducibility study measurements for Anisotropic Stiffness in kPa in one volunteer.
| Scan1 | Scan2 | Scan3 | Scan4 | |||||||||||||||||
|---|---|---|---|---|---|---|---|---|---|---|---|---|---|---|---|---|---|---|---|---|
| CC | TH | WM | GM | WB | CC | TH | WM | GM | WB | CC | TH | WM | GM | WB | CC | TH | WM | GM | WB | |
| C11 | 41.34 | 42.63 | 41.83 | 41.16 | 41.60 | 41.40 | 41.99 | 41.78 | 41.07 | 41.51 | 40.73 | 41.51 | 41.32 | 41.23 | 41.31 | 40.63 | 40.76 | 41.25 | 41.20 | 41.27 |
| C22 | 52.62 | 50.31 | 45.79 | 46.94 | 46.26 | 53.75 | 51.71 | 45.34 | 45.45 | 45.40 | 51.20 | 46.10 | 44.53 | 44.55 | 44.56 | 52.80 | 51.80 | 44.78 | 46.67 | 45.59 |
| C33 | 39.35 | 39.41 | 40.21 | 38.88 | 39.69 | 39.01 | 39.25 | 40.33 | 38.95 | 39.78 | 39.33 | 39.14 | 39.85 | 38.48 | 39.30 | 38.70 | 38.51 | 38.65 | 38.17 | 38.45 |
| C44 | 6.65 | 6.57 | 6.47 | 6.46 | 6.46 | 6.60 | 6.43 | 6.38 | 6.39 | 6.39 | 6.52 | 6.42 | 6.38 | 6.33 | 6.36 | 6.51 | 6.37 | 6.32 | 6.32 | 6.32 |
| C55 | 6.36 | 6.37 | 6.37 | 6.33 | 6.35 | 6.35 | 6.35 | 6.35 | 6.33 | 6.34 | 6.38 | 6.34 | 6.34 | 6.31 | 6.33 | 6.35 | 6.31 | 6.32 | 6.30 | 6.31 |
| C66 | 6.81 | 6.76 | 6.63 | 6.65 | 6.64 | 6.49 | 6.60 | 6.50 | 6.49 | 6.50 | 6.49 | 6.62 | 6.48 | 6.51 | 6.50 | 6.38 | 6.54 | 6.47 | 6.50 | 6.48 |
Isotropic and anisotropic stiffness maps along with the fiber orientation are shown in Figures 2 and 3 in a volunteer. Figure 2a shows an axial magnitude image, 2b-e shows the snapshot of wave images at four phase offsets, 2f shows the corresponding isotropic stiffness map and 2g-k shows stiffness map corresponding to each ROI of corpus callosum, thalamus, gray matter, white matter and whole brain excluding the lateral ventricles, respectively. Figures 3a and 3b show the contours and the corresponding DTI vectors using arrows with color weighted by anisotropic stiffness in C33 direction, which is the compressional component parallel to the fiber direction in different regions of interest.
Figure 2:
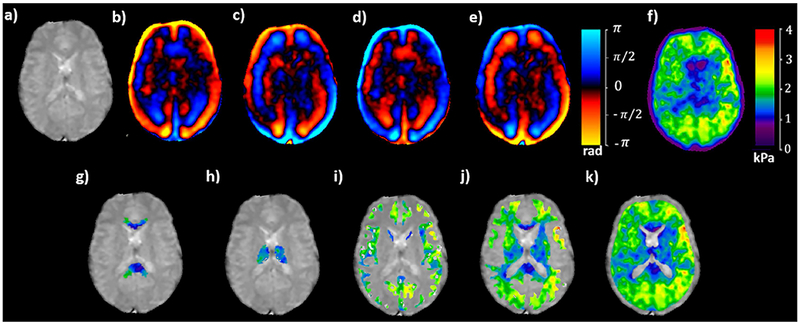
Magnitude image of a axial slice (a) demonstrating snapshot of wave images at four time points in (b) through (e), the corresponding isotropic stiffness map in (f) and isotropic stiffness map excluding the lateral ventricles in each ROI of corpus callosum in (g), thalamus in (h), gray matter in (i), white matter in (j) and whole brain in (k).
Figure 3:
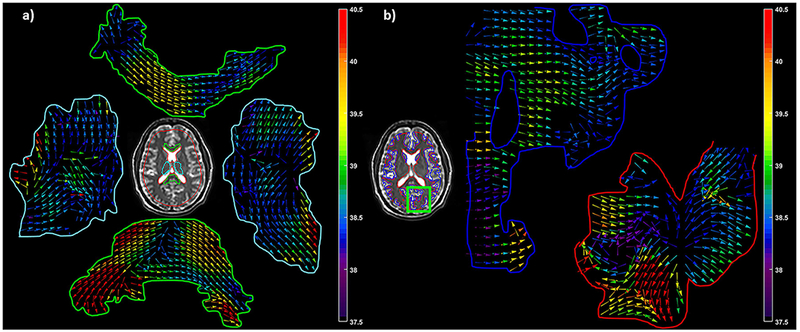
Axial slice from one of the volunteers showing ROI for corpus callosum in green, thalamus in cyan and whole brain in red in (a). A small part of the brain is highlighted in green rectangle showing white matter in red and gray matter in blue (b). Arrows represents DTI vectors with color map weighted using anisotropic stiffness in C33 direction, which is the compressional coefficient parallel to the fiber direction in different regions of interest.
Isotropic Stiffness versus Age
Figure 4 shows spearman correlation plots for isotropic stiffness versus age in thalamus (rs = −0.32; p = 0.09), corpus callosum (rs = −0.25; p = 0.18), whole brain (rs = −0.26; p = 0.17), gray matter (rs = −0.57; p = 0.001) and white matter (rs = −0.16; p = 0.40). Only gray matter showed a negative and significant (p < 0.05) correlation between isotropic stiffness and age. Thalamus, corpus callosum, white matter and whole brain showed a negative but insignificant correlation between isotropic stiffness and age.
Figure 4:
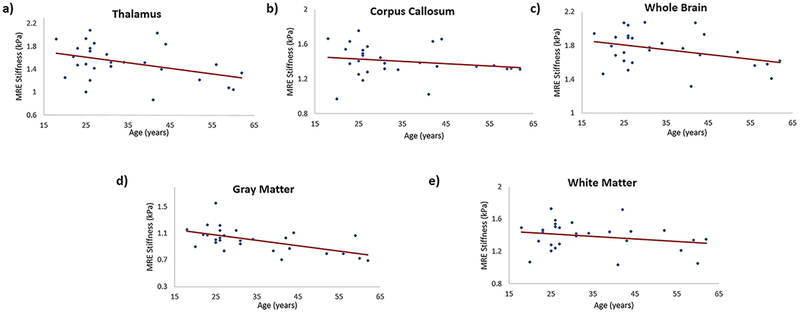
Plot demonstrating the spearman correlation of MRE-derived isotropic stiffness with age in different brain regions; (a) in thalamus with spearman correlation coefficient of −0.32, p = 0.09; (b) in corpus callosum with spearman correlation coefficient of −0.25, p = 0.18; (c) in whole brain with spearman correlation coefficient of −0.26, p = 0.17; (d) in gray matter with spearman correlation coefficient of −0.57, p = 0.001; (e) in white matter with spearman correlation coefficient of −0.16, p = 0.40.
Anisotropic Stiffness versus Age
Table 1 shows spearman correlation values for anisotropic stiffness versus age in different regions of interest. A moderate significant decrease in gray matter stiffness to age was found in all anisotropic coefficients, i.e. C11 (rs = −0.67; p < 0.0001), C22 (rs = −0.63; p = 0.0003), C33 (rs = −0.67; p < 0.0001), C44 (rs = −0.68; p < 0.0001), C55 (rs = −0.66; p = 0.0001) and C66 (rs = −0.67; p < 0.0001) as shown in Figure 5. A moderate significant decrease in C33 (rs = −0.46; p < 0.01) was found in the thalamus. No other ROI demonstrated any significant correlation in anisotropic stiffness to age.
Table 1:
Spearman correlation coefficient of anisotropic stiffness coefficients with age in all regions of interest.
| Anisotropic
vs Age |
Thalamus | Corpus Callosum | Gray Matter | White Matter | Whole Brain | |||||
|---|---|---|---|---|---|---|---|---|---|---|
| rs | p | rs | p | rs | p | rs | p | rs | p | |
| C11 | 0.06 | 0.74 | 0.14 | 0.45 | −0.67 | <0.0001 | 0.25 | 0.18 | −0.14 | 0.45 |
| C22 | 0.22 | 0.24 | −0.07 | 0.71 | −0.63 | 0.0003 | 0.33 | 0.08 | 0.22 | 0.24 |
| C33 | −0.46 | 0.01 | −0.01 | 0.94 | −0.67 | <0.0001 | 0.25 | 0.19 | −0.35 | 0.06 |
| C44 | 0.16 | 0.38 | −0.05 | 0.79 | −0.68 | <0.0001 | 0.27 | 0.16 | 0.18 | 0.33 |
| C55 | −0.17 | 0.38 | 0.02 | 0.87 | −0.66 | 0.0001 | 0.27 | 0.16 | −0.05 | 0.78 |
| C66 | 0.31 | 0.10 | −0.27 | 0.15 | −0.67 | <0.0001 | 0.25 | 0.18 | 0.04 | 0.82 |
Figure 5:
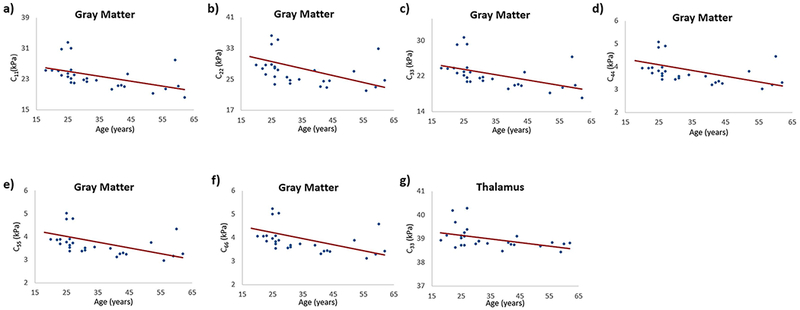
Plots demonstrating the spearman correlation of anisotropic stiffness coefficients with age in gray matter; (a) C11 vs age with a spearman correlation coefficient of −0.67, p < 0.0001; (b) C22 vs age with a spearman correlation coefficient of −0.63, p = 0.0003; (c) C33 vs age with a spearman correlation coefficient of −0.67, p < 0.0001; (d) C44 vs age with a spearman correlation coefficient of −0.68, p < 0.0001; (e) C55 vs age with a spearman correlation coefficient of −0.66, p = 0.0001; (f) C66 vs age with a spearman correlation coefficient of −0.67, p < 0.0001; and in thalamus (g) C33 vs age with a spearman correlation coefficient of −0.46, p = 0.01.
Isotropic versus Anisotropic Stiffness
Table 2 shows spearman correlation values for anisotropic versus isotropic stiffness in different ROIs of the brain. Figure 6 shows the spearman correlation plots, where gray matter demonstrated strong positive significant correlation between isotropic stiffness and all the anisotropic stiffness coefficients, C11 (rs = 0.82; p < 0.0001), C22 (rs = 0.71; p < 0.0001), C33 (rs = 0.83; p < 0.0001), C44 (rs = 0.82; p < 0.0001), C55 (rs = 0.83, p < 0.0001) and C66 (rs = 0.83; p < 0.0001). C22 showed a moderate significant negative correlation in thalamus (rs = −0.46; p = 0.01) and whole brain (rs = −0.55; p = 0.002). C44 showed a moderate significant negative correlation in corpus callosum (rs = −0.37; p = 0.04). C66 showed a moderate significant negative correlation in thalamus (rs = −0.53; p = 0.003) and whole brain (rs = −0.40; p = 0.03).
Table 2:
Spearman correlation coefficient of anisotropic stiffness coefficients with isotropic stiffness in all regions of interest.
| Anisotropic
vs Isotropic |
Thalamus | Corpus Callosum | Gray Matter | White Matter | Whole Brain | |||||
|---|---|---|---|---|---|---|---|---|---|---|
| rs | p | Rs | p | rs | p | rs | p | rs | p | |
| C11 | −0.19 | 0.32 | −0.17 | 0.38 | 0.82 | <0.0001 | 0.09 | 0.64 | −0.10 | 0.59 |
| C22 | −0.46 | 0.01 | −0.20 | 0.28 | 0.71 | <0.0001 | −0.22 | 0.24 | −0.55 | 0.002 |
| C33 | 0.19 | 0.33 | 0.11 | 0.57 | 0.83 | <0.0001 | 0.10 | 0.57 | 0.35 | 0.06 |
| C44 | −0.25 | 0.18 | −0.37 | 0.04 | 0.82 | <0.0001 | 0.11 | 0.56 | −0.24 | 0.20 |
| C55 | −0.07 | 0.71 | −0.02 | 0.88 | 0.83 | <0.0001 | 0.10 | 0.58 | −0.13 | 0.50 |
| C66 | −0.53 | 0.003 | −0.21 | 0.29 | 0.83 | <0.0001 | 0.10 | 0.60 | −0.40 | 0.03 |
Figure 6:
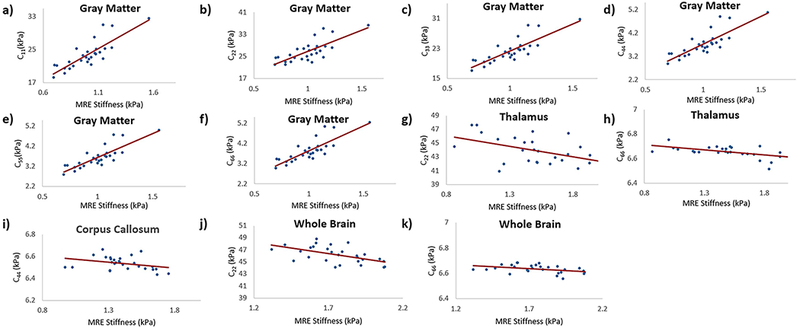
Plots demonstrating the spearman correlation of anisotropic stiffness coefficients versus isotropic stiffness. In gray matter isotropic stiffness versus C11 is shown in (a) with a spearman correlation coefficient of 0.82, p < 0.0001; C22 in (b) with a spearman correlation coefficient of 0.71, p < 0.0001; C33 in (c) with a spearman correlation coefficient of 0.83, p < 0.0001; C44 in (d) with a spearman correlation coefficient of 0.82, p < 0.0001; C55 in (e) with a spearman correlation coefficient of 0.83, p < 0.0001; C66 in (f) with a spearman correlation coefficient of 0.83, p < 0.0001. Similarly, in the thalamus isotropic stiffness versus C22 is shown in (g) with spearman a correlation coefficient of −0.46, p = 0.01; C66 in (h) with a spearman correlation coefficient of −0.53, p = 0.003.In the corpus callosum isotropic stiffness versus C44 is shown in (i) with a spearman correlation coefficient of −0.37, p = 0.04. Whole brain isotropic stiffness versus C22 is shown in (j) with a spearman correlation coefficient of −0.55, p = 0.002; and C66 in (k) with a spearman correlation coefficient of −0.40, p = 0.03.
Difference in stiffness measurements between genders
No significant difference between genders was found in any measurements in any of the regions of interest.
Discussion and Conclusion
Isotropic Stiffness versus Age
This study demonstrated a negative and significant correlation in gray matter isotropic stiffness to age. Thalamus, corpus callosum, white matter and whole brain also showed a negative but insignificant correlation in isotropic stiffness to age. This overall decrease in isotropic stiffness agrees with other findings as described below. With aging, there is an increase in glia cells [29], which leads to a decrease in neurons-glia ratio. Glia cells are softer than neurons [30] leading to a decrease in stiffness with age. A study by Arani et al. [4] at 60Hz found moderate significant decrease in stiffness with age in cerebrum, frontal, occipital, parietal and temporal lobes while weak and insignificant decrease trend was found in gray matter, white matter, cerebellum, and sensory-motor. In addition, studies by Sack et al. [3, 31] investigated brain stiffness at multi-frequencies 25 to 62.5 Hz and found a similar decrease in stiffness with age and also found that it is independent of the excitation frequency. Moreover, a recent study by Hiscox et al. [32] found a decrease in viscoelasticity in healthy older adults when compared to young in different regions including the amygdala, caudate, pallidum, putamen, and thalamus.
The whole brain mean isotropic stiffness measurements before curl processing found in our study matched closely to that reported by Sack et al [31]. On the other hand, stiffness values for thalamus, white matter and corpus callosum in our study was found to be higher than that was found by Guo et al. [33] and this may be because Guo et al. used multi-frequency dual elasto-visco (MDEV) inversion technique different from that used in our study (i.e. LFE and a single frequency).
Anisotropic Stiffness versus Age
This study also found a significant decrease in all anisotropic stiffness coefficients with age in the gray matter. This trend is similar to that observed in isotropic stiffness with age in the gray matter. The white matter, however, showed a weak positive and insignificant trend in anisotropic stiffness with age. It is known that white matter consists of myelinated nerve fibers or axons that are highly oriented while the gray matter consists of nerve cell bodies and dendrites. This might indicate that the white matter is relatively anisotropic compared to the gray matter. An ex-vivo study [5] performed shear mechanical testing on brain samples and found that the gray matter exhibited the least amount of anisotropy while the white matter exhibited the greatest. It was described by Peters A [34] in a review article that with degeneration due to aging there is a formation of a redundant myelin. We believe that anisotropic stiffness showing a positive trend with age in white matter may be associated with this increase in myelination of nerve fibers due to the formation of redundant myelin. Whereas, n the gray matter due to an increase in glia cells [29], the stiffness is thought to decrease [30], which is similar to that observed in previous studies [4].
Furthermore, two studies [11, 12] by Romano et al. have investigated anisotropic stiffness in CSTs and their values are in the same range as reported in our study, although the ROI was not exactly the same. The variation of stiffness in different regions of the brain across normal volunteers was marginal with a coefficient of variation (the variation relative to mean) ranging from 0.15% to 17.1%.
Isotropic versus Anisotropic Stiffness
All the anisotropic stiffness coefficients showed a strong significant positive correlation with isotropic stiffness in the gray matter. However, a moderate significant negative correlation was observed in C22 in the thalamus and whole brain, C44 in corpus callosum and C66 in the thalamus and whole brain.
C44 and C66 are pure shear coefficients, which are parallel (shear plane) and perpendicular to the fiber axis, respectively. We believe that since gray matter is relatively isotropic, we expect both isotropic and anisotropic measures to correlate. Additionally, from these results, it can be observed that each tensor coefficient in anisotropic measurements in the white matter has different sensitivity for different regions of interest. A study [12] by Romano et al has found two sensitive anisotropic shear moduli components C44 and C66 in CSTs to be significantly reduced in amyotrophic lateral sclerosis (ALS) patients when compared to healthy controls.
This study also found a negative correlation in C22 and C66 for the whole brain. The whole brain consists of white matter (anisotropic) and gray matter (relatively isotropic), where the stiffness values are an average of both isotropic and anisotropic measurements. Additionally, C22 and C66 are the stiffness coefficients that are perpendicular to the fiber direction and in the plane orthogonal to the fiber direction, respectively. Since isotropic measurements estimate only shear component and the anisotropic stiffness coefficients, C22 and C66 are also shear to the fiber direction, we believe that this might be the reason for a correlation between two measurements. Furthermore, the negative correlation might be attributed to the average effect of stiffness from different regions in the whole brain and also age being one of the confounding factors.
Previous studies [3, 4] have shown dependence of isotropic measurements on sex. However, in our study such dependence in isotropic as well as anisotropic measurements was not observed.
As per our knowledge, no other study has looked into the relationship between isotropic and anisotropic stiffness measurements. So, it is hard to compare against existing literature. Anisotropic stiffness provides more information about shear components in different planes as compared to isotropic stiffness. However, we need to estimate both isotropic and anisotropic together, wherein aged population the stiffness become relatively isotropic [35]. Additionally, we believe that understanding both isotropic and anisotropic is very critical as different diseases behave differently and help in designing appropriate therapeutic agents.
There are several limitations in this study. First, the Helmholtz wave equation used in our study for both isotropic and anisotropic methods assume that the waves are propagating in the infinite medium, which is not the case in the brain. However, the initial wavenumber was estimated based on the entire 3D data and then the appropriate window was chosen to filter the data both for longitudinal and shear components in anisotropic stiffness tensor, which would not be potentially biased by the infinite medium assumption. Whereas, for the isotropic measurements, a half wavelength is required to appropriately estimate the stiffness of the brain without being biased by the infinite medium assumption. For the given excitation frequency more than half wavelength existed in the brain to estimate the isotropic stiffness using 3D LFE. Second, LFE might introduce partial volume effects in different regions of the brain. This might also be the case when using direct inversion (the method used for anisotropic stiffness estimation), as kernel sizes when estimating the derivatives might introduce this partial volume effect. Additionally, the spatial-spectral filter applied when estimating anisotropic stiffness coefficients is similar to applying a directional filter with lognormal filters in LFE. Therefore, comparing LFE-derived isotropic stiffness measurements against anisotropic stiffness coefficients obtained in this study is justified. Third, we have not considered the volume change in the brain across subjects. One study [10] has reported that there is a significant decrease in whole brain volume and an increase in ventricular volume with increasing age. Significant brain volume change may affect stiffness in some way. Fourth, acceleration in atrophy rates was found [10] with increasing age more significantly especially after 70 years of age. However, our study only has subjects up to 62 years of age. Since, our study did not include complete age range i.e. >65years, these results may not provide a complete understanding of stiffness variation with age. Finally, we did not include any patient population in our study. However, in the future, we will include specific patient population (such as multiple sclerosis, Alzheimer’s and ALS) to understand both isotropic and anisotropic stiffness to compare against age-matched controls.
In conclusion, this study has shown that overall brain isotropic stiffness decreases with age and is more significant in gray matter. Similarly, a significant correlation was observed in anisotropic stiffness with age in gray matter. Additionally, there is a significant correlation between isotropic and anisotropic stiffness measurements particularly in gray matter and in some of the coefficients in other regions of the brain. It is our understanding that both isotropic and anisotropic stiffness measurements are important in understanding different brain diseases.
Acknowledgement
We would like to acknowledge our grant supporting agency NIH-NHLBI; Grant Number: NIH-R01HL124096. We would also like to thank Dr. Richard Ehman for providing MRELab software and pillow driver.
References
- 1.Morrison John H., and Hof Patrick R.. “Life and death of neurons in the aging brain.” Science 2785337 (1997): 412–419. [DOI] [PubMed] [Google Scholar]
- 2.Fung YC, 2013. Biomechanics: mechanical properties of living tissues. Springer Science & Business Media. [Google Scholar]
- 3.Sack I, Beierbach B, Wuerfel J, et al. (2009). The impact of aging and gender on brain viscoelasticity. Neuroimage, 46(3), 652–657. [DOI] [PubMed] [Google Scholar]
- 4.Arani A, Murphy MC, Glaser KJ, et al. (2015). Measuring the effects of aging and sex on regional brain stiffness with MR elastography in healthy older adults. Neuroimage, 111, 59–64. [DOI] [PMC free article] [PubMed] [Google Scholar]
- 5.Margulies Susan S., and Prange MT. “Regional, directional, and age-dependent properties of the brain undergoing large deformation.” J Biomech Eng 124 (2002): 244–252. [DOI] [PubMed] [Google Scholar]
- 6.Wuerfel J, Paul F, Beierbach B, et al. (2010). MR-elastography reveals degradation of tissue integrity in multiple sclerosis. Neuroimage, 49(3), 2520–2525. [DOI] [PubMed] [Google Scholar]
- 7.Streitberger KJ, Wiener E, Hoffmann J, et al. (2011). In vivo viscoelastic properties of the brain in normal pressure hydrocephalus. NMR in Biomedicine, 24(4), 385–392. [DOI] [PubMed] [Google Scholar]
- 8.Freimann FB, Streitberger KJ, Klatt D, et al. (2012). Alteration of brain viscoelasticity after shunt treatment in normal pressure hydrocephalus. Neuroradiology, 54(3), 189–196. [DOI] [PubMed] [Google Scholar]
- 9.Murphy MC, Huston J, Jack CR, et al. (2011). Decreased brain stiffness in Alzheimer’s disease determined by magnetic resonance elastography. Journal of magnetic resonance imaging, 34(3), 494–498. [DOI] [PMC free article] [PubMed] [Google Scholar]
- 10.Scahill RI, Frost C, Jenkins R, et al. (2003). A longitudinal study of brain volume changes in normal aging using serial registered magnetic resonance imaging. Archives of neurology, 60(7), 989–994. [DOI] [PubMed] [Google Scholar]
- 11.Romano A, Scheel M, Hirsch S, et al. (2012). In vivo waveguide elastography of white matter tracts in the human brain. Magnetic resonance in medicine, 68(5), 1410–1422. [DOI] [PubMed] [Google Scholar]
- 12.Romano A, Guo J, Prokscha T, et al. (2014). In vivo waveguide elastography: effects of neurodegeneration in patients with amyotrophic lateral sclerosis. Magnetic resonance in medicine, 72(6), 1755–1761. [DOI] [PubMed] [Google Scholar]
- 13.Feng Y, Okamoto RJ, Namani R, et al. (2013). Measurements of mechanical anisotropy in brain tissue and implications for transversely isotropic material models of white matter. Journal of the mechanical behavior of biomedical materials, 23, 117–132. [DOI] [PMC free article] [PubMed] [Google Scholar]
- 14.Schmidt JL, Tweten DJ, Badachhape AA, Reiter AJ, Okamoto RJ, Garbow JR and Bayly PV, 2018. Measurement of anisotropic mechanical properties in porcine brain white matter ex vivo using magnetic resonance elastography. Journal of the mechanical behavior of biomedical materials, 79, pp.30–37. [DOI] [PMC free article] [PubMed] [Google Scholar]
- 15.Johnson CL, McGarry MD, Gharibans AA, et al. (2013). Local mechanical properties of white matter structures in the human brain. Neuroimage, 79, 145–152. [DOI] [PMC free article] [PubMed] [Google Scholar]
- 16.Sack I, Beierbach B, Hamhaber U, et al. (2008). Non‐invasive measurement of brain viscoelasticity using magnetic resonance elastography. NMR in Biomedicine, 21(3), 265–271. [DOI] [PubMed] [Google Scholar]
- 17.Kruse SA, Rose GH, Glaser KJ, et al. (2008). Magnetic resonance elastography of the brain. Neuroimage, 39(1), 231–237. [DOI] [PMC free article] [PubMed] [Google Scholar]
- 18.Green MA, Bilston LE, & Sinkus R (2008). In vivo brain viscoelastic properties measured by magnetic resonance elastography. NMR in Biomedicine, 21(7), 755–764. [DOI] [PubMed] [Google Scholar]
- 19.Qin EC, Sinkus R, Geng G, et al. (2013). Combining MR elastography and diffusion tensor imaging for the assessment of anisotropic mechanical properties: a phantom study. Journal of Magnetic Resonance Imaging, 37(1), 217–226. [DOI] [PubMed] [Google Scholar]
- 20.Ning X, Zhu Q, Lanir Y, & Margulies SS (2006). A transversely isotropic viscoelastic constitutive equation for brainstem undergoing finite deformation. Journal of biomechanical engineering, 128(6), 925–933. [DOI] [PubMed] [Google Scholar]
- 21.Chamarthi SK, Raterman B, Mazumder R, et al. (2014). Rapid acquisition technique for MR elastography of the liver. Magnetic resonance imaging, 32(6), 679–683. [DOI] [PMC free article] [PubMed] [Google Scholar]
- 22.Manduca A, Lake DS, Kruse SA, & Ehman RL (2003). Spatio-temporal directional filtering for improved inversion of MR elastography images. Medical image analysis, 7(4), 465–473. [DOI] [PubMed] [Google Scholar]
- 23.Manduca A, Oliphant TE, Dresner MA, et al. (2001). Magnetic resonance elastography: non-invasive mapping of tissue elasticity. Medical image analysis, 5(4), 237–254. [DOI] [PubMed] [Google Scholar]
- 24.Perona P and Malik J, 1990. Scale-space and edge detection using anisotropic diffusion. IEEE Transactions on pattern analysis and machine intelligence, 12(7), pp.629–639. [Google Scholar]
- 25.Gerig G, Kubler O, Kikinis R and Jolesz FA, 1992. Nonlinear anisotropic filtering of MRI data. IEEE Transactions on medical imaging, 11(2), pp.221–232. [DOI] [PubMed] [Google Scholar]
- 26.Kovesi PD, 2000. MATLAB and Octave functions for computer vision and image processing.
- 27.Romano AJ, Abraham PB, Rossman PJ et al. Determination and analysis of guided wave propagation using magnetic resonance elastography. Magnetic Resonance in Medicine: An Official Journal of the International Society for Magnetic Resonance in Medicine 544 (2005): 893–900. [DOI] [PubMed] [Google Scholar]
- 28.McGee KP, Lake D, Mariappan Y, et al. ;, Calculation of shear stiffness in noise dominated magnetic resonance elastography data based on principal frequency estimation. Phys Med Biol, 2011. 56(14): p.4291–309. [DOI] [PMC free article] [PubMed] [Google Scholar]
- 29.Moeendarbary E, Weber IP, Sheridan GK, et al. (2017). The soft mechanical signature of glial scars in the central nervous system. Nature Communications, 8, 14787. [DOI] [PMC free article] [PubMed] [Google Scholar]
- 30.Pakkenberg B, Pelvig D, Marner L, et al. (2003). Aging and the human neocortex. Experimental gerontology, 38(1), 95–99. [DOI] [PubMed] [Google Scholar]
- 31.Sack I, Streitberger KJ, Krefting D, Paul F and Braun J, 2011. The influence of physiological aging and atrophy on brain viscoelastic properties in humans. PloS one, 6(9), p.e23451. [DOI] [PMC free article] [PubMed] [Google Scholar]
- 32.Hiscox LV, Johnson CL, McGarry MD, Perrins M, Littlejohn A, van Beek EJ, Roberts N and Starr JM, 2018. High-resolution magnetic resonance elastography reveals differences in subcortical gray matter viscoelasticity between young and healthy older adults. Neurobiology of aging, 65, pp.158–167. [DOI] [PMC free article] [PubMed] [Google Scholar]
- 33.Guo J, Hirsch S, Fehlner A, et al. 2013. Towards an elastographic atlas of brain anatomy. PLoS One, 8(8), p.e71807. [DOI] [PMC free article] [PubMed] [Google Scholar]
- 34.Peters A (2002). The effects of normal aging on myelin and nerve fibers: a review. Journal of neurocytology, 31(8-9), 581–593. [DOI] [PubMed] [Google Scholar]
- 35.Hsu JL, Leemans A, Bai CH, et al. (2008). Gender differences and age-related white matter changes of the human brain: a diffusion tensor imaging study. Neuroimage, 39(2), 566–577. [DOI] [PubMed] [Google Scholar]


