Abstract
Purpose
Dual‐energy CT (DECT) has been shown to have a great potential in reducing the uncertainty in proton stopping power ratio (SPR) estimation, when compared to current standard method — the stoichiometric method based on single‐energy CT (SECT). However, a few recent studies indicated that imaging noise may have a substantial impact on the performance of the DECT‐based approach, especially at a high noise level. The goal of this study is to quantify the uncertainty in SPR and range estimation caused by noise in the DECT‐based approach under various conditions.
Methods
Two widely referred parametric DECT methods were studied: the Hünemohr‐Saito (HS) method and the Bourque method. Both methods were calibrated using Gammex tissue substitute inserts scanned on the Siemens Force DECT scanner. An energy pair of 80 and 150 kVp with a tin filter was chosen to maximize the spectral separation. After calibrating the model with the Gammex phantom, CT numbers were synthesized using the density and elemental composition from ICRU 44 human tissues to be used as a reference, in order to evaluate the impact of noise alone while putting aside other sources of uncertainty. Gaussian noise was introduced to the reference CT numbers and its impact was measured with the difference between estimated SPR and its noiseless reference SPR. The uncertainty caused by noise was divided into two independent categories: shift of the mean SPR and variation of SPR. Their overall impact on range uncertainty was evaluated on homogeneous and heterogeneous tissue samples of various water equivalent path lengths (WEPL).
Results
Due to the algorithms being nonlinear and/or having hard thresholds in the CT number to SPR mapping, noise in the CT numbers induced a shift in the mean SPR from its noiseless reference SPR. The degree of the mean shift was dependent on the algorithm and tissue type, but its impact on the SPR uncertainty was mostly small compared to the variation. All mean shifts observed in this study were within 0.5% at a noise level of 2%. The ratio of the influence of variation to mean shift was mostly greater than 1, indicating that variation more likely determined the uncertainty caused by noise. Overall, the range uncertainty (95th percentile) caused by noise was within 1.2% and 1.0% for soft and bone tissues, respectively, at 2% noise with 50 voxels. This value can be considered an upper limit as more voxels and lower noise level rapidly decreased the uncertainty.
Conclusions
We have systematically evaluated the impact of noise to the DECT‐based SPR estimation and identified under various conditions that the variation caused by noise is the dominant uncertainty‐contributing component. We conclude that, based on the noise level and tumor depth, it is important to estimate and include the uncertainty due to noise in estimating the overall range uncertainty before implementing a small margin in the range of 1%.
Keywords: dual‐energy CT (DECT), effective atomic number (EAN), electron density ratio (EDR), random noise, stopping power ratio (SPR) estimation
1. Introduction
Proton radiotherapy has clear theoretical advantages over conventional photon‐based radiotherapy because of its unique dosimetric characteristics known as the Bragg peak. However, the advantages of proton cannot be fully utilized in many cases due to its susceptibility to uncertainties, especially range uncertainty.1, 2 Range uncertainty not only causes healthy tissues to receive unnecessarily high dose because of the extra planning margin but also can result in suboptimal beam angle selection (e.g., avoiding ideal beam angles due to critical organs located closely distal to the target). This prevents fully exploiting the high‐dose gradient at the distal end of the proton beam.
One major source contributing to the range uncertainty is the uncertainty in proton stopping power ratio (SPR) estimation. Currently, proton SPR is derived from patient's CT images through a calibration curve. The most widely used method of determining the calibration curve is the stoichiometric method proposed by Schneider et al.3 The major disadvantage of the single calibration curve‐based method is the degeneracy between CT number and SPR because these two quantities describe two completely different physical interactions and hence have no one‐to‐one correspondence. As a result, the single‐energy CT (SECT)‐based method has been shown to be sensitive to potential tissue composition variation between different individuals.4
Dual‐energy CT (DECT)‐based approaches have demonstrated their capability of reducing this uncertainty5, 6, 7, 8 as well as their clinical applicability and relevance to the patient.9, 10, 11, 12, 13 Various methods have been proposed that estimate proton SPR using two or more CT numbers acquired from different energy spectra. Most methods calculate electron density relative to water () and effective atomic number (Z) and convert Z to mean excitation energy (I) based on an empirical relationship, followed by calculating SPR using Bethe‐Bloch equation with obtained and I.14, 15 Han et al. proposed a method that decomposes the images into two basis materials and calculates SPR based on the proportion of each material.16 Taasti et al. proposed a completely empirical approach which fits CT numbers to SPR directly with a predefined function.17 Most DECT methods have been shown to be robust against tissue composition variation and to achieve uncertainty less than 1% under an ideal condition.18, 19
In our recent study, we showed that DECT‐based methods are particularly susceptible to imaging uncertainty, that is, a systematic uncertainty (error) in the measured CT number mainly caused by the beam hardening effect.20 We chose to omit imaging noise in the uncertainty budget because noise was thought to only cause random variation, which will be averaged out in range calculation.21 However, a recent study by Brousmiche et al., which evaluated the impact of imaging noise on SPR estimation for the SECT stoichiometric method, suggested that gaussian noise may not only cause random variation but also cause systematic error due to the existence of hard thresholds in the calibration curve.22 Another recent study by Bar et al. also investigated the impact of imaging noise to the DECT‐based methods and compared the performance of DECT‐based methods with the SECT‐based method under different noise levels.23 Their study also demonstrated that random imaging noise can cause systematic shift of mean SPR and pointed out that the DECT‐based approach might lose its advantage over the SECT‐based approach at a high noise level. However, their conclusion was largely based on an analysis on the error histogram of one particular simulated pelvic CT slice, which has a very specific weight distribution of only a few tissue types and hence is hard to be generalized for the whole population. We believe that it is important to evaluate this impact for each individual tissue type and then derive the overall uncertainty estimate based on the weights of each tissue type, that is, equal weight or weights specific to certain treatment sites. Recently, there has been a few publications experimentally demonstrating with real animal tissues that the DECT methods can achieve range uncertainty of around 1% or less,5, 6, 8, 24 which makes it even more important to fully understand the impact from imaging noise before applying a tight margin like 1%.
The goal of this study is to systematically evaluate the impact of random imaging noise to the accuracy of the DECT‐based SPR estimation. This study used two widely referred parametric DECT methods: the Hünemohr‐Saito (HS) method, a generalized method from multiple previous works,19, 20, 25, 26 and the Bourque method, a method proposed by Bourque et al.18 Questions to be answered through this study include (a) what is the general behavior of the shift of mean SPR for different DECT models; (b) which tissue type suffers the most from this systematic uncertainty, (c) how the impact from the mean shift is compared to that from random variation; and (d) what is a good/robust estimate of the overall impact from imaging noise under different conditions and how it is compared to other uncertainty contributing factors of the DECT approach.
2. Materials and methods
2.A. DECT‐based SPR estimation methods
Many DECT‐based methods comprise three steps: (a) estimating EDR () and EAN (Z) from the CT numbers of two energies, (b) converting Z to mean excitation energy (I), and (c) calculating SPR using the Bethe‐Bloch formula as
| (1) |
where is the rest mass of an electron, c is the speed of light, β is the velocity of proton in vacuum relative to the speed of light, and is the mean excitation energy of water (i.e., 75 eV in this study). In the following section, we briefly describe the two selected calibration‐based DECT methods for estimating and Z. Readers can refer to the respective original publication for further details.
2.A.1. The Hunemohr‐Saito (HS) method
Saito et al. proposed a linear regression‐based method for estimating in 2012,25 which mainly approximates as a linear combination of attenuation coefficients (or CT numbers). Later, Hunemohr et al. used a similar concept to estimate Z.19 In our previous study, we presented a more generalized model and referred it as the “HS method.”20 The generalized model can be succinctly expressed as
| (2) |
| (3) |
where () is the attenuation coefficient of x ray relative to water (), n is the Mayneord's exponent (i.e., approximately in the range (3, 3.3), empirically determined), and and () are parameters for calibration. Intuitively, the calibration can be viewed as fitting the plane of relative attenuation coefficients to followed by , both with linear regression.
2.A.2. The Bourque (B) method
Bourque et al. proposed a polynomial regression‐based method that uses polynomials of dual‐energy index (DEI) or dual‐energy ratio (DER) to estimate Z (i.e., defined as in the original publication),27 followed by polynomials of Z to estimate . The equations can be summarized as
| (4) |
| (5) |
where Γ is either DEI () or DER (), and are parameters for fitting (), and K and M are polynomial orders that need to be tuned to balance between the accuracy and stability of the algorithm.18, 23 After and are obtained by fitting the equation [Eq. (5)], is obtained by averaging the two energies as
| (6) |
2.A.3. Z‐to‐I conversion
and Z can be estimated by using one of the DECT‐based models mentioned earlier, but to use the Bethe‐Bloch equation [Eq. (1)] to calculate SPR, I must be obtained. Here, we introduce three Z‐to‐I conversions that were proposed by Yang (Y), Saito (S), and Bourque (B) (Fig. 1).
Figure 1.
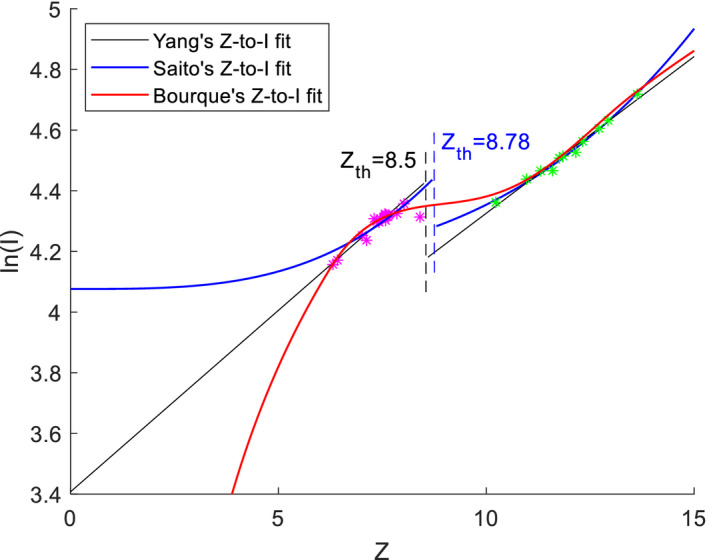
Z‐to‐I conversions proposed by Yang (Y), Saito (S), and Bourque (B). All three methods were fitted using the ICRU 44 reference human tissues. Magenta asterisks indicate soft tissues and green asterisks indicate bone tissues. [Color figure can be viewed at wileyonlinelibrary.com]
Yang et al. proposed an empirical Z‐to‐I conversion that fits Z to linearly with a threshold at Z = 8.5 to separate soft and bone tissues.28 The fitting can be expressed as
| (7) |
Saito et al. also proposed an empirical Z‐to‐I conversion similar to Yang's fitting, but differs in that it linearly fits to instead of Z to , with a threshold at Z = 8.78.26 The fitting can be expressed as
| (8) |
Bourque et al. proposed using a combination of polynomial and linear fitting to make the fit continuous.18 Bourque's fitting can be expressed as
| (9) |
Hereafter, for simplicity, we will use “ and Z estimation method + Z‐to‐I conversion method” to denote a combination for SPR estimation. For example, HS + Y will denote the HS method for and Z estimation and the Yang method for Z‐to‐I conversion.
2.A.4. Model parameters and adjustments
We set n = 3.3 for the HS method and K = 3 and M = 6 for the Bourque method.20, 23 The Z‐to‐I conversion parameters were calibrated using the ICRU 44 reference human tissues for both methods.29 A 200 MeV proton beam was assumed when calculating the Bethe‐Bloch equation. In addition, we restrained Z as 6 < Z < 15 to prevent algorithms from producing negative or complex values of , Z, or SPR with noisy CT numbers.
2.B. Data preparation
2.B.1. Calibration
The material inserts provided in Gammex RMI467 phantom (Gammex, Middleton, WI, USA) were used for calibration for both the HS method and the Bourque method, which include LN300, LN450, AP6, BR12, water, solid water, SR2, LV1, IB3, B200, CB2‐30, CB2‐50, and SB3. A small phantom and a large phantom made in‐house were scanned with a Siemens SOMATOM Force DECT scanner (Siemens Healthcare, Forchheim, Germany) with 80 and 150 kVp/Sn energy pair.20 The small phantom mimicking a pediatric patient was circular with a diameter of 16 cm and the large phantom mimicking an adult patient was ellipsoidal with a semimajor axis of 40 cm and a semiminor axis of 28 cm. Both phantoms were scanned using clinical DE AP protocol with automatic exposure control (AEC). The scan was in helical mode with 5 mm slice thickness and 0.6 pitch. For the small phantom, the average tube current time product was 9.5 and 8.5 mAs for 80 and 150 kVp/Sn, respectively, with a display field of view (DFOV) of 200 mm. For the large phantom, the average tube current time product was 358 and 74 mAs for 80 and 150 kVp/Sn, respectively, with a DFOV of 450 mm. Reconstruction kernel was Bf44 with iterative reconstruction strength 3. A 10 mm diameter region of interest was drawn in the middle of the insert to obtain the mean CT number of the insert, and CT numbers from the small phantom and the large phantom were averaged to obtain the mean CT number for each insert. These mean CT numbers and the reference ground truth , Z, and SPR were used to calibrate each method. Calibrated parameters are shown in Table 1.
Table 1.
Calibrated parameters for the HS method and the Bourque method (K = 3 and M = 6)
| Method | Parameter | Array index | |||||
|---|---|---|---|---|---|---|---|
| 1 | 2 | 3 | 4 | 5 | 6 | ||
| HS | a | −2.788E‐01 | 1.271E+00 | −7.593E‐04 | |||
| b | 8.994E+03 | −8.390E+03 | 1.563E+02 | ||||
| Bourque | c | 7.519E+00 | 3.941E+01 | −4.017E+01 | |||
|
|
−1.125E+00 | 1.142E+00 | −2.497E‐01 | 2.633E‐02 | −1.288E‐03 | 2.426E‐05 | |
|
|
4.558E+00 | −1.939E+00 | 4.096E‐01 | −4.216E‐02 | 2.130E‐03 | −4.217E‐05 | |
The Z‐to‐I conversion parameters and can be calibrated using reference human tissue data such as ICRU 44. We used the same parameters used in the original publication by Li et al. and Bourque et al.18, 20 with Yang's fitting values as = 0.1196, = 3.4078, = 0.1033, and = 3.2929. For Saito's fitting, we used ICRU 44 instead of ICRU 46 (Saito's original publication) and obtained fitting values as = 2.8578E‐04, = 4.0762, = 1.0340E‐04, and = 4.1478.26
2.B.2. Data for evaluation
To analyze the impact of noise alone and negate other sources of uncertainty, reference CT numbers and SPRs were calculated from ICRU 44 “reference” human tissues using their elemental composition. As the DECT methods take two CT numbers as the input and produces and Z as the two outputs, it is possible to reverse the calculation and obtain two CT numbers from and Z. By using this approach, reference CT numbers were directly mapped to reference SPRs without error. Introducing noise to the reference CT numbers enabled us to solely analyze the impact of noise without considering other uncertainties. With the elemental composition and mass density, relative attenuation coefficients for the HS method were obtained as
| (10) |
| (11) |
Similarly, for the Bourque method with K = 3, was obtained using the quadratic formula as
| (12) |
and relative attenuation coefficients as
| (13) |
| (14) |
For each of the two methods, CT numbers calculated with the corresponding method were used to evaluate the impact of noise. Reference CT numbers are summarized in Table 2. Note that all CT numbers presented in this paper are shifted CT numbers that is +1000 from the original HU definition (i.e., ). This way, the relative change of HU is directly proportional to the change of linear attenuation coefficient.
Table 2.
List of ICRU 44 human tissues and calculated CT numbers using the HS method and the Bourque (B) method
| # | Tissue | 80 kVp | 150 kVp/Sn | # | Tissue | 80 kVp | 150 kVp/Sn | ||||
|---|---|---|---|---|---|---|---|---|---|---|---|
| HS | B | HS | B | HS | B | HS | B | ||||
| 1 | Adipose | 915 | 904 | 949 | 955 | 18 | Red Marrow | 1012 | 1007 | 1027 | 1028 |
| 2 | Blood | 1065 | 1067 | 1059 | 1059 | 19 | Yellow Marrow | 942 | 930 | 979 | 987 |
| 3 | Brain | 1046 | 1046 | 1043 | 1043 | 20 | Skin | 1079 | 1076 | 1084 | 1084 |
| 4 | Breast | 999 | 993 | 1017 | 1018 | 21 | Spleen | 1063 | 1063 | 1060 | 1059 |
| 5 | Cell Nucleus | 1017 | 1022 | 1005 | 1005 | 22 | Testis | 1041 | 1041 | 1040 | 1040 |
| 6 | Eye Lens | 1053 | 1049 | 1061 | 1061 | 23 | Thyroid | 1099 | 1111 | 1060 | 1061 |
| 7 | GI Tract | 1028 | 1027 | 1031 | 1031 | 24 | Skeleton — Cortical | 2986 | 3031 | 2056 | 2050 |
| 8 | Heart | 1065 | 1066 | 1060 | 1060 | 25 | Skeleton — Cranium | 2300 | 2351 | 1698 | 1714 |
| 9 | Kidney | 1051 | 1051 | 1049 | 1049 | 26 | Skeleton — Femur | 1731 | 1776 | 1385 | 1403 |
| 10 | Liver | 1061 | 1062 | 1059 | 1058 | 27 | Skeleton — Humerus | 1988 | 2037 | 1529 | 1547 |
| 11 | Lung (deflated) | 1053 | 1054 | 1050 | 1049 | 28 | Skeleton — Mandible | 2448 | 2499 | 1778 | 1791 |
| 12 | Lung (inflated) | 248 | 261 | 257 | 260 | 29 | Skeleton — Ribs (2nd, 6th) | 1854 | 1901 | 1466 | 1485 |
| 13 | Lymph | 1036 | 1036 | 1034 | 1034 | 30 | Skeleton — Ribs (10th) | 2098 | 2148 | 1594 | 1612 |
| 14 | Muscle | 1050 | 1050 | 1048 | 1048 | 31 | Skeleton — Sacrum | 1590 | 1632 | 1327 | 1343 |
| 15 | Ovary | 1053 | 1053 | 1051 | 1051 | 32 | Skeleton — Spongiosa | 1380 | 1413 | 1207 | 1218 |
| 16 | Pancreas | 1037 | 1035 | 1041 | 1041 | 33 | Skeleton — Vertebra (C4) | 1881 | 1929 | 1478 | 1497 |
| 17 | Cartilage | 1120 | 1126 | 1097 | 1097 | 34 | Skeleton — Vertebra (D6, L3) | 1685 | 1729 | 1375 | 1392 |
To diversify the “reference” tissues for our test, the ICRU 44 “reference” human tissues were given variations in mass density as well as hydrogen and calcium percentage for soft and bone tissues, respectively, to account for compositional variations among individuals.4 Two thousand “individualized” human tissue samples generated this way had CT numbers slightly deviated from the ICRU 44 “reference” human tissue samples. This dataset covers a wider patient population and helps to reach a more generalized conclusion.
To validate that our calculated CT numbers closely represent real CT numbers, we compared the calculated and measured CT numbers of the tissue substitute inserts (Fig. 2). For CT numbers calculated with the HS method, the RMS difference of 80 kVp was 7.17 and 19.91 HU for soft and bone tissues, respectively, and the RMS difference of 150 kVp/Sn was 4.11 and 4.16 HU for soft and bone tissues, respectively. For CT numbers calculated with the Bourque method, the RMS difference of 80 kVp was 6.96 and 11.22 HU for soft and bone tissues, respectively, and the RMS difference of 150 kVp/Sn was 7.79 and 6.68 HU for soft and bone tissues, respectively. These differences demonstrated the “imperfectness” of the DECT model which was categorized as the modeling uncertainty in our previous study.20
Figure 2.
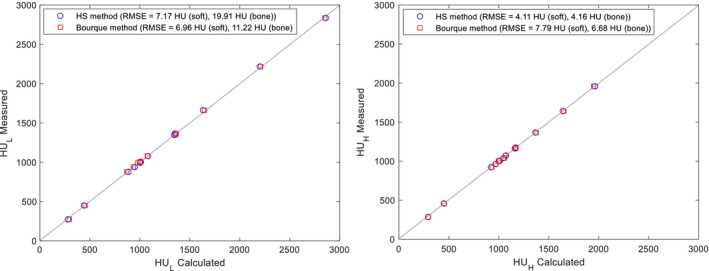
Calculated vs measured CT numbers of the Gammex phantom inserts using the HS method (circle) and the Bourque method (square) for (left) and (right). A 45° line (gray) is drawn as a reference. [Color figure can be viewed at wileyonlinelibrary.com]
2.C. Evaluation of the impact of noise
Throughout the paper, we mainly used HS + Y (HS method with Yang's Z‐to‐I conversion) and B + B (Bourque method with Bourque's Z‐to‐I conversion) to evaluate the impact of noise to these originally proposed algorithms. This way the results are consistent with our previous work and can be directly referred to.20 Only at the end of the study, we compared different combinations of “ and Z estimation” and “Z‐to‐I conversion” to identify the dependence of two steps.
Two components that arise from the noise, that is, the shift of mean SPR and the variation of SPR, were individually analyzed to gauge each of their impact. The shift of mean SPR can be regarded as a measure of the accuracy of SPR estimation because it measures the systematic error. The variation in SPR serves as a measure of the precision of SPR estimation because it measures the random error (fluctuation). The degree of mean shift is dependent on the nonlinear components (i.e., hard thresholds and nonlinear curvatures) in the CT number to SPR mapping. The degree of variation is dependent on the steepness of the slope in the mapping. These two constitute the SPR uncertainty caused by noise.
For a given pair of reference CT numbers, 100,000 samples with gaussian random noise of a specified percentage were generated. The noise was applied to either , , or both (uncorrelated between and ) to identify the impact of low‐ and high‐energy CT numbers independently. This way we were able to identify which of the two energies (i.e., 80 or 150 kVp/Sn) had a larger impact on SPR estimation under the same noise level. This can provide additional information when the noise ratio between low‐ and high‐energy pair is not exactly one as considered in this study and may help optimizing the imaging dose by adjusting the noise ratio. With these samples, the mean shift was calculated as the difference from the mean of the SPR to the SPR of the mean CT numbers expressed as
| (15) |
where is the mean of SPR, and () is the SPR of the mean CT number. The variation was evaluated as the standard deviation of the SPR relative to the shifted mean expressed as
| (16) |
The mean shift and variation were assessed for each tissue. Tissues were grouped into soft and bone tissue and root‐mean‐squared error (RMSE) was taken for each group for groupwise assessment. This result reflects the uncertainty due to noise in an individual voxel for a specific tissue type.
To evaluate the overall impact of noise on range uncertainty, the number of voxels and tissue heterogeneity were considered to estimate its realistic impact. Uncorrelated gaussian noise was added to 50, 100, or 300 voxels (i.e., 5, 10, and 30 cm with 1 mm/pixel resolution) of homogeneous or heterogeneous tissues for both and . For homogeneous tissues, each of the 34 tissues was evaluated individually and RMS was taken to derive the group average for soft and bone tissues separately. For heterogeneous tissues, each voxel was first assigned to a particular tissue group, and then, a random tissue was drawn from that particular group with uniform probability to fill that voxel. The number of voxels assigned to each tissue group was based on the weight of that specific tissue group for a specific tumor site. The weight of each tissue group was calculated by dividing the water equivalent path lengths (WEPL) by the average SPR of each tissue group and renormalized (i.e., voxel weight =, where i is the lung, soft, and bone tissue). Three tumor sites, that is, prostate, lung, and head‐and‐neck (HN), were considered in study. Table 3 lists the WEPL weights of lung, soft, and bone tissue groups for each tumor site used in this study, which was based on our previous studies.4, 20 100,000 samples were simulated for both homogeneous and heterogeneous tissues to calculate the 95th percentile. In this study, the notion of 95th percentile and 2σ was used interchangeably for simplicity.
Table 3.
Heterogeneous tissue distribution for three tumor sites
| Tumor site | WEPL weight (%) | Voxel weight (%) | ||||
|---|---|---|---|---|---|---|
| Lung | Soft | Bone | Lung | Soft | Bone | |
| Prostate | 0.5 | 80.2 | 19.3 | 2.1 | 82.8 | 15.1 |
| Lung | 11.1 | 81.6 | 7.3 | 33.9 | 61.9 | 4.2 |
| Head‐and‐neck | 2.6 | 86.9 | 10.5 | 10 | 82.5 | 7.5 |
WEPL, water equivalent path lengths.
3. Results
3.A. Behavior of the DECT methods in the presence of gaussian noise
We have calculated and plotted the parameters (, Z, and SPR) for all possible CT number combinations within the range (0, 3000) (Fig. 3), which covers the CT number range of a typical patient CT dataset. This was used to obtain an overall picture of the DECT model behavior, especially the possible nonlinearity and hard thresholds existing in the DECT calculations. On generating this plot, we found negative and complex values in Z calculation for both methods, which produced large errors. Because of this, we decided to implement the regularization of 6 < Z < 15 in our calculation. This improved the stability of both methods in the presence of noise.
Figure 3.
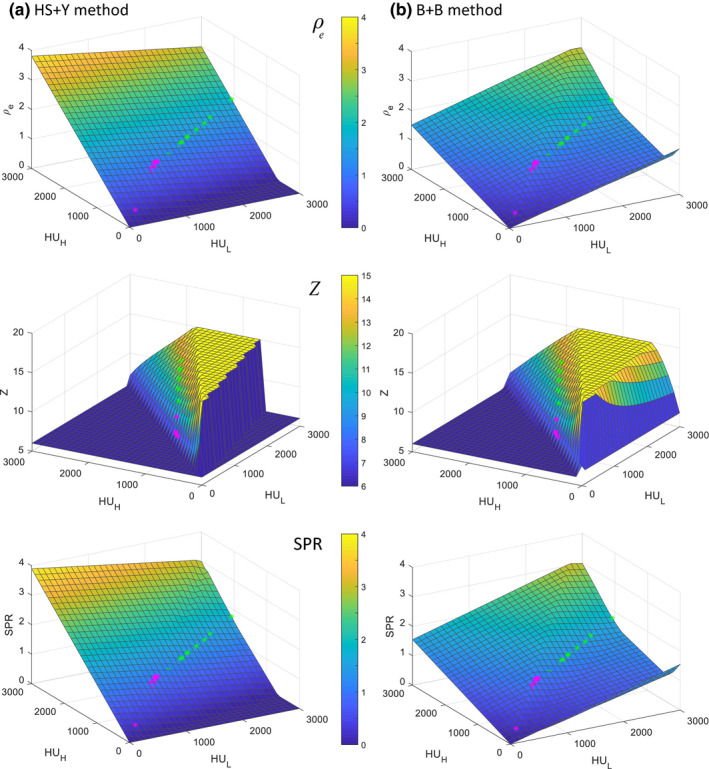
ρ e , Z, and SPR of (a) the HS + Y method and (b) the B + B method with all the possible combinations of CT numbers within (0, 3000) with grid size of 100. Magenta and green asterisks represent soft tissues and bone tissues, respectively, selected from ICRU 44 (Table II). Note that all negative or complex values were forced to zero and Z was regularized to (6, 15) to avoid unrealistic values. [Color figure can be viewed at wileyonlinelibrary.com]
The main difference between these two methods existed in the map; the CT number‐to‐ map of the HS method was linear while that of the Bourque method was not. In the HS method, was calculated first with a linear combination of and , independent of Z, so the calculated fell on a perfect linear plane for all HU combinations, except for the values near boundaries where was forced to zero to avoid negative values. On the contrary, in the Bourque method, Z was calculated first and then was calculated based on Z [Eqs. (4), (5), (6)], so the nonlinear curvature and the regularization used in Z calculation are passed onto . The CT number‐to‐SPR map resembles the map closely for both methods, due to the dominance of in the SPR calculation. The overall SPR distribution of the HS + Y method appears more linear than that of the B + B method.
As the nonlinear regions relevant to the tissue of interest were not clearly visible in the 3D plot in Fig. 3, we plotted line profiles of SPR around an example tissue (adipose) to better illustrate the hard thresholds and nonlinear curvatures in the SPR estimation (Fig. 4). Two hard thresholds were observed for the HS + Y method, whereas one hard threshold was observed for the B + B method. The hard threshold visible in both methods was caused by the regularization of 6 < Z < 15. The other hard threshold only visible in the HS + Y method was = 8.5 for separating soft and bone tissues in the Z‐to‐I conversion. The polynomial function used in the Bourque's Z‐to‐I conversion produced a smooth transition from soft to bone tissues, which prevented an abrupt change of SPR near the boundary.
Figure 4.
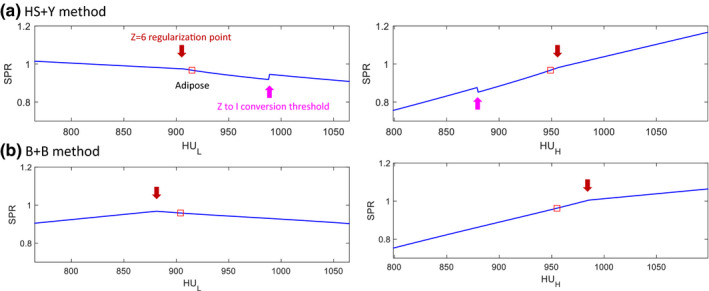
Demonstration of the nonlinearities existing in the CT number to SPR map for (a) the HS + Y method and (b) the B + B method, respectively. Adipose tissue was selected here as an example. Red squares indicate the reference CT numbers of adipose. [Color figure can be viewed at wileyonlinelibrary.com]
Figure 5 shows the distribution of SPR in the presence of gaussian noise, which became asymmetric due to the nonlinearities shown in Figs. 3 and 4. The asymmetric SPR distribution created a difference between the SPR of the mean CT number (black solid lines) and the mean of the SPR (red dashed lines), which is the root cause of the shift of mean SPR. The shift of mean SPR increased with the noise level, as a larger proportion of CT numbers were affected by the nonlinear regions. Similar shift of mean SPR was also reported by Brousmiche et al. for the SECT stoichiometric method and Bar et al. for DECT methods. Their magnitudes were reported to vary depending on the algorithm, tissue type, and noise level.22, 23 Unlike the SPR variation due to noise, the mean shift impacts the SPR systematically and cannot be mitigated by averaging a number of voxels.
Figure 5.
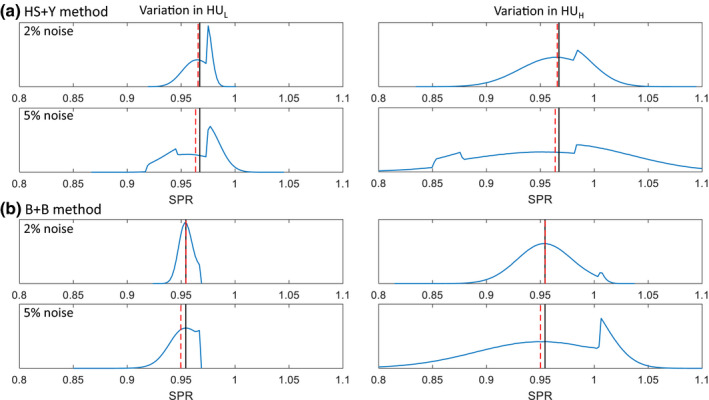
SPR distribution of a soft tissue (adipose) at 2% and 5% noise in and for (a) the HS + Y method and (b) the B + B method, respectively. Black solid lines indicate the SPR of the mean CT numbers (i.e., reference SPR) and red dashed lines indicate the mean of the SPR. [Color figure can be viewed at wileyonlinelibrary.com]
3.B. Uncertainties due to noise: mean shift and variation
Figure 6 visualizes the degree of SPR mean shift for each combination of and . The regions covered by “reference” human tissues and “invidualized” human tissues were highlighted with markers and shades. For the HS + Y method, soft tissues were predominantly affected by the hard thresholds caused by the Z‐to‐I conversion line located lower right from most soft tissues and Z > 6 regularization line located upper left from most soft tissues, as also seen in Fig. 4. Bone tissues had a small mean shift because no hard thresholds or nonlinearity existed nearby. For the B + B method, soft tissues were only affected by the Z > 6 regularization line, but the degree was much smaller than that of the Z‐to‐I conversion line of the HS + Y method. Unlike the HS + Y method, bone tissues experienced a nonlinear curvature in the B + B method, although the degree was small as the cortical bone with the largest mean shift still had less than 0.5% mean shift at 5% noise.
Figure 6.
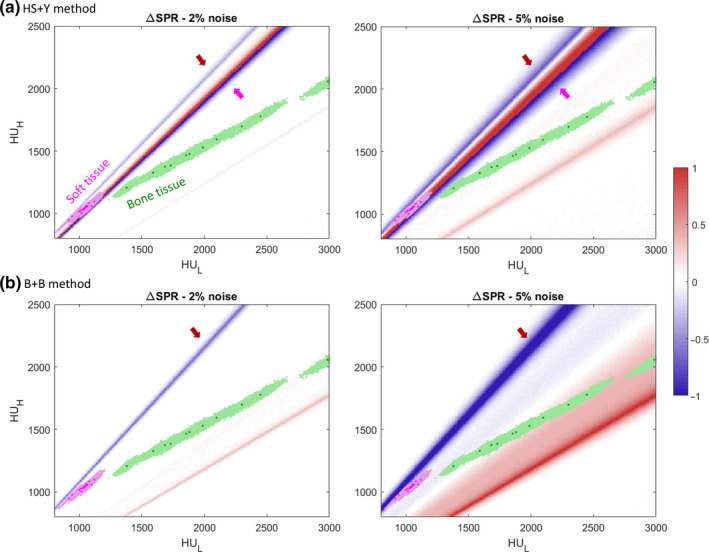
Heatmap of the SPR mean shift (∆SPR) using (a) the HS + Y method and (b) the B + B method at noise levels of 2% and 5%. Values are capped at (−1, 1) for ease of view as shown in the colorbar on the right. Grid size is 10 × 10. Magenta dots mark soft tissues and green dots mark bone tissues from the ICRU 44 reference. Shaded areas of each color denote 2000 individualized human tissue population. Arrows indicate the regions with hard threshold as shown in Fig. 4. [Color figure can be viewed at wileyonlinelibrary.com]
Figure 7 shows the distribution of the mean shift for “individualized” tissue populations in the presence of 2% imaging noise. For the HS + Y method, some soft tissues had a high mean shift (c.f., thyroid was the highest with 1.34%), but bone tissues only had a sharp peak near zero because bone tissues were far away from the nonlinear regions as seen in Fig. 6. For the B + B method, we saw an opposite result as soft tissues had smaller mean shift than bone tissues. The high mean shift of the HS + Y method for thyroid is not surprising as thyroid had a mean Z = 8.41 that is close to the threshold of = 8.5 employed in Yang's Z‐to‐I conversion.
Figure 7.
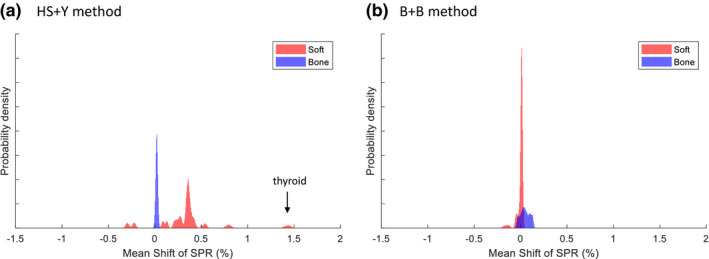
Probability density function (PDF) of the mean shift for 2000 individualized human tissues using (a) the HS + Y method and (b) the B + B method at 2% noise. Twenty‐three soft tissues and 11 bone tissues were considered as is in the ICRU 44 reference. [Color figure can be viewed at wileyonlinelibrary.com]
The magnitude of SPR mean shift for soft and bone tissues are shown as a function of noise level in Fig. 8(a). Noise was added to either , , or both to specify the contribution from each of the two energies. For the HS + Y method, soft tissues had mean shifts of 0.47% at 2% noise and 0.90% at 5% noise, which were much higher than those of bone tissues: 0.02% at 2% noise and 0.12% at 5% noise. For the B + B method, soft tissues had mean shifts of only 0.04% at 2% noise and 0.54% at 5% noise. Bone tissues had higher mean shifts of 0.07% at 2% noise and 0.41% at 5% noise. The growth of mean shift was observed to be an exponential function of noise level except for the soft tissue group with the HS + Y method, putatively due to the influence from double hard thresholds with opposite sign cancelling out each other. For both methods, and contributed with a similar degree to the mean shift.
Figure 8.
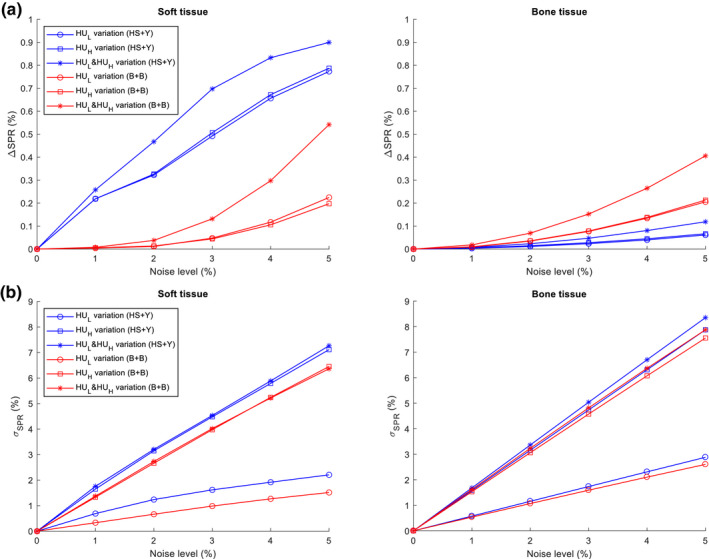
Impact of noise on the SPR estimation manifested as (a) the shift of mean SPR (ΔSPR) and (b) the variation () of SPR with varying levels of noise on , , or both. CT numbers from 2000 individualized human tissue samples were used. [Color figure can be viewed at wileyonlinelibrary.com]
The standard deviation (i.e., variation) of SPR for soft and bone tissues is also shown as a function of noise level [Fig. 8(b)]. Both methods showed a similar trend and similar values for soft and bone tissues. The degree of variation in SPR has been previously shown to be linearly proportional to the variation of CT numbers.20, 21, 30 Unlike the mean shift, however, the variation was dominated by , shown by the fact that adding noise only to and to both and showed a similar degree of variation.20
3.C. Range uncertainty due to noise in homogeneous/heterogeneous tissues
Due to the stochastic nature of the random variation, its overall impact to the range uncertainty depends on the number of samples. Thus, scenarios with varying number of voxels and tissue heterogeneity were studied to estimate the overall range uncertainty.
Figure 9(a) plots the range uncertainty (95th percentile or 2σ) caused by the imaging noise, including the contribution from both the mean shift and the random variation. Since the range uncertainty caused by the variation depends on the number of voxels (tumor depth), we considered three scenarios with homogeneous tissue samples comprising 50, 100, or 300 voxels. The range uncertainty increased with the noise level for both methods and both tissue groups. However, the HS + Y method produced a larger range uncertainty for soft tissues than the B + B method, while both methods showed similar range uncertainty for bone tissues.
Figure 9.
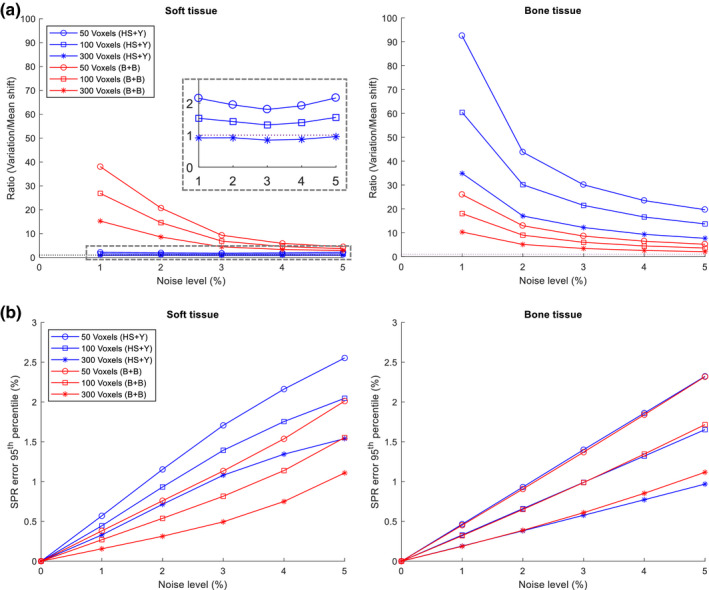
Impact of noise on homogeneous tissues of specified number of voxels with varying levels of noise. (a) The ratio of the influence of the variation (, N is the number of voxels) vs mean shift (ΔSPR). Gray dashed rectangle was magnified to visualize values near 1. (b) The range uncertainty (95th percentile) resulting from the noise. Both and were added with gaussian random noise. [Color figure can be viewed at wileyonlinelibrary.com]
To further compare the relative impact of the mean shift and variation, we plotted the ratio of the overall range uncertainty caused by the variation to that by the mean shift in Fig. 9(b). As expected, we found the ratio of variation to mean shift decreases as the number of voxels increases. In addition, we found that this ratio decreases rapidly as the noise level increases, which indicates that the mean shift increases faster than the variation, except for the HS + Y method when applied to soft tissues. It is also seen in Fig. 9(b) that the ratio of variation to mean shift is substantially larger than 1 under most conditions for both methods, except for the combination of 300 voxels of soft tissues with the HS + Y method which had a ratio slightly smaller than 1. This indicates that the systematic shift only exists in certain conditions and the stochastic variation is usually the dominant uncertainty contributing factor in most conditions.
To confirm the trend seen with homogeneous tissues, we also estimated the range uncertainty (2σ) for heterogeneous tissues for three different tumor sites (Table 4). We chose 50 voxels to demonstrate a worst‐case scenario which will result in the largest overall range uncertainty among studied conditions. Even though multiple different tissues were arbitrarily distributed within a set of 50 voxels, averaging effect still came into play for variation, effectively reducing the range uncertainty in a similar manner as for homogeneous tissues. As the soft tissue was the greatest contributor for all three tumor sites, the range uncertainty (2σ) for heterogeneous tissues was close to that of homogeneous soft tissues. In a realistic condition of 2% noise, the RMSE of three tumor sites was 1.10% with the HS + Y method and 0.83% with the B + B method, which were between the values of homogeneous soft and bone tissues but closer to the soft tissue value.
Table 4.
Range uncertainty (95th percentile) of homogeneous and heterogeneous tissues with 50 voxels
| Tumor site | Range uncertainty (95th percentile) | |||
|---|---|---|---|---|
| HS + Y method | B + B method | |||
| 2% noise | 5% noise | 2% noise | 5% noise | |
| Homogeneous | ||||
| Soft | 1.15 | 2.55 | 0.76 | 2.01 |
| Bone | 0.93 | 2.32 | 0.91 | 2.32 |
| Heterogeneous | ||||
| Prostate | 1.04 | 2.42 | 0.81 | 1.99 |
| Lung | 1.17 | 2.68 | 0.86 | 2.21 |
| Head‐and‐neck | 1.09 | 2.48 | 0.81 | 2.04 |
3.D. Comparison of HS + Y and B + B to other combinations of methods
We also investigated different combinations of “ and Z estimation” and “Z‐to‐I conversion” on SPR mean shift and variation to study the dependence between these two steps (Fig. 10). It is seen that there is a substantial difference in the mean shift among different combinations. By contrast, the variation was rather stable for a given and Z estimation method. We can confirm that the degree and location of hard thresholds impacts the mean shift largely but not the variation. The HS + Y method had the largest mean shift among the combinations we tested, whereas the variations were rather comparable for any HS or B method.
Figure 10.
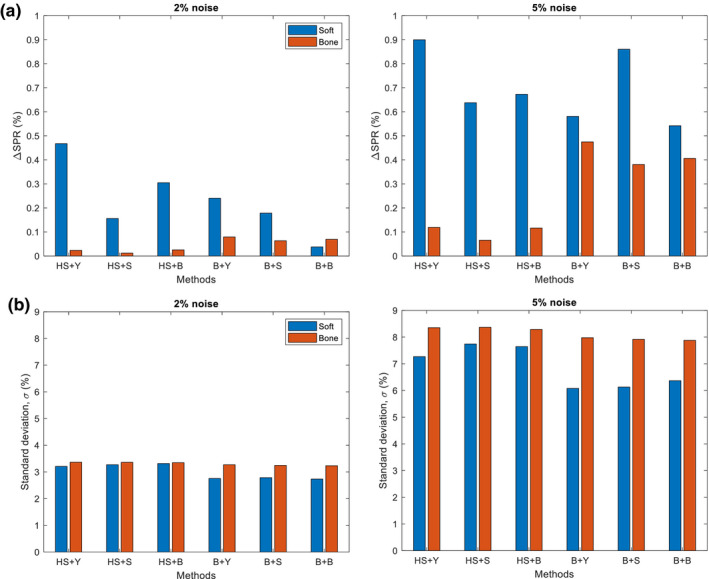
Comparison of (a) SPR mean shift (ΔSPR) and (b) variation () of SPR when using different combinations of methods for the calculation of and Z (Hunemohr‐Saito (HS) and Bourque (B)) and the conversion of Z‐to‐I (Yang (Y), Saito (S) and Bourque (B)). Two different noise levels (2% and 5%) were applied to both and . CT numbers from 2000 individualized human tissue samples were used. [Color figure can be viewed at wileyonlinelibrary.com]
4. Discussion
In this study, we have systematically evaluated the impact of noise on SPR estimation with the DECT algorithms for a generalized tissue population. We evaluated noise as the sole source of uncertainty while leaving aside other uncertainties in order to investigate the impact of noise alone. To make our estimate more robust, we have included more possible CT number pairs by introducing additional tissue composition variation to the “reference” human tissues. In addition, we separated the impact from the mean shift and the variation and were able to demonstrate that the variation component is the dominant contributing factor under most conditions for the two DECT methods implemented in this study. The only exception happened when the tumor was at a deep depth (~30 cm), in which case the mean shift was only slightly larger than the variation with the HS + Y method. Moreover, we estimated the overall range uncertainty for both homogeneous and heterogeneous tissues. Similar uncertainty values were observed for these two groups, which supports that the averaging effect is still in play regardless of tissue heterogeneity.
The regularization 6 < Z < 15 employed in this study was not described in the original studies,18, 20 but this was necessary in order to prevent both algorithms from producing unrealistic values (complex or negative number) with added noise. Especially given that these algorithms involve polynomial or exponential fitting to estimate Z, the value of Z can be distorted substantially with an abnormal combination of CT numbers, which were relieved by setting 6 < Z < 15. Although this created an additional hard threshold in the CT number‐to‐SPR mapping, the overall stability and accuracy were improved with noisy CT numbers.
The HS + Y method showed a larger mean shift than the B + B method for the soft tissue group. We found that the mean shift is sensitive to the specific implementation such as the selection of Z‐to‐I conversion and the selection of specific regularization on Z (no regularization vs Z > 6 vs Z > 0). Possible measures can be taken to reduce the mean shift for the HS + Y method. Among different combinations we have tried with the HS method, Saito's Z‐to‐I conversion method yielded the smallest mean shift (Fig. 10). This HS + S method reduced the mean shift due to noise mainly by linearizing the CT number‐to‐SPR mapping (by substituting with in the Bethe‐Bloch equation26). The use of hard threshold, however, may still be problematic when a large chunk of soft and bone tissue mixture exists near the threshold.31 With knowing these, we did not apply any adjustments to the original HS + Y methods because the scope of this study was to estimate the baseline of the impact of noise.
Unlike the mean shift, SPR random variation stayed relatively consistent among all tissue types within the same tissues group. It was largely due to the fact that SPR variation mainly depends on the slope of the mapping of CT number‐to‐SPR.20, 21, 30 For both the HS + Y method and the B + B method, was much more influential than in estimating the SPR [Fig. 8 (b)] because the slope of to SPR was steeper (Fig. 4). This suggests the possibility of optimizing the ratio of mAs between low‐ and high‐energy CT scans to minimize the total SPR variation under the same amount of total imaging dose, which may be worthwhile to look into in the future.
Our evaluation with heterogeneous tissues produced a similar range uncertainty as that of homogeneous tissues. As expected, the values were closer to that of the soft tissue group because soft tissues take up more than 60–80% of the total weight of each of the three tumor sites (Table 3). The averaging effect was also present in heterogeneous tissues. For a sum of gaussian random variables where is the independent gaussians, the standard deviation relative to the mean is, where is the standard deviation of . This value decreases as the number of (i.e., number of voxels) increases regardless of the identicalness of (i.e., homogeneity of tissues) (c.f., if are identical, then becomes gaussian according to the central limit theorem). With nonlinearities, the distribution of SPR is no longer gaussian; however, the distribution is still fairly symmetrical with both positive and negative values. Because of that, the standard error would still decrease as the number of samples increases. Our test can also be performed on other heterogeneous samples with a different tissue distribution than what is used in this study, but the result is not likely to change much because only certain tissues (e.g., thyroid and cartilage with the HS + Y method) had a large mean shift and the rest had a similar small mean shift and variation within each tissue group.
The root‐sum‐square (RSS) calculation is a standard way to combine the uncertainties from different uncorrelated sources to derive a single value representing the total uncertainty.20 Because of the nature of the RSS calculation, the largest uncertainty usually dominates over other smaller uncertainties. Therefore, the ultimate impact of noise to the total range uncertainty depends on its relative magnitude compared to other uncertainty factors. Our recent study showed that the total range uncertainty without considering noise was 2.4% and 4% (2σ) for the soft and bone tissue group, respectively.20 If the additional uncertainty due to noise at a 2% noise level for a tumor at 5 cm depth (a worst case scenario) is considered, the total uncertainty becomes 2.52% and 4.10% for the soft and bone tissue group, respectively, which is only a marginal increase of 0.12% and 0.10%. However, a few recent experimental validation studies using DECT reported the overall range uncertainty to be around 1% or less.5, 8 If 1% were assumed as the range uncertainty for both the soft and bone tissue groups, the total uncertainty after including the noise becomes 1.52% and 1.37% for the soft and bone tissue group, respectively, which is a decent increase of 0.52% and 0.37%. This suggests that the impact from noise should be well evaluated based on the noise level seen in patient CT images and the tumor depth, before implementing a small treatment margin (~1%) for range uncertainty in the clinic.
One drawback of this study is that only two methods were selected in this study. We did not implement other existing DECT algorithms because it was not our goal to compare different methods and reach a general conclusion which method is more superior. Although B + B method was more robust to noise than HS + Y method, our main focus is to establish a framework for estimating the impact of gaussian noise so that any center can do their own estimate for their selected DECT algorithm.
5. Conclusion
We have systematically evaluated the impact of noise on SPR estimation using two parametric DECT methods. Mean shift and variation of SPR due to noise were thoroughly investigated as to how they constitute the SPR uncertainty. DECT methods with hard thresholds suffered the most from the mean shift, and the mean shift was mostly observed in soft tissues. Nonetheless, the impact of mean shift was relatively small compared to the random variation caused by the noise, except for a certain method and tissue type. Range uncertainty due to noise was approximately 1% (2σ or 95th percentile) at 2% noise level and 2.5% at 5% noise level. Compared to the uncertainty of 2.4% (soft) and 4% (bone) caused by other factors, low noise is not a major concern. However, if we were to implement a small margin of 1% for the proton range, it is important to estimate and include the uncertainty due to noise. By knowing how much impact the noise can make among other SPR uncertainties, future studies will be able to focus on decreasing the uncertainty that is most influential to the range estimation.
Conflict of interest
The authors have no conflicts to disclose.
Acknowledgments
We thank Parkland Hospital for granting access to the Siemens SOMATOM Force DECT scanner. This work was partially supported by the Cancer Prevention and Research Institute of Texas grant (RP160661), NIH grant (P20CA183639‐01A1), National Natural Science Foundation of China (No. 81571771), and the Ministry of Science and Technology of China (No. 2015BAI01B10).
References
- 1. Baumann M, Krause M, Overgaard J, et al. Radiation oncology in the era of precision medicine. Nat Rev Cancer. 2016;16:234–249. [DOI] [PubMed] [Google Scholar]
- 2. Bortfeld TR, Loeffler JS. Three ways to make proton therapy affordable. Nature. 2017;549:451–453. [DOI] [PubMed] [Google Scholar]
- 3. Schneider U, Pedroni E, Lomax A. The calibration of CT Hounsfield units for radiotherapy treatment planning. Phys Med Biol. 1996;41:111–124. [DOI] [PubMed] [Google Scholar]
- 4. Yang M, Zhu XR, Park PC, et al. Comprehensive analysis of proton range uncertainties related to patient stopping‐power‐ratio estimation using the stoichiometric calibration. Phys Med Biol. 2012;57:4095–4115. [DOI] [PMC free article] [PubMed] [Google Scholar]
- 5. Mohler C, Russ T, Wohlfahrt P, et al. Experimental verification of stopping‐power prediction from single‐ and dual‐energy computed tomography in biological tissues. Phys Med Biol. 2018;63:025001. [DOI] [PubMed] [Google Scholar]
- 6. Taasti VT, Michalak GJ, Hansen DC, et al. Validation of proton stopping power ratio estimation based on dual energy CT using fresh tissue samples. Phys Med Biol. 2018;63:015012. [DOI] [PubMed] [Google Scholar]
- 7. Wohlfahrt P, Mohler C, Richter C, Greilich S. Evaluation of stopping‐power prediction by dual‐ and single‐energy computed tomography in an anthropomorphic ground‐truth phantom. Int J Radiat Oncol. 2018;100:244–253. [DOI] [PubMed] [Google Scholar]
- 8. Bar E, Lalonde A, Zhang RX, et al. Experimental validation of two dual‐energy CT methods for proton therapy using heterogeneous tissue samples. Med Phys. 2018;45:48–59. [DOI] [PubMed] [Google Scholar]
- 9. Hudobivnik N, Schwarz F, Johnson T, et al. Comparison of proton therapy treatment planning for head tumors with a pencil beam algorithm on dual and single energy CT images. Med Phys. 2016;43:495–504. [DOI] [PubMed] [Google Scholar]
- 10. Wohlfahrt P, Mohler C, Hietschold V, et al. Clinical implementation of dual‐energy CT for proton treatment planning on pseudo‐monoenergetic CT scans. Int J Radiat Oncol. 2017;97:427–434. [DOI] [PubMed] [Google Scholar]
- 11. Wohlfahrt P, Mohler C, Stutzer K, Greilich S, Richter C. Dual‐energy CT based proton range prediction in head and pelvic tumor patients. Radiother Oncol. 2017;125:526–533. [DOI] [PubMed] [Google Scholar]
- 12. Wohlfahrt P, Troost EGC, Hofmann C, Richter C, Jakobi A. Clinical feasibility of single‐source dual‐spiral 4D dual‐energy ct for proton treatment planning within the thoracic region. Int J Radiat Oncol. 2018;102:830–840. [DOI] [PubMed] [Google Scholar]
- 13. Taasti VT, Muren LP, Jensen K, et al. Comparison of single and dual energy CT for stopping power determination in proton therapy of head and neck cancer. Phys Imaging Radiat Oncol. 2018;6:14–19. [DOI] [PMC free article] [PubMed] [Google Scholar]
- 14. van Elmpt W, Landry G, Das M, Verhaegen F. Dual energy CT in radiotherapy: current applications and future outlook. Radiother Oncol. 2016;119:137–144. [DOI] [PubMed] [Google Scholar]
- 15. Möhler C, Wohlfahrt P, Richter C, Greilich S. On the equivalence of image‐based dual‐energy CT methods for the determination of electron density and effective atomic number in radiotherapy. Phys Imaging Radiat Oncol. 2018;5:108–110. [DOI] [PMC free article] [PubMed] [Google Scholar]
- 16. Han D, Siebers JV, Williamson JF. A linear, separable two‐parameter model for dual energy CT imaging of proton stopping power computation. Med Phys. 2016;43:600–612. [DOI] [PMC free article] [PubMed] [Google Scholar]
- 17. Taasti VT, Petersen JBB, Muren LP, Thygesen J, Hansen DC. A robust empirical parametrization of proton stopping power using dual energy CT. Med Phys. 2016;43:5547–5560. [DOI] [PubMed] [Google Scholar]
- 18. Bourque AE, Carrier JF, Bouchard H. A stoichiometric calibration method for dual energy computed tomography. Phys Med Biol. 2014;59:2059–2088. [DOI] [PubMed] [Google Scholar]
- 19. Hunemohr N, Krauss B, Tremmel C, Ackermann B, Jakel O, Greilich S. Experimental verification of ion stopping power prediction from dual energy CT data in tissue surrogates. Phys Med Biol. 2014;59:83–96. [DOI] [PubMed] [Google Scholar]
- 20. Li B, Lee HC, Duan X, et al. Comprehensive analysis of proton range uncertainties related to stopping‐power‐ratio estimation using dual‐energy CT imaging. Phys Med Biol. 2017;62:7056–7074. [DOI] [PMC free article] [PubMed] [Google Scholar]
- 21. Chvetsov AV, Paige SL. The influence of CT image noise on proton range calculation in radiotherapy planning. Phys Med Biol. 2010;55:N141. [DOI] [PubMed] [Google Scholar]
- 22. Brousmiche S, Souris K, de Xivry JO, Lee JA, Macq B, Seco J. Combined influence of CT random noise and HU‐RSP calibration curve nonlinearities on proton range systematic errors. Phys Med Biol. 2017;62:8226–8245. [DOI] [PubMed] [Google Scholar]
- 23. Bar E, Lalonde A, Royle G, Lu HM, Bouchard H. The potential of dual‐energy CT to reduce proton beam range uncertainties. Med Phys. 2017;44:2332–2344. [DOI] [PubMed] [Google Scholar]
- 24. Xie YH, Ainsley C, Yin LS, et al. Ex vivo validation of a stoichiometric dual energy CT proton stopping power ratio calibration. Phys Med Biol. 2018;63:055016. [DOI] [PubMed] [Google Scholar]
- 25. Saito M. Potential of dual‐energy subtraction for converting CT numbers to electron density based on a single linear relationship. Med Phys. 2012;39:2021–2030. [DOI] [PubMed] [Google Scholar]
- 26. Saito M, Sagara S. Simplified derivation of stopping power ratio in the human body from dual‐energy CT data. Med Phys. 2017;44:4179–4187. [DOI] [PubMed] [Google Scholar]
- 27. Johnson T, Fink C, Schönberg SO, Reiser MF. Dual Energy CT in Clinical Practice. Berlin, Germany: Springer Science & Business Media; 2011. [Google Scholar]
- 28. Yang M, Virshup G, Clayton J, Zhu XR, Mohan R, Dong L. Theoretical variance analysis of single‐ and dual‐energy computed tomography methods for calculating proton stopping power ratios of biological tissues. Phys Med Biol. 2010;55:1343–1362. [DOI] [PubMed] [Google Scholar]
- 29. White DR, Booz J, Griffith RV, Spokas JJ, Wilson IJ. Tissue substitutes in radiation dosimetry and measurement. ICRU Report 44. 1989. 10.1093/jicru/os23.1.report44 [DOI]
- 30. Yang M, Virshup G, Clayton J, Zhu XR, Mohan R, Dong L. Does kV‐MV dual‐energy computed tomography have an advantage in determining proton stopping power ratios in patients? Phys Med Biol. 2011;56:4499–4515. [DOI] [PMC free article] [PubMed] [Google Scholar]
- 31. Mohler C, Wohlfahrt P, Richter C, Greilich S. Range prediction for tissue mixtures based on dual‐energy CT. Phys Med Biol. 2016;61:N268–N275. [DOI] [PubMed] [Google Scholar]


