Abstract
Purpose
Radiation dose calculated on tumors for radiopharmaceutical therapy varies significantly from tumor to tumor and from patient to patient. Accurate estimation of radiation dose requires multiple time point measurements using radionuclide imaging modalities such as SPECT or PET. In this report, we show our technical development of reducing the number of scans needed for reasonable estimation of tumor and normal organ dose in our pretherapy imaging and dosimetry platform of 124I‐metaiodobenzylguanidine (MIBG) positron emission tomography/computed tomography (PET/CT) for 131I‐MIBG therapy of neuroblastoma.
Methods
We analyzed the simplest kinetic data, areas of two‐time point data for five patients with neuroblastoma who underwent 3 or 4 times of 124I‐MIBG PET/CT scan prior to 131I‐MIBG therapy. The data for which we derived areas were percent of injected activity (%IA) and standardized uptake value of tumors. These areas were correlated with time‐integrated activity coefficients (TIACs) from full data (3 or 4 time points). TIACs are direct correlates with radiation dose as long as the volume and the radionuclide are known.
Results
The areas of %IAs between data obtained from all the two‐time points with time points 1 and 2 (day 0 and day 1), time points 2 and 3 (day 1 and day 2), and time points 1 and 3 (day 0 and day 2) showed reasonable correlation (Pearson's correlation coefficient |r| > 0.5) with not only tumor and organ TIACs but also tumor and organ absorbed doses. The tumor and organ doses calculated using %IA areas of time point 1 and time point 2 were our best fits at about 20% individual percent difference compared to doses calculated using 3 or 4 time points.
Conclusions
We could achieve reasonable accuracy of estimating tumor doses for subsequent radiopharmaceutical therapy using only the two‐time point imaging sessions. Images obtained from these time points (within the 48‐h after administration of radiopharmaceutical) were also viewed as useful for diagnostic reading. Although our analysis was specific to 124I‐MIBG PET/CT pretherapy imaging data for 131I‐MIBG therapy of neuroblastoma and the number of imaging datasets was not large, this feasible methodology would generally be applicable to other imaging and therapeutic radionuclides with an appropriate data analysis similar to our analysis to other imaging and therapeutic radiopharmaceuticals.
Keywords: dosimetry, MIBG, neuroblastoma, radionuclide therapy, tumor dosimetry
1. Introduction
Radiation dose calculated on tumors for radiopharmaceutical therapy (RPT) (i.e., tumor dosimetry) varies significantly from tumor to tumor and from patient to patient.1, 2, 3, 4, 5 Estimation of radiation dose for both normal tissues and tumors require multiple time point measurements, most often using radionuclide imaging modalities such as single photon emission computed tomography (SPECT) or positron emission tomography (PET). Combining these nuclear imaging modalities with anatomical imaging modalities like x‐ray computed tomography (CT) and magnetic resonance imaging (MRI), SPECT/CT, PET/CT, or PET/MRI, provide an easy means of delineating organs and anatomically distinct tumors, which makes the tasks of internal radiation dosimetry more accurate than before.6
The practice of internal radiation dosimetry is typically limited to normal organ/tissue radiation dose estimation for diagnostic imaging probes or to dose‐limiting organs (such as kidneys or liver) for therapeutic radiopharmaceuticals7 if the goal of radiation dosimetry is to ensure the safety of the radiopharmaceuticals. Tumor dosimetry is intended for predicting response, stratification of administration, and improving efficacy of RPT,5 and is an essential component if the goal of internal radiation dosimetry is to personalize dose administration.1, 8, 9 For most external beam radiation therapy applications, planning of the dose is based on how much of radiation will be delivered to the target (i.e., tumors), while sparing dose to organs and other normal tissues as much as possible. Hence, tumor dosimetry, particularly when it is performed prior to therapy, has a significant value for RPT in the era of precision medicine.
In order to accurately predict the dose distribution map from administration of a therapeutic radiopharmaceutical, a tracer amount of the radiopharmaceutical can be administered and scanned at several time points if the radiopharmaceutical emits not only therapeutic radiation such as betas and alphas but also gammas with energies that can be captured by SPECT or PET imaging modalities. Therapeutic radiopharmaceuticals with I‐131 are good examples for this scenario. Therapeutic radiopharmaceuticals with Lu‐177 can be also imaged by SPECT imaging; however, quantitative imaging of Lu‐177 still needs significant improvement that takes account of the low yield of two gamma rays at 113 and 208 keV. Another approach is that a chemically identical radiopharmaceutical to a therapeutic radiopharmaceutical, which is more suitable for radionuclide imaging, can be used. Imaging‐friendly radionuclides such as Y‐86, Cu‐64, and I‐123 or I‐124 for therapeutic radiopharmaceuticals with Y‐90, Cu‐67, and I‐131 are good examples for this scenario.
While pretherapy tumor and organ dosimetry are considered scientifically significant and mostly desirable, there are also significant practical limitations. Logistical challenges of performing additional multiple imaging sessions before the therapy is initiated are not only time‐consuming but also costly. The data to support the accuracy of pretherapy dosimetry for prediction of therapy response10, 11, 12, 13 should be carefully studied for each therapeutic radiopharmaceutical.
At our institution, we have been performing 124I‐metaiodobenzylguanidine (MIBG) pretherapy PET imaging and dosimetry for 131I‐MIBG therapy in patients with neuroblastoma. Although we are still gathering our data to assess the capability of 124I‐MIBG PET for tumor imaging, organ dosimetry, and therapy response to plan 131I‐MIBG therapy, we have a good number of tumors imaged and full time‐integrated activity coefficients (TIACs) calculated to investigate how we can reduce the number of imaging sessions necessary for calculating radiation dose on tumors. This investigation is possible because each patient has more than one evaluable tumor, and we have at least 3 or 4 time point imaging data to compare how the reduction in time points can be correlated with the 3 or 4 time point data in terms of TIAC calculations. TIACs (in the unit of Bq·hr/Bq) are direct correlates with the radiation dose (in Gy) as long as the tumor volume and the kind and amount of radionuclide are known, both of which are readily available in all RPT radiopharmaceuticals.
In this report, we focused on the use of two‐time point data, instead of three or more and how a metric derivable from these data correlates with TIACs in tumors. TIACs are dependent on the kind of pharmaceutical, but radionuclide independent as long as physical decay is corrected; thus, they can be used for calculating doses for both 124I‐MIBG and 131I‐MIBG. Also, we present a quick view of radiation dose estimates for other organs, and particularly for kidneys in each patient, we investigated radiation dosimetry to ensure the general safety of 131I‐MIBG in the dose‐limiting organ (i.e., kidney) from our pretherapy 124I‐MIBG PET imaging and dosimetry data.
2. Materials and methods
2.A. Patient studies
Fifty‐six evaluable metastatic neuroblastoma tumors from five patients (mean age = 14.2 yr old in the range of 8.9–23.4 yr old) were included in our analysis. All patients signed written informed consent for the 124I‐MIBG imaging and dosimetry protocol approved by the local institutional review board prior to the studies. The studies were performed between April 2013 and October 2017.
2.B. Imaging and dosimetry data collection
All patients received 124I‐MIBG administration (1.06 MBq/kg) within 9 days before initiation of 131I‐MIBG therapy. Three patients were scanned four times: on the day of (day 0 or time point 1), 1 day (day 1 or time point 2), 2 days (day 2 or time point 3), and 5 days (day 5 or time point 4) after 124I‐MIBG administration. Two patients were scanned three times, missing one of the time points. Day 0 scan was performed at 2.23 ± 0.99 h postinjection, day 1 scan was performed at 25.14 ± 3.22 h postinjection, day 2 scan was performed at 48.47 ± 4.16 h postinjection, and day 5 scan was performed at 120.11 ± 4.14 h postinjection. Four patient scans were performed on a Discovery VCT PET/CT system (GE Healthcare, Waukesha, WI) at the China Basin Imaging Center of University of California, San Francisco (UCSF) and one patient scan was performed on a Gemini TF PET/CT system (Philips Healthcare, Highland Heights, OH) at the UCSF Benioff Children's Hospital at Mission Bay. Because of the low activity injected and low positron emission branching ratio of 124I‐MIBG, data were acquired for at least 4 min per bed.
2.C. Radiation dose calculation
Organ and tumor segmentation was performed on freely available imaging viewing and analysis software packages (either AMIDE available at amide.sourceforge.net or three‐dimensional Slicer available at www.slicer.org) on the coregistered CT images of PET/CT images. The segmented volumes and the CT images were used as voxelized phantoms for each patient in our radiation dosimetry software based on the Geant4 Monte Carlo simulation toolkit.2 TIAC calculations for both organs and tumors were performed using the CT‐based segmentations masks applied on PET images except for tumors. For these calculations, the full 3 or 4 time point data were used, and they were used as the reference standard for correlation with the two‐time point area of %IAs and standardized uptake values (SUV)s. Tumor volume segmentations were performed on PET images using a thresholding method as metabolic tumor volume (greater than 50% of the maximum uptake in the entire tumor volume) since the anatomical boundaries of tumors were not easily delineated on the CT images. Percent of injected activity (%IA) were calculated for all segmented volumes including tumors over time, and the TIACs were then calculated using kinetics of %IA by fitting a biexponential function supported by the LmFit package of Python. We validated four variables of biexponential fitting curve formula using the chi‐square test and area under the curve test.
2.D. Simplification of TIAC estimation
In order to simplify and develop potentially practical method of tumor dosimetry, we investigated the simplest form of kinetic data that is areas of tumor uptake obtained from the two‐time points. The simplest form of uptake value could be SUV; however, an SUV measured at a fixed time point may not be a good representative of time‐integrated activity in tumors because the normalization factor used for SUV calculation such as patient weight is hardly correlative with individual tumor's metabolism that governs the radiopharmaceutical uptake and absorbed dose. Although there is a single time point‐based technique called dose mapping, that method used a later time point (e.g., single measurement after 4 days for 177Lu‐DOTATATE/DOTATOC).14 For pretherapy dosimetry, which is performed within a small window of time before full therapeutic dose administration, a later time point requirement may be less desirable. Our proposed method relying on early changes provides desired time points for diagnostic reading (1 or 2 days after injection) as well at least in case for 124I‐MIBG, which could be advantageous over the later day time point imaging.
In this report, we used two‐time point areas of %IA values calculated for all possible combinations for the first three time points: areas of %IA between time points 1 and 2 (day 0 and day 1, 1_2TP), between time points 2 and 3 (day 1 and day2, 2_3TP), and between time points 1 and 3 (day 0 and day 2, 1_3TP). Because two patients did not have the time point 3 performed on day 2 (i.e., 2 days after for one patient and 4 days after for the other patient after administration of 124I‐MIBG), areas containing the time point 3 for these patients were excluded. In order to calculate the areas of two‐time points, the TIAC curves were categorized into three types: slope−, slope+, and slope+ of excretion for calculating the TIACs of remainder of the body. Figure 1 shows how these areas were calculated depending on the type using %IAs obtained at time points 2 and 3. In the slope+ of excretion [Fig. 1(c)], the slope was fitted by inverse exponential function and the calculation method for the area under the slope was different from the other two (slope− and slope+). We made a ground truth total body TIAC incorporating excretion of the radiopharmaceutical, and TIACs of all organs and tumors. Figure 1(c) shows the fitted curve of excretion from total body, and the total body TIAC is calculated from this excretion curve. Then, we obtained the TIAC of the remainder of the body, which means everything else excluding the tumors and the specified organs, by subtracting the TIACs of the tumors and the specified organs from the TIAC of the total body. To estimate the TIAC of the total body with two time points, we calculated the area under the curve of excretion using the area (c) equation and obtained correlation results between the reference (4 time point) TIAC of the total body and the area under the curve of excretion estimated using the two‐time points [Fig. 1(c)]. Each area under the two‐time point in Fig. 1 is given by
where y1 and y2 are the %IAs at t1 and t2, respectively, and y0 is the y intercept of the two‐time point [(t1, y1) and (t2, y2)] slope.
Figure 1.

Examples of the calculation of the area under the two‐time points (2 and 3) at slope− (a), slope+ (b), and slope+ of excretion for calculating the time‐integrated activity coefficients of the remainder of the body (c). Note the different y scales. [Color figure can be viewed at wileyonlinelibrary.com]
Finally, we considered 11 specific organs (salivary glands, thyroid, lung, heart, liver, spleen, brain, urinary bladder, adrenal, kidney, and stomach) of all 5 patients, except some organs that did not have visible uptake at all time points for 3 patients: kidney and stomach were excluded for one patient, adrenal and stomach were excluded for another patient, and brain was excluded for the other patient, and generated the organ dose data from these five patients to ensure that the dose to kidneys, the dose‐limiting organ of 131I‐MIBG therapy, is all below the Emami limit (23 Gy) to kidneys15 in our current 131I‐MIBG therapy protocol (666 MBq/kg).
Figure 2 is a flowchart showing absorbed dose calculation of tumors and organs using reference or estimated TIACs and simulated S‐values in this study.
Figure 2.
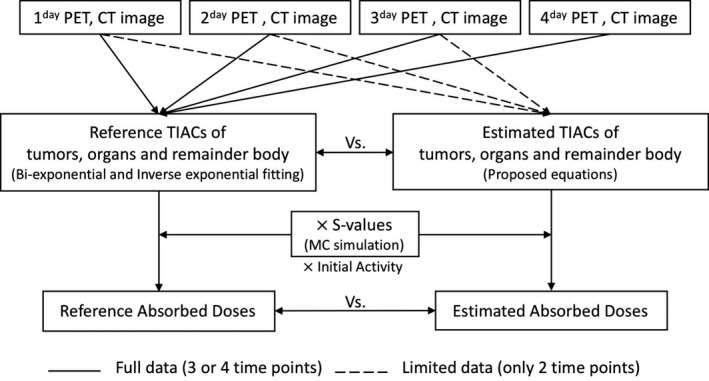
Absorbed dose calculation flowchart of tumors and organs using reference or estimated time‐integrated activity coefficients and S‐values for comparing between them.
2.E. Statistical analysis
Pearson's correlation coefficient (r) was used to measure the statistical relationship between the areas of %IA's or SUVs and TIACs. The absolute value of correlation coefficient (i.e., |r|) greater than 0.5 was interpreted as reasonable correlation between these variables, and P < 0.05 was considered statistically significant.
3. Results
3.A. Adverse events
No radiation‐related adverse events of 124I‐MIBG administration and PET/CT imaging were reported for the patient population included in the analysis of this report.
3.B. Time–activity curves of tumor and normal organ
Figure 3 shows examples of tumors and normal organs’ time–activity curves and biexponential fits. The initial rise and exponential decline of the 124I‐MIBG uptake are good indicators for estimating TIACs in tumors and organs using a biexponential fit function. The slopes connecting combinations of the two‐time points show either the increasing or decreasing trend. With the TIACs and tumor or normal organ volumes segmented, the absorbed dose for each was estimated. This observation is a convincing preliminary investigation that supported our hypothesis.
Figure 3.
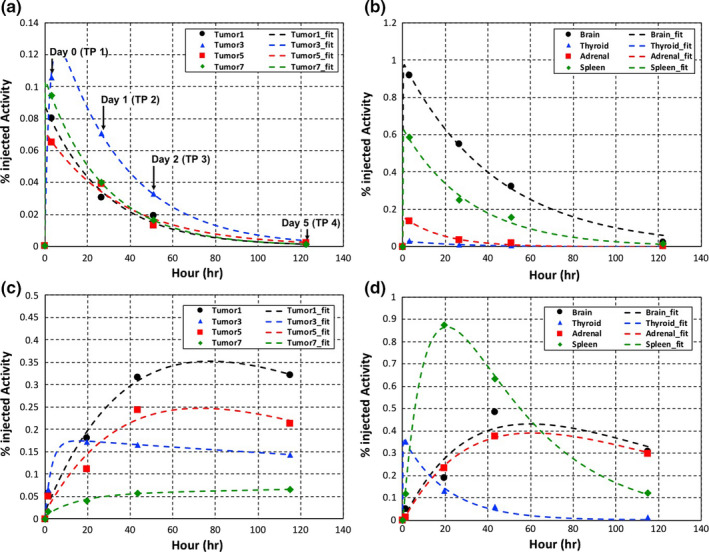
Time–activity curves and biexponential fits for tumors (a, c) and organs (b, d) from two representative patients (upper and bottom). The bottom patient has time–activity curves with slope+ between two time points for percent of injected activities. [Color figure can be viewed at wileyonlinelibrary.com]
3.C. TIACs vs areas of two‐time point %IA and SUV
There were statistically significant (P < 0.05) and reasonable correlations (|r| > 0.5) between areas of %IAs and TIACs for all time point combinations (Fig. 4). The correlation with TIACs and statistical significance are generally much weaker when SUV areas are used (Fig. 5). Figures 4 and 5 summarize all correlation tests for areas of %IAs and SUVs with TIACs for tumors, respectively.
Figure 4.
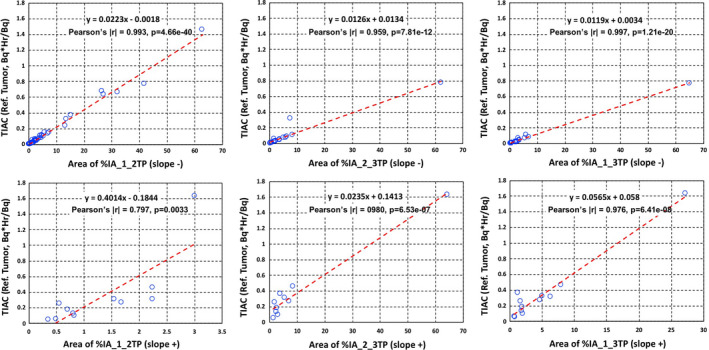
Time‐integrated activity coefficients (Bq·hr/Bq) vs areas of percent of injected activities (%IAs) slope− (upper) and slope+ (bottom) in tumors with: %IA areas between time point 1 and time point 2 (left column), %IA areas between time point 2 and time point 3 (middle column), and (c) %IA areas between time point 1 and time point 3 (right column). Both the linear equation from least squares fits and the Pearson's coefficient values are shown on each plot. [Color figure can be viewed at wileyonlinelibrary.com]
Figure 5.
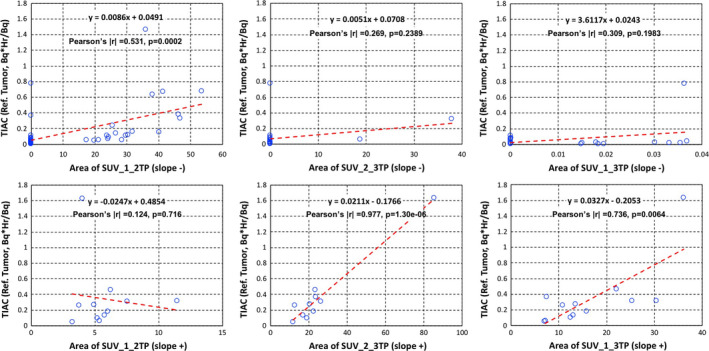
Time‐integrated activity coefficients (Bq·hr/Bq) vs areas of standardized uptake values (SUVs) slope− (upper) and slope+ (bottom) in tumors with: SUV areas between time point 1 and time point 2 (left column), SUV areas between time point 2 and time point 3 (middle column), and (c) SUV areas between time point 1 and time point 3 (right column). Both the linear equation from least squares fits and the Pearson's coefficient values are shown on each plot. [Color figure can be viewed at wileyonlinelibrary.com]
In addition, Figs. 6 and 7 show all correlation tests for slopes of %IAs and SUVs with TIACs for organs including the excretion. There were reasonable correlations between all areas of %IAs and TIACs, but not so much for SUVs.
Figure 6.
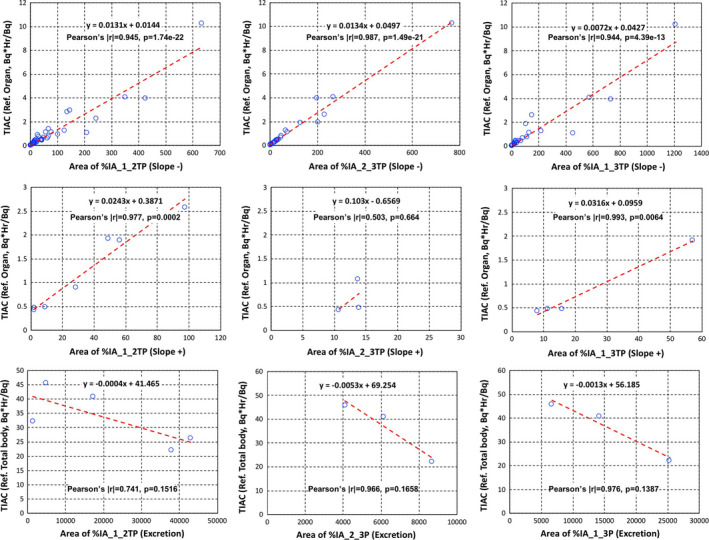
Time‐integrated activity coefficients (Bq·hr/Bq) vs areas of percent of injected activities (%IAs) slope− (upper), slope+ (middle) for organs, and slope+ of excretion (bottom). %IA areas between time point 1 and time point 2 (left column), %IA areas between time point 2 and time point 3 (middle column), and %IA areas between time point 1 and time point 3 (right column). Both the linear equation from least squares fits and the Pearson's coefficient values are shown on each plot. [Color figure can be viewed at wileyonlinelibrary.com]
Figure 7.
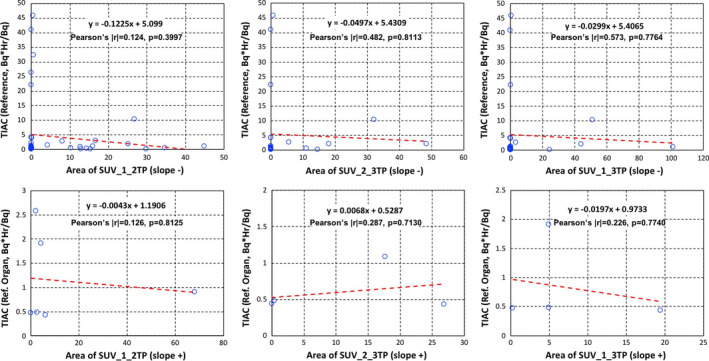
Time‐integrated activity coefficients (Bq·hr/Bq) vs areas of standardized uptake values (SUVs) slope− (upper), slope+ (middle) for organs. SUV areas between time point 1 and time point 2 (left column), SUV areas between time point 2 and time point 3 (middle column), and SUV areas between time point 1 and time point 3 (right column). Both the linear equation from least squares fits and the Pearson's coefficient values are shown on each plot. [Color figure can be viewed at wileyonlinelibrary.com]
The statistical test results for TIAC are also summarized in Table 1. Our results indicate that areas of all cases of %IAs derived from the two‐time points are acceptable for calculating doses of tumors and organs.
Table 1.
Summary of Pearson's correlation tests for time‐integrated activity coefficients. * denotes statistically significant correlation. ** denotes slope+ of excretion
| Tumors | Organs | |||
|---|---|---|---|---|
| Pearson's |r| | P‐value | Pearson's |r| | P‐value | |
| %IA_1_2TP | ||||
| Slope− | 0.993* | 4.66E‐40* | 0.945* | 1.74E‐22* |
| Slope+ | 0.797* | 0.0033* | 0.977* | 0.0002* |
| **Slope+ | 0.941* | 0.1516 | ||
| %IA_2_3TP | ||||
| Slope− | 0.959* | 7.82E‐12* | 0.987* | 1.49E‐21* |
| Slope+ | 0.980* | 6.53E‐07* | 0.503* | 0.664 |
| **Slope+ | 0.966* | 0.1658 | ||
| %IA_1_3TP | ||||
| Slope− | 0.997* | 1.21E‐20* | 0.944* | 4.39E‐13* |
| Slope+ | 0.976* | 6.41E‐08* | 0.993* | 0.0064* |
| **Slope+ | 0.976* | 0.1387 | ||
| SUV_1_2TP | ||||
| Slope− | 0.531* | 0.0002* | 0.124 | 0.3997 |
| Slope+ | 0.124 | 0.716 | 0.126 | 0.8125 |
| SUV_2_3TP | ||||
| Slope− | 0.269 | 0.2389 | 0.482 | 0.8113 |
| Slope+ | 0.977* | 1.30E‐06* | 0.287 | 0.7130 |
| SUV_1_3TP | ||||
| Slope− | 0.309 | 0.1983 | 0.573* | 0.7764 |
| Slope+ | 0.736* | 0.0064* | 0.226 | 0.7740 |
3.D. Reference dose vs two‐time point calculated dose
Figure 8 shows that difference in calculated doses between reference tumor doses using the 3 or 4 time points and tumor doses calculated using the two‐time points as described above as Bland–Altman plots. The blue horizontal lines are drawn at the mean difference and the red horizontal dotted lines are at the limits of agreement. The limits of agreement are defined as the mean difference ± 1.96 standard deviation of differences in a 95% prediction interval. Although the differences (or statistical errors) show increasing trend as a function of the dose value, the difference mean values of tumor doses were close to zero under 100 Gy (bottom plots in Fig. 8). Although some results were located outside of the lower or upper limits of agreement (Fig. 8), but there was no statistically significant difference (i.e., P > 0.05) between dose averages of the two‐time point methods and of the reference method, which could be considered acceptable for accuracy testing (Fig. 9).
Figure 8.
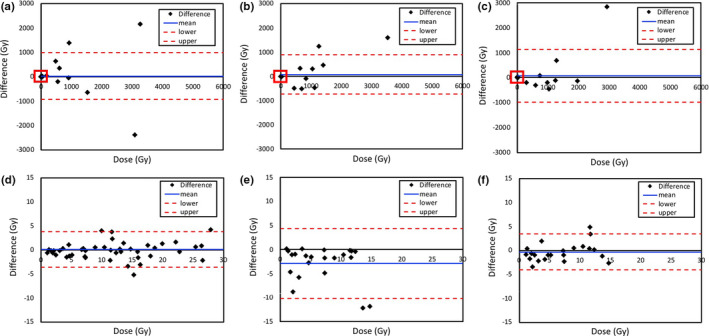
Difference in calculated doses between reference tumor doses using the 3 or 4 time points and tumor doses calculated using the two‐time points with percent of injected activities (%IAs) 1_2TP (a, d), %IAs 2_3TP (b, e), and %IAs 1_3TP (c, f). The enlarged portions of plots (d, e, f) from the red box in the upper plots (a, b, c) show the difference in calculated doses under 100 Gy. [Color figure can be viewed at wileyonlinelibrary.com]
Figure 9.
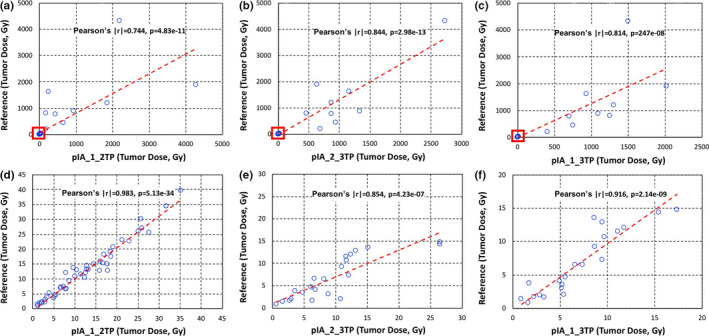
Reference tumor dose (Gy) vs tumor doses calculated using the two‐time points (Gy) with percent of injected activities areas between time point 1 and time point 2 (a, d), time point 2 and time point 3 (b, e), and time point 1 and time point 3 (c, f). The enlarged portions of plots (d, e, f) from the red box in the upper plots (a, b, c) show the difference in calculated doses under 100 Gy. [Color figure can be viewed at wileyonlinelibrary.com]
In addition, we show difference in calculated doses for each normal organ using the reference method calculated from 3 or 4 time points data and the two‐time point methods (Fig. 10) as Bland–Altman plots. The difference mean values of tumor doses were close to zero within all dose ranges. There was no statistically significant difference (i.e., P > 0.05) between dose averages of two‐time point methods and of the reference method, which could be considered acceptable for accuracy testing (Fig. 11).
Figure 10.

Difference in calculated doses between reference organ doses using the 3 or 4 time points and organ doses calculated using the two‐time points with percent of injected activities (%IAs) 1_2TP (left), %IAs 2_3TP (middle) and %IAs 1_3TP (right). [Color figure can be viewed at wileyonlinelibrary.com]
Figure 11.

Reference organ doses (Gy) vs organ doses calculated using the two‐time points (Gy) with percent of injected activity areas between time point 1 and time point 2 (left), time point 2 and time point 3 (middle), and time point 1 and time point 3 (right). [Color figure can be viewed at wileyonlinelibrary.com]
The Pearson's correlation test results and % differences for individual absorbed dose calculations in tumors (all dose ranges) and organs are also shown in Table 2. There was no statistically significant difference (i.e., P > 0.05) between absorbed doses of the reference method and of the two‐time point methods, which could be considered acceptable. The lowest % differences when all individual tumors and organs were considered were 21.4% and 23.3%, respectively, when the two‐time point data are taken from time point 1 and time point 2.
Table 2.
Results of Pearson's correlation test and % differences for individual absorbed doses in tumors and organs. * denotes statistically significant correlation. ** denotes the lowest % differences when all individual tumors and organs were considered
| Tumor | Organ | |||||
|---|---|---|---|---|---|---|
| Pearson's |r| | P‐value | % difference | Pearson's |r| | P‐value | % difference | |
| %IA_1_2TP | 0.774* | 4.83E‐11* | 21.4** | 0.879* | 5.56E‐19* | 23.3** |
| %IA_2_3TP | 0.919* | 2.98E‐13* | 69.1 | 0.929* | 6.19E‐15* | 36.6 |
| %IA_1_3TP | 0.814* | 2.46E‐08* | 40.4 | 0.814* | 2.46E‐08* | 40.0 |
4. Discussion
In the analysis presented in this report, what would be the most desirable next step is to correlate the absorbed dose in tumors with the response to the therapy. That analysis will be our future plan since some of these patients are still being considered for additional 131I‐MIBG therapy. Also, a larger number of cases will provide statistically more meaningful data than what we could show in this report.
Ultimately, it is most desirable to use one‐time point pretherapy imaging session for RPT as for pretherapy organ and tumor dosimetry, which may be possible if we can analyze a large set of data and find a way to accurately predict the kinetics of tumor uptake of the radiopharmaceutical. Some previous studies investigating the possibility of using one or reduced time point data for accurate dosimetry exist in the literature. Jentzen et al. showed that the one‐time point 124I‐NaI PET imaging data acquired at 24 h, preferably with additional data acquired approximately at 96 h, can provide < 16% accuracy of average percent difference from lesion doses calculated using the 5‐time point data for 131I‐NaI therapy.16 This result is indeed similar to our method with similar assumptions that simple kinetics of lesion uptake like linear slope can be predictive of TIACs. Madsen et al.17 and Hänscheid et al.14 both showed that single time point data can be used for estimating doses in lesions with population average data or late time point data sampling for 90Y‐DOTATOC therapy and 177Lu‐DOTATATE/DOTATOC therapy, respectively. These developments are encouraging and the simplest approach in terms of requirement of multiple scans. However, for therapy like 131I‐MIBG in refractory neuroblastoma, population data are very challenging to acquire considering the low number of cases treated, and later time point data after administration of therapeutic doses are not compatible with pretherapy dosimetry goal of our need in planning 131I‐MIBG therapy. Nonetheless, it is our plan to pursue the single time point idea once we accumulate more datasets. A limitation about this approach is that a method using only one imaging time point could be either radiopharmaceutical dependent or patient specific.
In combination with simpler and more practical pretherapy organ and tumor dosimetry method, it is also important to develop a reproducible and quantitative imaging method that is applicable for both SPECT and PET imaging. For RPT, the quantitative accuracy of SPECT imaging will become very important since the majority of therapeutic radionuclides emit some form of gamma radiation that can be imaged by SPECT modality. With CT, SPECT/CT is an essential modality for this purpose with CT data providing accurate physical corrections that allow quantitative SPECT imaging.18, 19
5. Conclusion
In this report, we could achieve reasonable accuracy of estimating tumor doses for subsequent radiopharmaceutical therapy using only the two‐time point imaging sessions. These two time points (within the 48‐h after administration of radiopharmaceutical) are also practical for the images to be used for diagnostic reading. Although our analysis was specific to 124I‐MIBG PET/CT pretherapy imaging data for 131I‐MIBG therapy of neuroblastoma and the number of imaging datasets was not large, this feasible methodology would generally be applicable to other imaging and therapeutic radionuclides with an appropriate data analysis similar to our analysis.
Conflict of Interest
The authors have no conflict to disclose.
Acknowledgments
The authors thank the clinical staff who performed imaging and therapy of 124I‐MIBG and 131I‐MIBG. This work was supported in part by the National Cancer Institute under grant R01 CA154561, and the National Institute of Biomedical Imaging and Bioengineering under grant R01 EB026331.
References
- 1. Matthay KK, Panina C, Huberty J, et al. Correlation of tumor and whole‐body dosimetry with tumor response and toxicity in refractory neuroblastoma treated with (131)I‐MIBG. J Nucl Med. 2001;42:1713–1721. [PubMed] [Google Scholar]
- 2. Huang SY, Bolch WE, Lee C, et al. Patient‐specific dosimetry using pretherapy [(1)(2)(4)I]m‐iodobenzylguanidine ([(1)(2)(4)I]mIBG) dynamic PET/CT imaging before [(1)(3)(1)I]mIBG targeted radionuclide therapy for neuroblastoma. Mol Imaging Biol. 2015;17:284–294. [DOI] [PMC free article] [PubMed] [Google Scholar]
- 3. Seo Y, Gustafson WC, Dannoon SF, et al. Tumor dosimetry using [124I]m‐iodobenzylguanidine microPET/CT for [131I]m‐iodobenzylguanidine treatment of neuroblastoma in a murine xenograft model. Mol Imaging Biol. 2012;14:735–742. [DOI] [PMC free article] [PubMed] [Google Scholar]
- 4. Sgouros G, Kolbert KS, Sheikh A, et al. Patient‐specific dosimetry for 131I thyroid cancer therapy using 124I PET and 3‐dimensional‐internal dosimetry (3D‐ID) software. J Nucl Med. 2004;45:1366–1372. [PubMed] [Google Scholar]
- 5. Sgouros G, Squeri S, Ballangrud AM, et al. Patient‐specific, 3‐dimensional dosimetry in non‐Hodgkin's lymphoma patients treated with 131I‐anti‐B1 antibody: assessment of tumor dose‐response. J Nucl Med. 2003;44:260–268. [PubMed] [Google Scholar]
- 6. Makris NE, van Velden FH, Huisman MC, Menke CW, Lammertsma AA, Boellaard R. Validation of simplified dosimetry approaches in (8)(9)Zr‐PET/CT: the use of manual versus semi‐automatic delineation methods to estimate organ absorbed doses. Med Phys. 2014;41:102503. [DOI] [PubMed] [Google Scholar]
- 7. Menda Y, Madsen MT, O'Dorisio TM, et al. (90)Y‐DOTATOC Dosimetry‐Based Personalized Peptide Receptor Radionuclide Therapy. J Nucl Med. 2018;59:1692–1698. 10.2967/jnumed.117.202903 [DOI] [PMC free article] [PubMed] [Google Scholar]
- 8. Ljungberg M, Sjogreen Gleisner K. Personalized dosimetry for radionuclide therapy using molecular imaging tools. Biomedicines. 2016;4(4):E25. [DOI] [PMC free article] [PubMed] [Google Scholar]
- 9. Celler A, Grimes J, Shcherbinin S, Piwowarska‐Bilska H, Birkenfeld B. Personalized image‐based radiation dosimetry for routine clinical use in peptide receptor radionuclide therapy: pretherapy experience. Recent Results Cancer Res. 2013;194:497–517. [DOI] [PubMed] [Google Scholar]
- 10. Pauwels S, Barone R, Walrand S, et al. Practical dosimetry of peptide receptor radionuclide therapy with (90)Y‐labeled somatostatin analogs. J Nucl Med. 2005;46:92S–98S. [PubMed] [Google Scholar]
- 11. Garin E, Lenoir L, Rolland Y, et al. Dosimetry based on 99mTc‐macroaggregated albumin SPECT/CT accurately predicts tumor response and survival in hepatocellular carcinoma patients treated with 90Y‐loaded glass microspheres: preliminary results. J Nucl Med. 2012;53:255–263. [DOI] [PubMed] [Google Scholar]
- 12. Lam MG, Goris ML, Iagaru AH, Mittra ES, Louie JD, Sze DY. Prognostic utility of 90Y radioembolization dosimetry based on fusion 99mTc‐macroaggregated albumin‐99mTc‐sulfur colloid SPECT. J Nucl Med. 2013;54:2055–2061. [DOI] [PubMed] [Google Scholar]
- 13. Murray I, Chittenden SJ, Denis‐Bacelar AM, et al. The potential of (223)Ra and (18)F‐fluoride imaging to predict bone lesion response to treatment with (223)Ra‐dichloride in castration‐resistant prostate cancer. Eur J Nucl Med Mol Imaging. 2017;44:1832–1844. [DOI] [PMC free article] [PubMed] [Google Scholar]
- 14. Hanscheid H, Lapa C, Buck AK, Lassmann M, Werner RA. Dose mapping after endoradiotherapy with (177)Lu‐DOTATATE/DOTATOC by a single measurement after 4 days. J Nucl Med. 2018;59:75–81. [DOI] [PubMed] [Google Scholar]
- 15. Emami B, Lyman J, Brown A, et al. Tolerance of normal tissue to therapeutic irradiation. Int J Radiat Oncol Biol Phys. 1991;21:109–122. [DOI] [PubMed] [Google Scholar]
- 16. Jentzen W, Freudenberg L, Eising EG, Sonnenschein W, Knust J, Bockisch A. Optimized 124I PET dosimetry protocol for radioiodine therapy of differentiated thyroid cancer. J Nucl Med. 2008;49:1017–1023. [DOI] [PubMed] [Google Scholar]
- 17. Madsen MT, Menda Y, O'Dorisio TM, O'Dorisio MS. Technical note: single time point dose estimate for exponential clearance. Med Phys. 2018;45:2318–2324. [DOI] [PMC free article] [PubMed] [Google Scholar]
- 18. Seo Y, Mari C, Hasegawa BH. Technological development and advances in single‐photon emission computed tomography/computed tomography. Semin Nucl Med. 2008;38:177–198. [DOI] [PMC free article] [PubMed] [Google Scholar]
- 19. Seo Y, Wong KH, Sun M, Franc BL, Hawkins RA, Hasegawa BH. Correction of photon attenuation and collimator response for a body‐contouring SPECT/CT imaging system. J Nucl Med. 2005;46:868–877. [PubMed] [Google Scholar]


