Abstract
Rationale and Objectives:
To evaluate whether a CT-based computerized decision-support system for muscle-invasive bladder cancer treatment response assessment (CDSS-T) can improve identification of patients who have responded completely to neoadjuvant chemotherapy.
Materials and Methods:
Following IRB approval, pre- and post-chemotherapy CT scans of 123 subjects with 157 muscle-invasive bladder cancer foci were collected retrospectively. CT data were analyzed with a CDSS-T that uses a combination of deep-learning convolutional neural network and radiomic features to distinguish muscle-invasive bladder cancers that have fully responded to neoadjuvant treatment from those that have not. Leave-one-case-out crossvalidation was used to minimize overfitting. Five attending abdominal radiologists, four diagnostic radiology residents, two attending oncologists, and one attending urologist estimated the likelihood of pathologic T0 disease (complete response) by viewing paired pre/post-treatment CT scans placed side-by-side on an internally-developed graphical user interface. The observers provided an estimate without use of CDSS-T and then were permitted to revise their estimate after a CDSS-T-derived likelihood score was displayed. Observer estimates were analyzed with multi-reader, multi-case receiver operating characteristic methodology. The area under the curve (AUC) and the statistical significance of the difference were estimated.
Results:
The mean AUCs for assessment of pathologic T0 disease were 0.80 for CDSS-T alone, 0.74 for physicians not using CDSS-T, and 0.77 for physicians using CDSS-T. The increase in the physicians’ performance was statistically significant (p < 0.05).
Conclusions:
CDSS-T improves physician performance for identifying complete response of muscle-invasive bladder cancer to neoadjuvant chemotherapy.
Keywords: Bladder Cancer, Treatment Response Assessment, Radiomics, Observer Performance Study, Decision support Systems
Introduction
The American Cancer Society estimates that 81,190 (62,380 male, 18,810 female) new cases of bladder cancer will be diagnosed in 2018, resulting in approximately 17,240 deaths (12,520 male, 4,720 female)(1). About 50% of bladder cancers are diagnosed while the cancer involves only the inner mucosal layer of the bladder wall (Stage T1 or less), and approximately 30% are muscle-invasive but remain confined to the bladder (Stage T2). In the remaining 20% of cases, cancers have spread outside the bladder wall (Stage T3 or T4) or become metastatic (1).
Neoadjuvant chemotherapy performed prior to radical cystectomy has been shown to improve patient survival and decrease the probability of metastatic disease when compared to radical cystectomy alone (2-4). However, significant toxicities are associated with neoadjuvant chemotherapy, including neutropenic fever, sepsis, mucositis, nausea, vomiting, malaise, and alopecia (5). Currently, there is no reliable method for assessing complete response to neoadjuvant chemotherapy. As a result, some patients may suffer adverse reactions to treatment with chemotherapy while gaining minimal benefit. If an effective method of assessment is identified, it could be explored as a way to personalize therapy to patients in the neoadjuvant chemotherapy setting. In addition, it might facilitate a reliable, non-invasive method for selecting patients for bladder-sparing therapy (6), in which trimodal therapy (i.e., transurethral resection, chemotherapy, radiation) can be used as a curative option for patients who do not wish to undergo the morbidity of radical cystectomy.
We have developed a CT-based computerized decision-support system for muscleinvasive bladder cancer treatment response assessment (CDSS-T) that uses deep-learning convolutional neural networks (DL-CNN) and radiomics to estimate the likelihood that a patient has completely responded to neoadjuvant chemotherapy (7). In this study, we explored whether CDSS-T can improve identification of patients who have responded completely to neoadjuvant chemotherapy.
Materials and Methods
Data Set
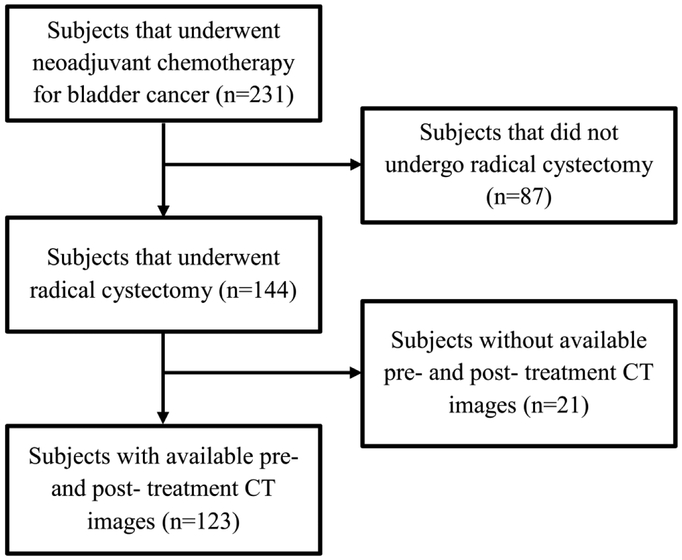
Institutional Review Board (IRB) approval was obtained and patient informed consent was waived for this HIPAA compliant retrospective cohort study. The study population was composed of subjects with muscle-invasive bladder cancer who had undergone CT scanning of the pelvis before and after neoadjuvant chemotherapy treatment with MVAC (methotrexate, vinblastine, doxorubicin, cisplatin) or an alternative regimen (variably including carboplatin, paclitaxel, gemcitabine, etoposide), all prior to radical cystectomy (N=231). Potential subjects were initially identified by querying the institutional radiology information system (RIS) for radiology reports with the term “bladder cancer and chemotherapy”. Subjects who did not undergo radical cystectomy were excluded (N=87). Subjects that did not have pre- or posttreatment CT scans were also excluded (N=21). The final study population was composed of 123 subjects with 157 foci of muscle-invasive bladder cancer (100 males [mean age: 63 years, range: 43-84 years and 23 females [mean age: 63 years, range: 37-82 years]). The study population flow diagram is shown in Figure 1.
Figure 1.
Study population flowchart
CT scans of the pelvis with or without contrast material were acquired on GE Healthcare Lightspeed MDCT scanners, using 120 kVp and 120-280 mA, with a pixel size range of 0.586-0.977 mm and a slice interval range of 0.625-7mm. Pre-treatment CT scans were acquired at a median time of 1 month (and never more than 3 months) before the first cycle of chemotherapy. Post-treatment imaging was acquired after completion of three cycles of chemotherapy at a median of 1 month following cessation of the therapy. The pre- and post-treatment scans were acquired an average of 4 months apart. Radical cystectomy was performed 1-2 months after completion of neoadjuvant chemotherapy.
Pathology obtained from the bladder at the time of surgery was used as the reference standard to determine the final cancer stage and whether the subject had responded completely to neoadjuvant chemotherapy (i.e., pathologic T0; the primary outcome measure). All cancer foci were annotated for the CDSS-T on the pre- and post-chemotherapy CT scans by a radiologist (R.H.C) with 32 years of experience reading abdominal CT and who did not participate as an observer in the treatment response assessment experiment. This reference radiologist defined a volume of interest (VOI) with a bounding box using a custom graphical user interface (GUI; MiViewer, developed at the University of Michigan CAD Research Laboratory).
The reference radiologist subjectively scored lesion subtlety on a 5-point scale, with a score of 1 indicating that the cancer was easily identified and a score of 5 indicating that the cancer was extremely difficult to identify.
The reference radiologist (R.H.C) then provided a subjective rating of complexity of treatment assessment for a lesion pair, taking into consideration factors such as presence of dystrophic calcification that may mask adjacent residual tumor, the ability to differentiate the bladder mass from volume averaging with adjacent structures, the use of intravenous contrast material, and the presence of a ureteral stent that may cause adjacent reactive bladder wall thickening. This assessment was performed to determine the degree of confidence that the reviewer had that the visualized abnormality on the post-treatment CT either represented residual tumor or no residual tumor. Complexity of the abnormalities were classified using a 5-point scale, with a score of 1 indicating that the treatment response of the abnormality was easy to determine and a score of 5 indicating extreme difficulty in determining treatment response.
Computerized decision support system for treatment response assessment (CDSS-T)
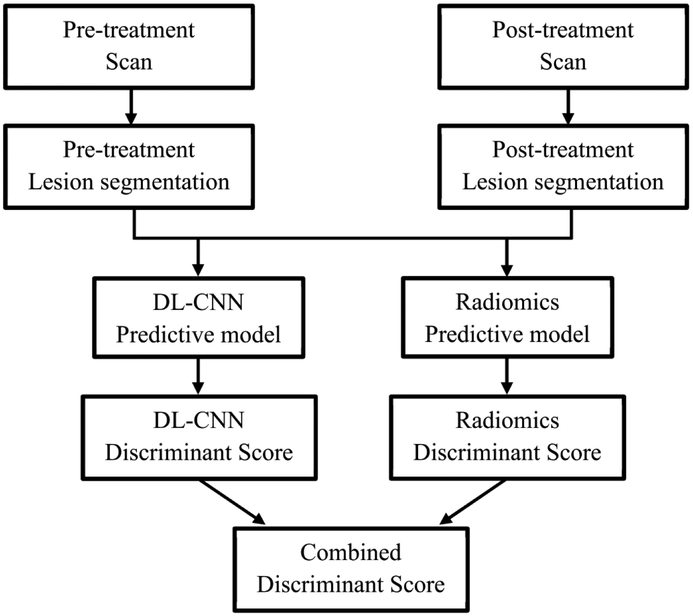
The bladder cancers were segmented using auto-initialized cascaded level set (AI-CALS) (8). Our CDSS-T system uses a combination of DL-CNN and radiomic features to distinguish between muscle-invasive bladder cancers that have fully responded to treatment (i.e., pathologic T0) and those that have not (i.e., pathologic T1-4) (7). The image analysis pipeline of the CDSS-T system is shown in Figure 2.
Figure 2:
Flowchart of the CDSS-T system.
DL-CNN assessment model
Regions of interest (ROIs) of 32 × 16 pixels were extracted from within the segmented tumors from the pre- and post-treatment scans. The extracted ROIs were grouped in multiple combinations to generate pre-post-treatment paired ROIs. A single “hybrid” ROI of 32 × 32 pixels was formed from each pair with the pre- and post-treatment ROIs digitally pasted side-byside. Multiple hybrid ROIs were generated from the same cancer by taking different combinations of the pre- and post-treatment ROIs (9). All hybrid ROIs from the same cancer were labeled as a complete responder (i.e., pathologic T0) or a non-complete-responder (i.e., pathologic T1-4), based on the post-cystectomy pathologic specimen of the cancer (7).
We trained a deep learning convolutional neural network (DL-CNN) to distinguish complete responders from non-complete-responders (7). For training and testing of the assessment model, a leave-one-case-out cross-validation scheme was used. For each leave-one-case-out partition, the DL-CNN was trained with all hybrid ROIs except for those from the left-out case. The trained DL-CNN was then applied to the hybrid ROIs of the left-out test case and outputted a likelihood score of pathologic T0 disease for each of the test ROIs. The “per-cancer” score was obtained by using the average value among the ROIs associate with a cancer.
Radiomics assessment model
For this assessment model, a radiomics-feature-based analysis was applied to the segmented cancers. We extracted 91 features for every segmented lesion. These features previously were shown to be useful in analyzing breast masses and lung nodules (9, 10), as well as for bladder cancer treatment response assessment (7). Additional details on the radiomics features can be found elsewhere (7, 9, 10). For every temporal CT pair (i.e., pre-post) of a given bladder cancer focus, the percent difference of each radiomics feature between the pre- and post-treatment foci was calculated. A two-loop leave-one-case-out cross-validation scheme (11) was used to build this assessment model as feature selection was involved, with the inner loop selecting the subset of features and training the classifier weights using a leave-one-case-out scheme within the training partition and the outer loop applying the trained classifier to the left-out test case such that the test case is kept completely independent of the training process. An average of four features was selected, including two run-length statistics features and two contrast features.
CAD Score generation
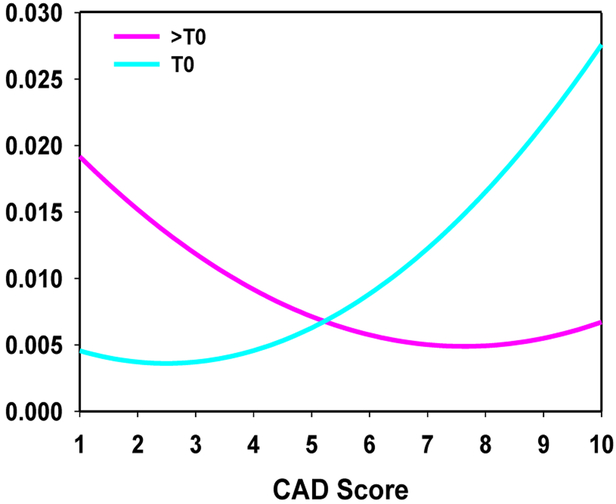
A combined score using the test scores from both the DL-CNN and the radiomics assessment model was generated by taking the maximum of the two scores. Receiver operating characteristic (ROC) analysis was performed on the combined scores. A computer-aided diagnosis (CAD) score was obtained by linearly scaling the combined score within the interval between 1 and 10, rounding to the nearest whole integer. A score of 1 corresponded to the lowest likelihood that the lesion pair was indicative of complete response, and a score of 10 corresponded to the highest likelihood that the lesion pair was indicative of complete response. This CAD score on a relative 1 to 10 scale was not used for classifier accuracy evaluation by the ROC analysis, but rather to facilitate communication of the CDSS-T estimated likelihood to the physicians. A curve fitting was applied to the linearly-transformed distributions of the non-complete-responders and the complete responders to obtain fitted curves for both categories. The area under both of the distribution curves was then normalized to a value of one. The distribution of fitted scores [Figure 3] was displayed as a reference whenever a cancer-specific CDSS-T likelihood score was presented to the observer.
Figure 3:
Fitted normalized distribution of likelihood scores generated by the combined DL-CNN and radiomics assessment model.
Observer performance study
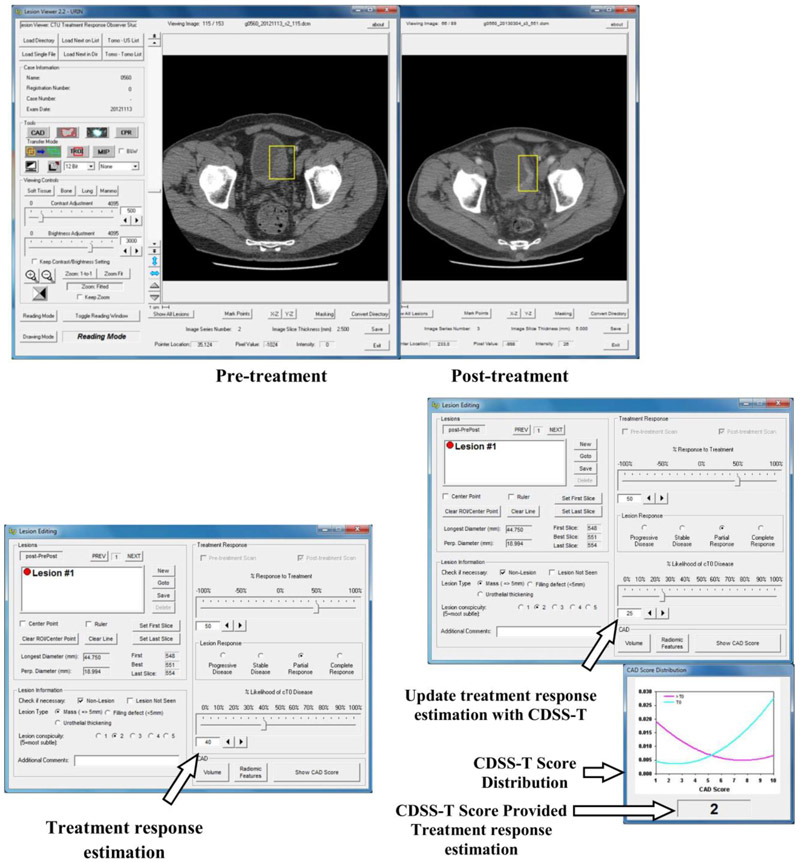
Five abdominal-fellowship-trained radiology attending physicians (faculty experience: 2-36 years), one second-year radiology resident, three fourth-year radiology residents, one urologist attending physician (faculty experience: 11 years), and two oncologist attending physicians (faculty experience: 3 and 10 years) estimated the likelihood of complete response by viewing each pre-post-treatment CT pair displayed side-by-side on a specialized GUI that allows common interactive functions such as windowing, scrolling, and zooming [Figure 4]. The observers were instructed to inspect each previously-placed VOI on the pre- and post-treatment scans. In cases containing multiple cancer foci and therefore multiple VOIs, each VOI was analyzed separately [Figure 4a]. Each observer was blinded to the reference standard and to the results of the other observers, and was given unlimited time for evaluation. The cases were randomized differently for each observer to minimize bias related to fatigue or learning due to reading order.
Figure 4:
Graphical user interface for reading with and without the computer-aided diagnosis (CAD) system designed for supporting treatment response assessment (CDSS-T). (a) The pre- and post-treatment scans are shown side-by-side, and (b) the observer estimates the treatment response, recording the estimate in the interface indicated by the arrow. (c) The observer is shown the CDSS-T score and the score distribution of the two classes is displayed for reference, as indicated by the middle arrow and bottom arrow, respectively. The observer may revise their treatment response assessment after considering the CDSS-T score using the interface pointed to by the top arrow.
For each cancer focus, each observer provided an estimate of its likelihood of complete response on a scale of 0% to 100%, where 0% indicated definite residual viable neoplasm (> T0 disease) and 100% indicated complete response (T0 disease) [Figure 4b]. Reader estimates were provided first without and then with access to the CAD likelihood score [Figure 4c]. In this way, the observers were given the opportunity to alter their original estimate after being provided the CAD score, though they could leave it unchanged if they wished.
Each observer then was asked to estimate percentage response of tumor to the neoadjuvant chemotherapy on a scale of −100% to +100% using RECIST 1.1 (12) measurements criteria, where 0% indicated no change between pre- and post-treatment CT scans, −100% indicated at least doubling of tumor size, and 100% indicated a complete response. The observers also gave Response Evaluation Criteria in Solid Tumors (RECIST) ratings, consisting of “progressive disease”, “ complete response”.
Statistical Analysis
The observers’ estimates were analyzed with multi-reader, multi-case (MRMC) receiver operating characteristic (ROC) methodology using the radical cystectomy specimen as the reference standard (13). The area under the curve (AUC) and the statistical significance of the difference in readings with and without CDSS-T were calculated. The primary outcome was a comparison of the diagnostic accuracy of the physicians in diagnosing T0 disease after treatment without CDSS-T, and after the physicians had access to CDSS-T.
In addition to ROC analyses, dichotomous determinations of treatment response assessment accuracy were calculated. For the CDSS-T, the fitted score range 1-4 was considered to indicate no complete response and the fitted score range 6-10 was considered to indicate complete response. For observers, the percent likelihood range 0-49% was considered to indicate no complete response and the percent likelihood range 51-100% was considered to indicate complete response. The CDSS-T score of 5 and the observer percent likelihood of 50% represented equipoise in the assessment of complete response and were not analyzed.
The average standard deviation of the likelihood estimates by the observers per treatment pair was analyzed to study the effects of CDSS-T on inter-observer variability. The difficulty of a cancer was estimated by the standard deviation of the observers’ likelihood estimates. In this analysis, it was assumed that inter-observer variability would be smaller for easier cancers. Using a threshold value of 25% on the standard deviation, treatment pairs were categorized into easy (standard deviation value ≤ 25%) or difficult (standard deviation value > 25%) for assessment. The threshold was chosen by approximately balancing the number of T0 treatment pairs in the easy and the difficult groups, in order to perform a reliable ROC analysis.
The average standard deviations of the likelihood estimates by the observers per treatment pair with and without CDSS-T were compared with a two-tailed Wilcoxon signed-rank test for each subset and the entire set. Pearson’s correlation was used to relate the subjective difficulty in assessing treatment response assigned by the reference radiologist to the level of difficulty estimated using the inter-reader average standard deviation and to the subjective assessment of lesion subtlety assigned by the physicians.
For all analyses, a p-value of less than 0.05 was considered to indicate a significant difference. When multiple comparisons were made for a specific analysis, a Holm-Bonferoni correction was applied.
Results
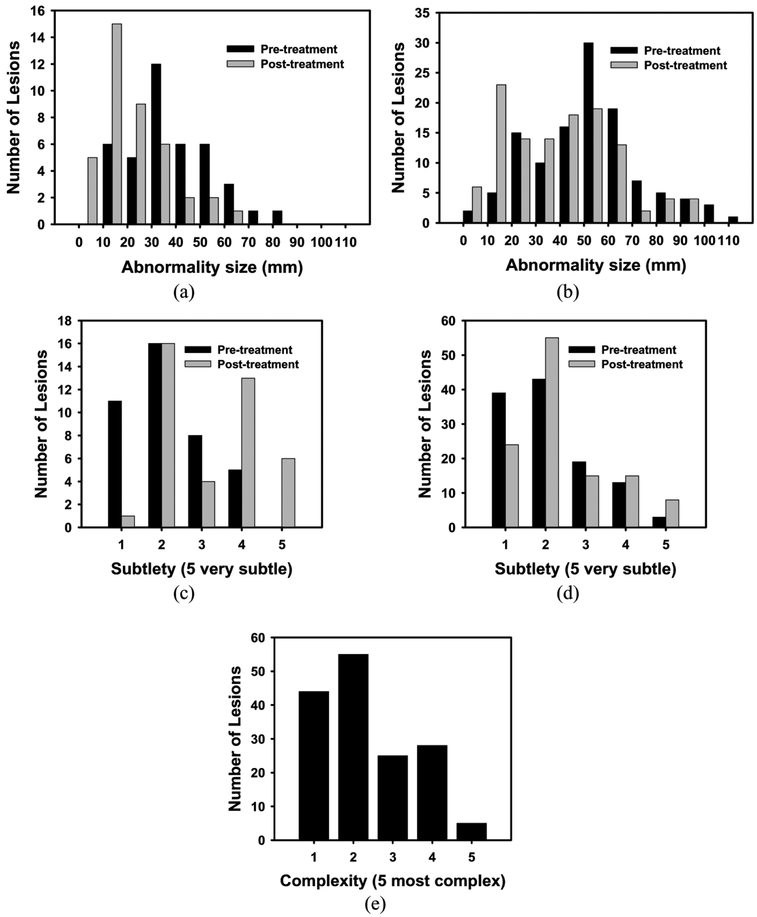
Surgical histology revealed that 25% (40/157) of bladder cancer foci were determined to have a pathologic stage of T0 following neoadjuvant chemotherapy (i.e., 40 complete responders). The average maximum diameter for these 40 completely responding lesions was 30.1 mm on pre-treatment scans and 14.3 mm on post-treatment scans. Suspected lesions on post-treatment scans in these patients were found to represent inflamed bladder wall or entirely necrotic treated tumor. The average maximum diameter for the remaining 117 incompletely responding lesions was 43.0 mm on pre-treatment scans and 31.2 mm on post-treatment scans. Histograms of cancer size [Figure 5(a-b)], cancer subtlety [Figure 5(c-d)], and cancer complexity [Figure 5(e)] are shown graphically in Figure 5.
Figure 5:
Histograms of the pre- and post-treatment lesion for (a, b) size, (c, d) subtlety, and (e) complexity of the treatment pair. (a, c) represent completely responding lesions, while (b, d) represent for non-completely responding lesions (>T0). Note that only a single value is given for the complexity for the treatment pair.
Overall results for all cancers
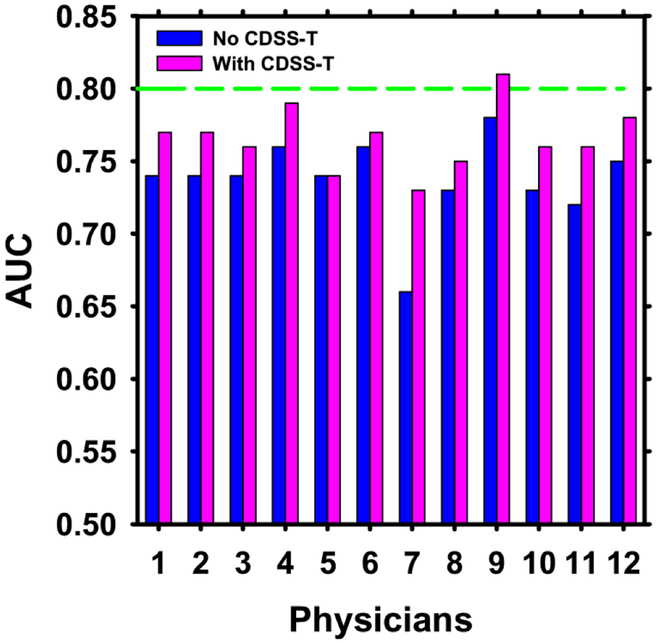
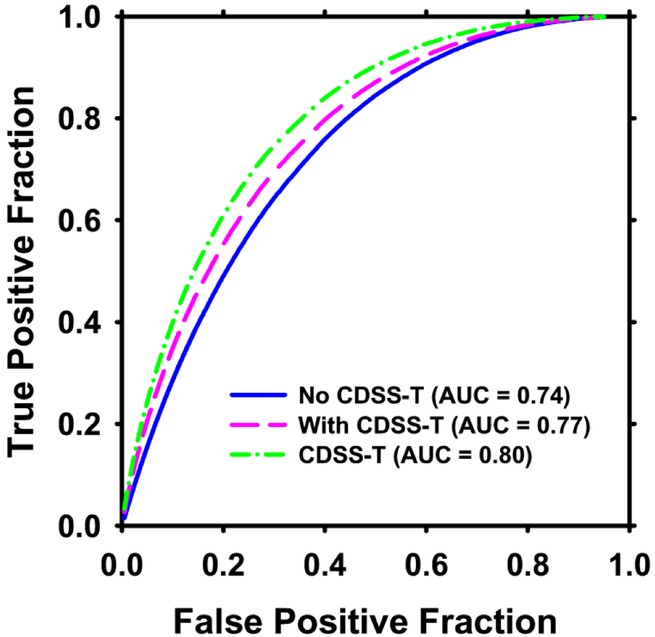
The individual AUC values of the 12 observers are shown in Figure 6, and the overall average ROC curves are shown in Figure 7.
Figure 6:
AUC values for the 12 observers with and without CDSS-T. The standard deviation values for the physicians with and without CDSS-T were 0.04 except for physician 7 without CDSS-T, which was 0.05. The performance of CDSS-T is shown with the dashed line. The performance of all but one (physician 5) of the physicians increased using CDSS-T.
Figure 7:
Average ROC curves for assessment of complete response to neoadjuvant chemotherapy for the 12 observers without and with CDSS-T. The average AUC was 0.74 without CDSS-T and 0.77 with CDSS-T. The solid line is for observers without CDSS-T. The hatched line is for observers with CDSS-T. The dotted-hatched line is for CDSS-T alone.
In general, the physicians’ diagnostic accuracy significantly increased (p = 0.01) and physicians’ diagnostic variability significantly decreased (p < 0.001) with the aid of CDSS-T. The average AUC for all of the physicians combined was 0.74 (range: 0.66-0.78) without CDSS-T, and increased to 0.77 (range: 0.73-0.81) with CDSS-T. This difference was statistically significant (p = 0.01). The average standard deviations of the likelihood estimates given by the physicians were 20.4% without CDSS-T and 17.9% with CDSS-T (p < 0.001). In comparison, the AUC for assessment of complete response by CDSS-T alone was 0.80 ± 0.04.
The radiology faculty performed minimally better on average without CDSS-T (AUC = 0.75) compared to the radiology residents (AUC = 0.74), while the performance of these two groups was the same with CDSS-T (AUC = 0.77). The difference in the performance for the radiology faculty and the radiology residents together, with and without CDSS-T, was statistically significant (p = 0.01). The diagnostic accuracy of the urologist and oncologists (AUC = 0.72) was lower than that of the radiologists, but significantly improved (p = 0.03) with CDSS-T (AUC = 0.76, similar to that of radiologists with CDSS-T). The improvements were also significant after applying a Holm-Bonferoni correction.
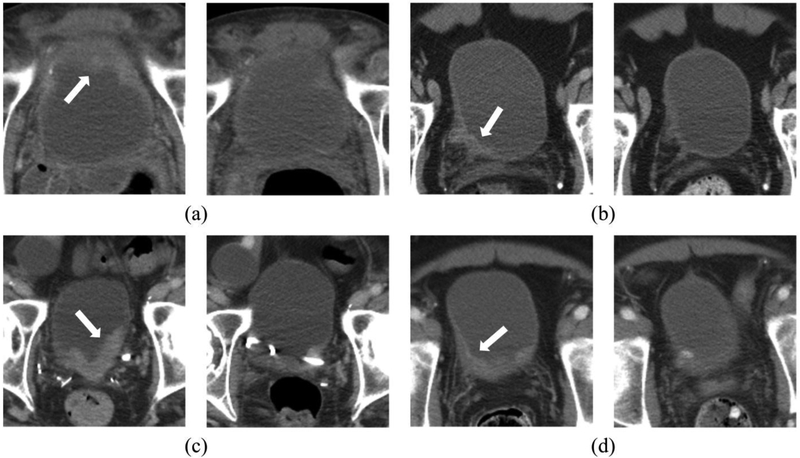
Figure 8 shows examples of pre- and post-treatment bladder cancer pairs. Table 1 shows the average agreements between the CDSS-T and the physicians.
Figure 8:
Examples of pre- and post-treatment bladder cancer pairs. The pre-treatment scan is on the left side and the post-treatment scan is on the right side. The arrow on the pre-treatment scan points to the bladder cancer. (a) The observers and the CAD correctly identified the completely responding tumor. (b) The observers and the CAD both incorrectly identified the completely responding tumor, stating that the cancer did not fully respond. Pathology revealed only therapy-related changes. (c) The observers correctly identified the non-completely responding cancer. The CAD, however, erroneously identified this cancer as having completely responded. This may be due to the presence of a stent, changing the imaging properties of the cancer. The observers were not affected adversely when provided with the CAD results. (d) The CAD correctly identified this completely responding cancer, while the majority of observers erroneously identified this cancer as non-completely responding. After the CAD scores were revealed, the observers modified their scores and then generally agreed with CAD and correctly classified this cancer.
Table 1:
Agreements between the CDSS-T and the physicians for completely responding cancers. The numbers are shown as average (range).
| Physicians Correct CDSS-T Correct |
Physicians Correct CDSS-T Incorrect |
Physicians Incorrect CDSS-T Correct |
Physicians Incorrect CDSS-T Incorrect |
|---|---|---|---|
| 17/40 (12-24) | 2/40 (0-5) | 8/40 (3-13) | 3/40 (0-5) |
Both CDSS-T and the physicians without CDSS-T correctly assessed complete response in an average of 17 (range: 12-24) of 40 completely responding cancers [Figure 8a]. In an average of 3 completely responding cancers (range: 0-5), the CDSS-T and the physicians without CDSS-T incorrectly identified the successfully treated cancers as non-complete-responders [Figure 8b].
The CDSS-T incorrectly assessed incomplete response while the physicians correctly assessed complete response for an average of 2 (range: 0-5) of 40 completely responding cancers [Figure 8c]. For an average of 8 (range: 3-13) of 40 complete responders, the physicians incorrectly assessed incomplete response while the CDSS-T correctly assessed complete response.
There was an average of 21 cancers (range: 17-30) in which a physician correctly classified response but the CDSS-T did not. There was an average of 20 cancers (range: 12-28) in which the CDSS-T correctly classified response but the physicians did not. Overall, when presented with an incorrect CDSS-T likelihood score, the physicians usually (mean: 25, range: 16-34) did not change their likelihood score in the incorrect direction; when presented with a correct CDSS-T likelihood score, the physicians usually (mean: 20, range: 6-41) modified their likelihood score in the correct direction.
Easy vs. Difficult Cancers
There were 92 treatment pairs (17% [16/92] completely responding) categorized as easy to assess (40% [16/40] of the complete responders, 65% [76/117] of the non-complete responders) and 65 treatment pairs (37% [24/65] completely responding) categorized as difficult to assess (60% [24/40] of the complete responders, 35% [41/117] of the non-complete responders).
The subjective difficulty in assessing treatment response assigned by the reference radiologist was moderately correlated (r=0.59) with the objective difficulty calculated by inter-reader standard deviation, but had very low correlation with observer scores of lesion subtlety (r=0.14 [pre-treatment], r=0.28 [post-treatment]).
The AUCs for CDSS-T alone and the physicians with and without CDSS-T are shown for the easy and difficult cancers in Table 2. The variability in average physician performance decreased significantly when CDSS-T was available (p = 0.02 [easy], p < 0.001 [difficult]).
Table 2:
Average AUC and average standard deviation of the observers’ likelihood estimates with and without CDSS-T for the entire set of treatment pairs, and the subsets of easy (average standard deviation of observers’ ratings less than 25%), and difficult (average standard deviation of observers’ ratings ≥25%) treatment pairs.
| CDSS-T | Physicians Without CDSS-T |
Physicians With CDSS-T |
Comparison of (Physicians with vs without CDSS-T) |
|||
|---|---|---|---|---|---|---|
| AUC | Average AUC |
Average standard deviation of observers’ likelihood estimates | Average AUC |
Average standard deviation of observers’ likelihood estimates | p-value for difference in standard deviation | |
| Entire Set |
0.80 | 0.74 | 20.4 | 0.77 | 17.9 | <0.001* |
| Easy Subset |
0.88 | 0.81 | 14.7 | 0.84 | 13.4 | 0.02* |
| Difficult Subset |
0.65 | 0.59 | 29.1 | 0.62 | 24.7 | <0.001* |
Statistically significant at α = 0.05 after Holm-Bonferoni correction
Discussion
In this study, we evaluated the effect of a computer decision support system (CDSS-T) on assessment of complete response to neoadjuvant chemotherapy for bladder cancer after neoadjuvant chemotherapy by physicians interpreting CT examinations. To our knowledge, this is the first study to perform an observer study using a CAD system for this purpose. We observed statistically significant improvement in physicians’ performance when blinded observers were provided the CDSS-T results.
When a subgroup analysis is performed for the different specialty for the physicians, we observed that the p-values for the difference in performance with and without CDSS-T for nonradiology physicians (oncologists and the urologists) was larger than those for the radiology physicians. This may be due to the small sample size (3 physicians) in this subgroup.
There were instances in which both the physicians and the CDSS-T correctly classified a cancer as having responded completely to therapy, as well as instances in which both the observers and CDSS-T incorrectly classified cancer response. However, there were also cancers where the observers correctly classified the cancer, while the CDSS-T did not. Interestingly, in many of these cancers (mean: 25/observer, range: 16-34), the observers were not adversely affected by the erroneous CDSS-T likelihood scores and correctly stood by their initial decisions, indicating that observers usually were not swayed in the wrong direction.
In comparison, when observers incorrectly classified a cancer, but the CDSS-T did not, provision of CDSS-T likelihood scores often (mean: 20/observer, range: 6-41) persuaded observers to modify their assessment in the correct direction. As a result, use of CDSS-T improved physicians’ diagnostic accuracy and reduced physicians’ variability. This was observed both for cancers that were subjectively and objectively considered to be “easy” and those that were subjectively and objectively considered to be “difficult” to interpret. Not surprisingly, we observed a greater reduction in observer variability with CDSS-T on the treatment pairs categorized as difficult, indicating that observers tended to weight the CDSS-T estimate more strongly when they had lower confidence in interpreting difficult cancers. This indicates that the physicians made decision by combining their diagnosis with CDSS-T only as a second opinion.
The size of a lesion pre- or post-treatment does not seem to be a good indicator for complete response to treatment. As can be seen on Figures 5a and 5b, the distribution of the sizes for the complete responders and incomplete responders overlap. This means that the physicians use indicators other than the size of the lesion to determine the complete response to treatment.
While we collected the physicians’ estimates for percent response to treatment and Response Evaluation Criteria in Solid Tumors (RECIST) ratings, we did not analyze these estimates due to the lack of a reference standard.
There are limitations to this study. Due to the lack of a large data set, the CDSS-T scores were obtained through leave-one-case-out cross-validation. Ideally, the system would have been evaluated on an independent test set (14). However, the leave-one-case-out cross-validation approach is well established in the machine learning literature and is a statistically valid technique for estimating classifier performance in an unknown population. In the future, as we collect a larger data set, we will evaluate our system on an independent test set after giving the observers a training session to become acquainted with the performance of the CDSS-T system. Although the performance of CDSS-T alone was higher than any physician observer, the AUC under all circumstances was still modest, probably due to the challenging nature of this classification task. It is possible that the imaging modality itself has a limitation that neither a physician nor computer will be able to overcome. We are now attempting to improve the CDSS-T by combining the imaging-based assessment with other available clinical biomarkers, including results from transuretheral resection of bladder cancer, and bimanual exam under anesthesia, and molecular biomarkers, including genomics and proteomics. Because CAD is not yet available for abdominopelvic applications, none of our observers was experienced in utilizing CAD for bladder cancer. This may have limited their confidence in the CDSS-T system. We expect that physicians will become more receptive to CDSS-T “advice” as they gain experience with the system. This may result in even further improvements in diagnostic accuracy than was observed in our study.
In summary, our study demonstrates that computer-assisted diagnosis using deep learning algorithms and radiomic features can improve the accuracy of CT in identifying complete response of muscle-invasive bladder cancer to neoadjuvant chemotherapy prior to radical cystectomy. Further improvement in the performance of CDSS-T is desirable, and a large-scale observer study should be conducted in an independent case set to validate the impact of the CDSS-T on clinical decision-making. The results of this study might be useful for better selection of patients considering bladder-sparing therapy for muscle-invasive bladder cancer.
Acknowledgements
This work is supported by National Institutes of Health grant number U01CA179106.
Footnotes
Publisher's Disclaimer: This is a PDF file of an unedited manuscript that has been accepted for publication. As a service to our customers we are providing this early version of the manuscript. The manuscript will undergo copyediting, typesetting, and review of the resulting proof before it is published in its final citable form. Please note that during the production process errors may be discovered which could affect the content, and all legal disclaimers that apply to the journal pertain.
Conflict of Interest
The authors declare no conflict of interests.
References
- 1.American Cancer Society. Cancer Facts & Figures 2018. Atlanta: American Cancer Society, Inc.; 2018. [Google Scholar]
- 2.Fagg SL, Dawsonedwards P, Hughes MA, et al. CIS-Diamminedichloroplatinum (DDP) as initial treatment of invasive bladder cancer. British Journal of Urology. 1984;56(3):296–300. [DOI] [PubMed] [Google Scholar]
- 3.Raghavan D, Pearson B, Coorey G, et al. Intravenous CIS-platinum for invasive bladder cancer – safety and feasibility of a new approach. Medical Journal of Australia. 1984;140(5):276–8. [PubMed] [Google Scholar]
- 4.Meeks JJ, Bellmunt J, Bochner BH, et al. A Systematic Review of Neoadjuvant and Adjuvant Chemotherapy for Muscle-invasive Bladder Cancer. European Urology. 2012;62(3):523–33. [DOI] [PubMed] [Google Scholar]
- 5.Witjes JA, Wullink M, Oosterhof GON, deMulder P. Toxicity and results of MVAC (methotrexate, vinblastine, adriamycin and cisplatin) chemotherapy in advanced urothelial carcinoma. European Urology. 1997;31(4):414–9. [DOI] [PubMed] [Google Scholar]
- 6.Kulkarni GS, Hermanns T, Wei YL, et al. Propensity Score Analysis of Radical Cystectomy Versus Bladder-Sparing Trimodal Therapy in the Setting of a Multidisciplinary Bladder Cancer Clinic. Journal of Clinical Oncology. 2017;35(20):2299–+. [DOI] [PubMed] [Google Scholar]
- 7.Cha KH, Hadjiiski L, Chan HP, et al. Bladder Cancer Treatment Response Assessment in CT using Radiomics with Deep-Learning. Scientific Reports. 2017;7. [DOI] [PMC free article] [PubMed] [Google Scholar]
- 8.Hadjiiski LM, Chan H-P, Caoili EM, et al. Auto-Initialized Cascaded Level Set (AICALS) Segmentation of Bladder Lesions on Multi-Detector Row CT Urography. Academic Radiology. 2013;20(2):148–55. [DOI] [PMC free article] [PubMed] [Google Scholar]
- 9.Sahiner B, Chan H-P, Petrick N, et al. Improvement of mammographic mass characterization using spiculation measures and morphological features. Medical Physics. 2001;28:1455–65. [DOI] [PubMed] [Google Scholar]
- 10.Way TW, Hadjiiski LM, Sahiner B, et al. Computer-aided diagnosis of pulmonary nodules on CT scans: segmentation and classification using 3D active contours. Medical Physics. 2006;33(7):2323–37. [DOI] [PMC free article] [PubMed] [Google Scholar]
- 11.Way TW, Sahiner B, Chan H-P, et al. Computer aided diagnosis of pulmonary nodules on CT scans: improvement of classification performance with nodule surface features. Medical Physics. 2009;36:3086–98. [DOI] [PMC free article] [PubMed] [Google Scholar]
- 12.Eisenhauer EA, Therasse P, Bogaerts J, et al. New response evaluation criteria in solid tumours: revised RECIST guideline (version 1.1). Eur J Cancer. 2009;45(2):228–47. [DOI] [PubMed] [Google Scholar]
- 13.Dorfman DD, Berbaum KS, Metz CE, et al. http://perception.radiology.uiowa.edU/Software/ReceiverOperatingCharacteristicROC/MRMCAnalysis/tabid/116/Default.aspx. [PubMed]
- 14.Petrick N, Sahiner B, Armato SG, et al. Evaluation of computer-aided detection and diagnosis systems. Medical Physics. 2013;40(8):087001–17. [DOI] [PMC free article] [PubMed] [Google Scholar]


