Abstract
Background
Patients suffering from polycystic ovary syndrome (PCOS) are often insulin resistant and at elevated risk for developing gestational diabetes mellitus (GDM). The aim of this study was to explore afamin, which can be determined preconceptionally to indicate patients who will subsequently develop GDM. Serum concentrations of afamin are altered in conditions of oxidative stress like insulin resistance (IR) and correlate with the gold standard of IR determination, the HOMA index.
Methods
Afamin serum concentrations and the HOMA index were analyzed post hoc in 63 PCOS patients with live births. Patients were treated at Essen University Hospital, Germany, between 2009 and 2018. Mann–Whitney U test, T test, Spearman’s correlation, linear regression models and receiver-operating characteristic (ROC) analyses were performed for statistical analysis.
Results
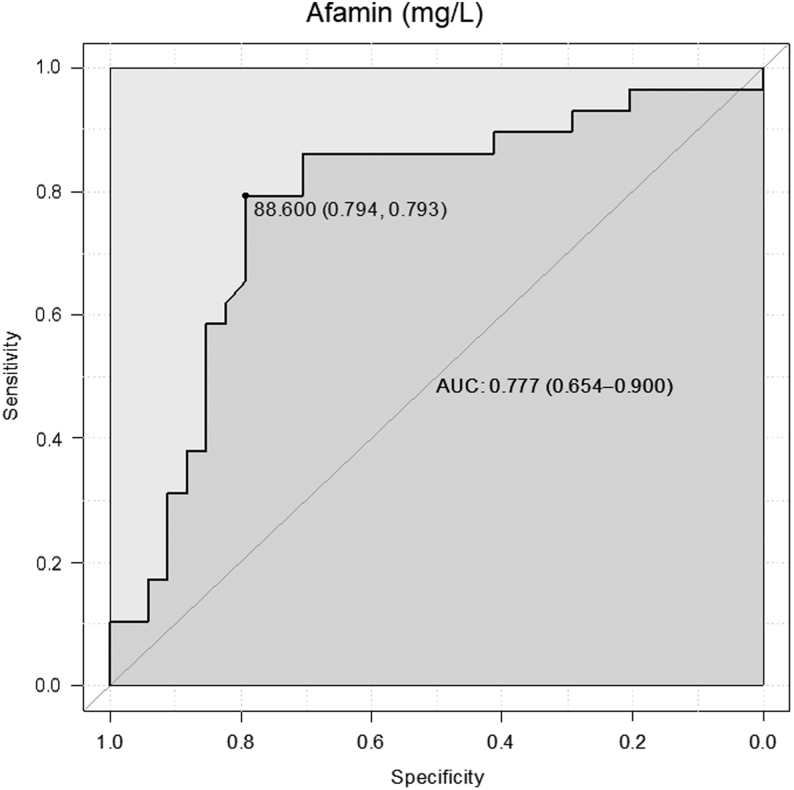
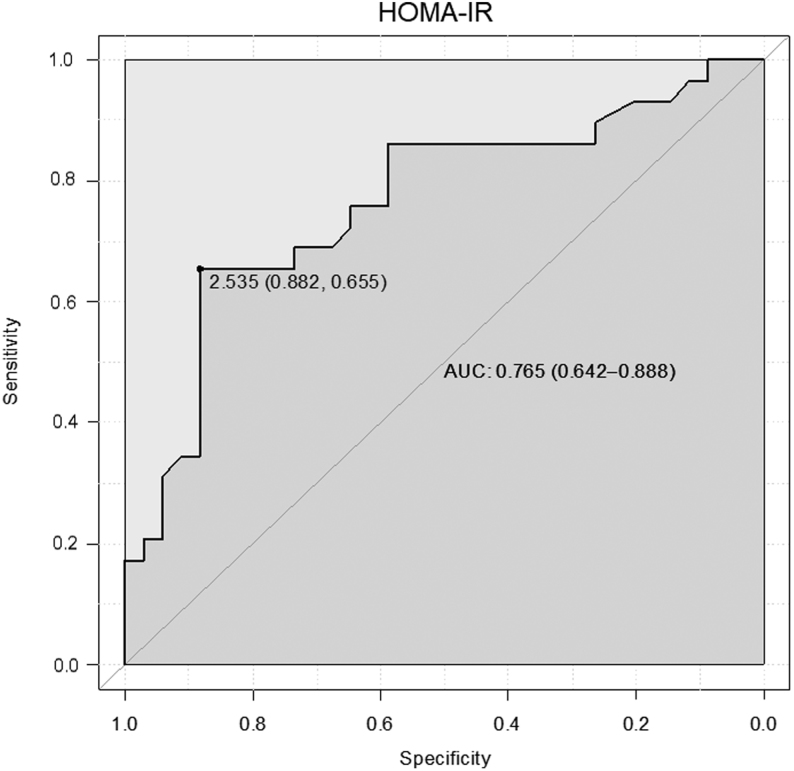
Patients who developed GDM showed significantly higher HOMA and serum afamin values before their pregnancy (P < 0.001, respectively). ROCs for afamin concentrations showed an area under the curve of 0.78 (95% confidence interval (CI) 0.65–0.90) and of 0.77 (95% CI 0.64–0.89) for the HOMA index. An afamin threshold of 88.6 mg/L distinguished between women who will develop GDM and those who will not with a sensitivity of 79.3% and a specificity of 79.4%. A HOMA index of 2.5 showed a sensitivity of 65.5% and a specificity of 88.2%.
Conclusion
The HOMA index and its surrogate parameter afamin are able to identify pre-pregnant PCOS patients who are at risk to develop GDM. Serum afamin concentrations are independent of fasting status and therefore an easily determinable biomarker.
Keywords: afamin, insulin resistance, polycystic ovary syndrome, pre-pregnancy, gestational diabetes mellitus
Introduction
Polycystic ovarian syndrome (PCOS) is a common disorder affecting up to 8% of women of reproductive age (1, 2). The syndrome is characterized by the presence of two of the three following diagnostic criteria: clinical and/or biochemical hyperandrogenism, sonographically determined polycystic ovaries with ≥12 measured small follicles between two and nine millimeters in size and/or an ovarian volume greater than 10 mL and menstrual cycle disorders resulting in infertility (3). PCOS is also associated with several comorbidities resulting in long-term sequelae (4) like insulin resistance (IR) (5), obesity (6) and metabolic syndrome (7).
Although metabolic parameters are not included in the diagnostic criteria, they are thought to play crucial roles in the pathogenesis of the disease. Insulin enhances the effects of luteinizing hormone (LH) in granulosa cells and leads to androgen biosynthesis in PCOS patients in a synergistic way together with LH in vitro (8). IR is found in 50–95% of PCOS patients irrespective of obesity (9). According to a study using the clamp technique, IR was even detected in 75% of lean and in 95% of obese PCOS patients (10).
PCOS patients are at elevated risk to develop pregnancy complications like gestational diabetes mellitus (GDM) (11, 12). IR, as determined with homeostasis model assessment (HOMA-IR) (13), when present before the beginning of a pregnancy seems to be the strongest factor associated with the development of GDM in patients suffering from PCOS, whereas other parameters like sexual hormone-binding protein (SHBG), fasting insulin and testosterone were not predictive after multivariate analysis (14, 15). During the course of a pregnancy, IR increases within a physiological frame. Consecutively, preexistent IR significantly enhances the risk of pathological glucose tolerance in pregnancy (16), resulting in GDM. GDM is associated with many fetal and maternal pathological conditions like macrosomia and birth injury (17, 18).
Currently, determination of IR, for example with HOMA-IR, is not included in PCOS management guidelines. To exclude diabetes mellitus in PCOS patients, a 75 g oral glucose test (OGTT) is recommended in obese women only (3). However, this test requires high-quality standards in performance and pre-analytics. In the light of a large proportion of lean PCOS patients also suffering from IR (10), the role of IR screening before the onset of pregnancy needs further research.
Since only scarce information is available concerning the preconceptional risk determination of pregnancy complications in PCOS patients, we here focus on afamin, an easily determinable biomarker that may indicate IR in pre-pregnant PCOS patients. In a previous study, we were able to demonstrate a strong association between IR and serum afamin concentrations in PCOS patients (19). Additionally, we demonstrated elevated afamin serum concentrations determined during the first and second trimester of pregnancy in patients with GDM (20).
The afamin gene is a member of the albumin gene family localized on chromosome 4 (21). Afamin has been postulated to bind vitamin E in extravascular fluids (22). Vitamin E is an important antioxidant (23) and afamin seems to play a crucial role in oxidative stress-related anti-apoptotic cellular processes (24). Impaired glucose tolerance, hyperandrogenism and oxidative stress were shown to be strongly dependent on each other in PCOS patients (25, 26, 27).
In this study, we explored the association between HOMA-IR and afamin serum concentrations in PCOS patients prior to pregnancy and evaluated the ability of both parameters to predict the development of GDM in these patients.
Subjects and methods
Patients and control subjects
PCOS patients (n = 63) who gave birth were investigated post hoc. We consecutively included all PCOS patients who were treated at the Department of Gynecology and Obstetrics, University Hospital Essen, between 2009 and 2018, became pregnant and from whom pre-pregnant serum samples as well as knowledge about pregnancy outcome were available. We included only women with live births. Patients who were treated with metformin during their pregnancy and were not diagnosed as having GDM were excluded. Four patients had twins (two with GDM, two without GDM) and 59 patients had singleton pregnancies. Patients delivered between gestational day 180 and day 289. Mild late-onset preeclampsia was observed in 3/63 patients. None of the patients delivered a small for gestational age baby. All patients who suffered from PCOS-related sterility were treated as follows: intake of metformin (n = 3), therapy with antiestrogens (n = 13) or recombinant FSH (follicle-stimulating hormone) (n = 37), laparoscopic ovarian drilling (n = 1), in vitro fertilization (IVF) (n = 4) and no therapeutic intervention (n = 5).
Informed written consent was obtained from all patients. The study was approved by the Research Ethics Committee of the University of Essen, Germany (No. 11-4688).
GDM diagnosis
Information on pregnancy outcome was available from medical records. GDM was diagnosed according to currently used guidelines published by the Deutsche Gesellschaft für Gynäkologie und Geburtshilfe (DGGG) (28). Patients without risk factors for GDM underwent a 50 g OGTT, followed by a 75 g OGTT in cases where glucose was ≥135 mg/dL after 1 h as determined by the 50 g OGTT. In patients at high risk for GDM (e.g. obesity, hyperandrogenism) a 75 g OGTT instead of a 50 g OGTT was recommended. Threshold limits were 92 mg/dL in fasting state, 180 mg/dL after 1 h and 153 mg/dL after 2 h. GDM was diagnosed if at least one test was pathological (28). This was the case in 29 (46%) pregnancies, whereas in 34 (54%) pregnant women, no GDM was diagnosed. Of 29 GDM patients, six were treated with diet and 23 with insulin.
PCOS diagnosis
PCOS was diagnosed according to the Rotterdam ESHRE/ASRM-Sponsored PCOS Consensus Workshop Group 2003 (3). Patients presented for blood sampling and a transvaginal scan between the second and the fifth day of their menstrual cycle or after induction of an artificial bleeding by short-time progestin intake in cases of amenorrhea. Real-time ultrasound measurements were performed using a 7-MHz transducer (Voluson E8, General Electric Systems; IU22, Philips Healthcare). Oligomenorrhea was defined as a menstrual cycle longer than 35 days and amenorrhoea as cycles with a duration of more than 3 months. Clinical or biochemical signs of hyperandrogenism were diagnosed with a Ferriman–Gallway score >7 (29) or obvious acne or alopecia (30) or an increased total testosterone (normal range 0.5–2.6 nmol/L) and/or DHEAS (normal range 6–123 μg/dL) and/or androstendione (normal range 0.3–3.3 ng/mL). ACTH test and genetic testing were performed in cases with suspected 21-hydroxylase deficiency. Patients with confirmed adrenogenital syndrome, pituitary, adrenal or other ovarian diseases were excluded from the study. None of the participants had taken hormonal contraceptives for less than 3 months before they participated in the study.
Blood sampling
Blood (29.7 mL) was collected from each patient after a 12-h fasting period into S-Monovette tubes (Sarstedt AG & Co.) for serum analysis of insulin, luteinizing hormone (LH), follicle-stimulating hormone (FSH), total testosterone, sex hormone-binding globulin (SHBG), androstendione, anti-Mullerian hormone (AMH) and afamin. Blood samples were stored at 4°C and processed within 4 h to avoid blood cell lysis. Serum was obtained by low-speed centrifugation, frozen immediately and kept at −80°C until analysis. Also collected was 2.7 mL blood into 2.7 ml Flourid/EDTA Monovette tubes for plasma glucose determination, which was performed immediately after blood collection. Plasma was obtained by low-speed centrifugation. IR was calculated using the homeostasis model assessment (HOMA) (13).
Biochemical analyses
Chemiluminescence immunoassay systems were used to analyze LH, FSH, testosterone (ADVIA Centaur, Siemens Healthcare Diagnostics), androstendione, SHBG and insulin (Immulite 2000 XPi, Siemens Healthcare Diagnostics). Free testosterone index was calculated as ((total testosterone/SHBG) × 100). Glucose was determined photometrically (ADVIA Centaur, Siemens Healthcare Diagnostics). Intra-assay variation was <5% and inter-assay variation was <8% for all parameters.
AMH concentrations were determined with the Gen II AMH immunoassay (Beckman Coulter), according to a revised protocol (31) and following the manufacturer’s instructions. Intra- and inter-assay variations were <6%.
Afamin was measured with a commercially available sandwich ELISA (BioVendor, Brno, Czech Republic) using two different monoclonal antibodies against human afamin as modified from a previously described protocol (32). Recombinantly expressed and purified human afamin served as assay standard. Intra- and inter-observation variation was 3.3 and 6.2%, respectively, at a mean concentration of 73 mg/L (32).
Statistical analyses
Study population characteristics are shown as medians with interquartile ranges (IQR) and means ± sd. T test and the Mann–Whitney U test were used to compare the parameters of interest between the subgroups. Spearman’s correlation coefficient was calculated to determine the relationship between afamin concentrations and HOMA-IR. To compare afamin and HOMA-IR between subgroups adjusted for maternal age and BMI as potential confounder, multiple linear regression models were used including GDM status as independent variable and maternal age and BMI as covariate to estimate confounder-adjusted least-squares means with 95% CIs as marginal averages.
Receiver-operating characteristic (ROC) analysis was performed for HOMA-IR and afamin concentrations to test their ability to discriminate between patients who will and those who will not develop GDM. We additionally calculated ROCs for SHBG, the LH/FSH ratio and the BMI, since these parameters also differed between the subgroups. The area under the curve (AUC) estimates were calculated to indicate the probability of accurately discriminating between the two subgroups. Differences in AUC values were compared by means of DeLong’s test for correlated ROC curves. The optimal cut-off value, that is, the threshold that maximizes the sum of (sensitivity + specificity) was calculated according to Youden (33). All statistical analyses were performed with the R statistical package, version 3.4.0 (34).
Results
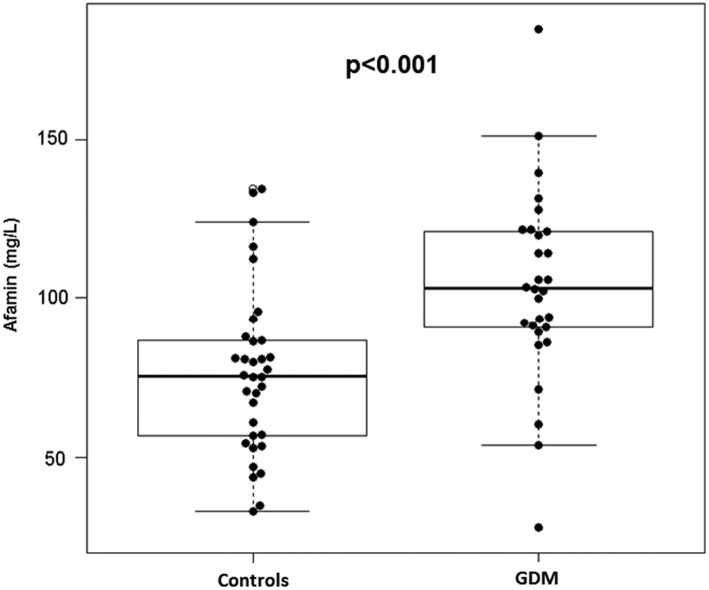
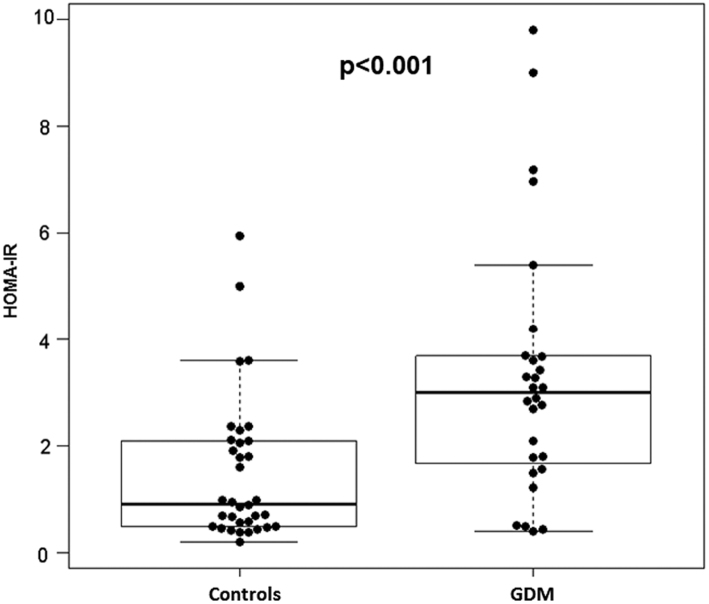
Patient characteristics are shown in Table 1. GDM patients presented with significantly higher concentrations of afamin (P < 0.001, Fig. 1), HOMA-IR (P < 0.001, Fig. 2) and BMI (P < 0.001) as well as significantly lower levels of LH (P = 0.04), LH/FSH ratio (P = 0.005) and SHBG (P = 0.002) than did controls. There was a significant correlation between HOMA-IR and afamin concentrations (Spearman’s correlation coefficient r = 0.61; P < 0.001).
Table 1.
Patient characteristics.
| Mean (±s.d.) | Patients with GDM (n = 29) | Patients without GDM (n = 34) | P value |
|---|---|---|---|
| Median (IQR) | |||
| Parameters determined before pregnancy | |||
| BMI (kg/m2) | 32.6 (7.5) 32.0 (27.5–37.7) |
26.0 (6.2) 25.7 (21.6–29.1) |
<0.001 |
| Age (years) | 30.5 (4.9) 30.0 (26.8–33.3) |
28.7 (5.0) 29.5 (24.0–32.0) |
0.163 |
| Ovarian volume (mL) | 11.4 (5.0) 10.8 (8.0–14.3) |
13.9 (5.0) 13.8 (10.1–17.0) |
0.065 |
| Follicle count (number of follicles) | 14 (7) 13 (9–17) |
18 (10) 14 (12–20) |
0.125 |
| LH (IU/L) | 6.3 (3.0) 5.9 (4.0–7.1) |
8.2 (3.9) 7.9 (5.4–9.9) |
0.042 |
| FSH (IU/L) | 6.5 (1.8) 6.2 (5.5–7.4) |
5.8 (1.9) 5.9 (4.9–7.0) |
0.141 |
| LH/FSH ratio | 1.1 (0.6) 0.9 (0.7–1.3) |
1.6 (0.9) 1.4 (0.9–1.8) |
0.005 |
| Testosterone (nmol/L) | 2.0 (0.8) 1.8 (1–2.2) |
1.9 (0.8) 1.7 (1.3–2.4) |
0.692 |
| Androstendione (ng/mL) | 3.1 (2.11) 2.8 (1.7–3.7) |
3.1 (1.3) 2.7 (2.2–3.9) |
0.684 |
| SHBG (nmol/L) | 32.9 (15.9) 27.8 (20.9–39.6) |
56.5 (30.2) 56.8 (29.3–76.2) |
0.002 |
| FTI (%) | 7.4 (5.4) 6.1 (3.4–9.1) |
4.9 (3.5) 3.6 (2.3–5.8) |
0.058 |
| Afamin (mg/L) | 103.7 (30.3) 103.1 (90.4–121.2) |
76.4 (25.9) 75.5 (56.8–86.8) |
<0.001 |
| Fasting glucose (mg/dL) | 94.4 (10.7) 95.0 (89.8–98.8) |
84.8 (8.2) 84.0 (77.5–88.8) |
<0.001 |
| Fasting insulin (µlU/mL) | 15.6 (12.6) 13.5 (7.6–18.5) |
6.5 (5.9) 4.0 (2.5–9.7) |
<0.001 |
| HOMA-IR | 3.8 (3.7) 3.1 (1.7–3.8) |
1.5 (1.4) 0.9 (0.5–2.1) |
<0.001 |
| AMH (ng/L) | 6.7 (4.7) 5.9 (2.9–9.5) |
8.9 (5.3) 7.8 (5.6–11.3) |
0.109 |
| Parameters determined in pregnancy | |||
| 75 g OGTT Fasting glucose (mg/dL) |
89.4 (11.5) 91.5 (82.5–100.0) |
76.1 (10.7) 78.0 (66.0–84.0) |
0.012 |
| 75 g OGTT 1 h glucose (mg/dL) |
175.0 (33.5) 184.0 (155.8–195.3) |
121.6 (33.0) 124.0 (95.0–145.0) |
0.001 |
| 75 g OGTT 2 h glucose (mg/dL) |
148.1 (40.6) 134.5 (116.0–197.0) |
94.3 (25.4) 86.5 (75.0–112.5) |
0.003 |
| 50 g OGTT 1 h glucose (mg/dL) |
90.0 (11.2) 89.0 (81.5–98.5) |
||
| Gestational age at delivery (days) | 261 (20) 265 (258–271) |
266 (22) 273 (252–280) |
0.051 |
| Newborn weight (g) | 3109 (689) 3260 (2745–3605) |
3046 (811) 3215 (2435–3620) |
0.84 |
Values are presented as means with s.d. and medians with interquartile ranges (IQR).
AMH, anti-Mullerian hormone; BMI, body mass index; FSH, follicle-stimulating hormone; FTI, free testosterone index; LH, luteinizing hormone; OGTT, oral glucose tolerance test; SHBG, sexual hormone-binding protein.
Figure 1.
Box/scatter plots illustrating the distribution of afamin serum concentrations (mg/L) in pre-pregnant PCOS patients without (n = 34) and with gestational diabetes mellitus (n = 29).
Figure 2.
Box/scatter plots illustrating the distribution of HOMA-IR (homeostasis model assessment of insulin resistance) in pre-pregnant PCOS patients without (n = 34) and with gestational diabetes mellitus (n = 29).
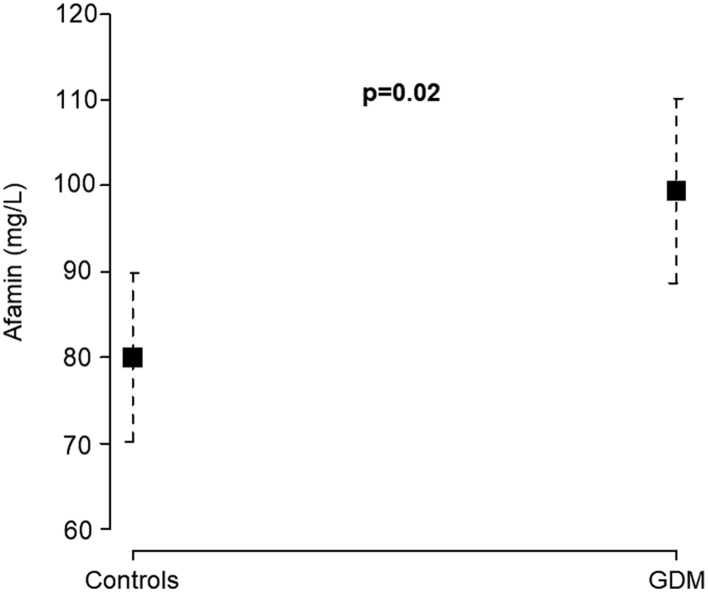
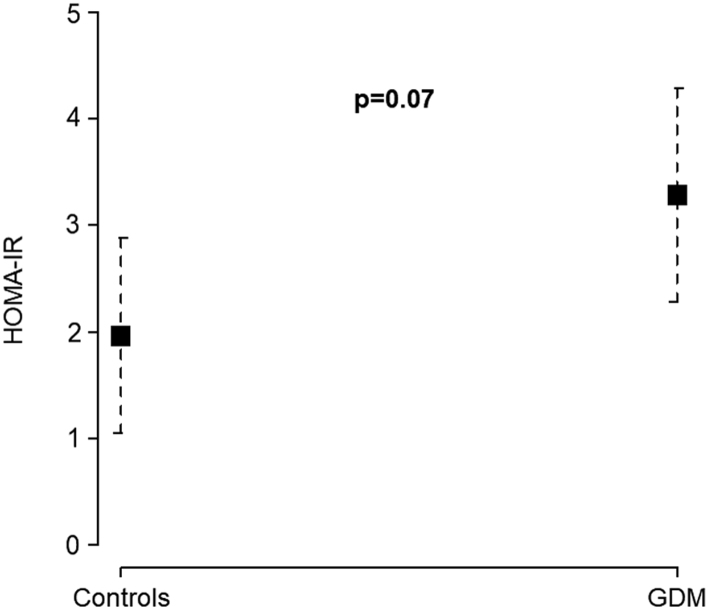
After adjusting for maternal age, afamin serum concentrations were significantly higher in GDM patients (mean 104.0 mg/L; 95% CI 93.4–114.6) than in controls (mean 76.1 mg/L; 95% CI 66.4–85.9; P = 0.0003). Adjustment for BMI showed almost identical results for GDM patients (mean 99.4 mg/L; 95% CI 70.3–89.9) and controls (mean 80.1 mg/L; 95% CI 88.6–110.1; P = 0.02, Fig. 3). HOMA-IR was also higher in GDM patients (mean 3.8; 95% CI 2.8–4.9) than in controls (mean 1.5; 95% CI 0.6–2.4; P = 0.001) after adjusting for maternal age. After adjustment for BMI, HOMA-IR no longer showed a significant difference between GDM patients (mean 3.3; 95% CI 2.3–4.3) and controls (mean 2.0; 95% CI 1.1–2.9; P = 0.07, Fig. 4).
Figure 3.
Serum concentrations of afamin among pre-pregnant patients without (n = 34) and with gestational diabetes mellitus (n = 29), adjusted for maternal age and body mass index (BMI).
Figure 4.
HOMA-IR (homeostasis model assessment of insulin resistance) among pre-pregnant patients without (n = 34) and with gestational diabetes mellitus (n = 29), adjusted for maternal age and body mass index (BMI).
ROCs for afamin concentrations showed an AUC of 0.78 (95% CI 0.65–0.90) and of 0.77 (95% CI 0.64–0.89) for the HOMA index (Table 2, Figs 5 and 6). An afamin threshold of 88.6 mg/L distinguished between women who developed GDM and those who did not with a sensitivity of 79.3% and a specificity of 79.4%. A HOMA index of 2.5 showed a sensitivity of 65.5% and a specificity of 88.2%. The AUC did not differ significantly between afamin and HOMA-IR (P = 0.84), indicating a comparable potency for predicting the development of GDM using either of these two parameters.
Table 2.
Results of ROC analyses.
| Variable | AUC (95% CI) | Threshold | Specificity (%) | Sensitivity (%) |
|---|---|---|---|---|
| Afamin | 0.78 (0.65–0.90) | 88.6 mg/L | 79.4 | 79.3 |
| HOMA index | 0.77 (0.64–0.89) | 2.5 | 88.2 | 65.5 |
| SHBG | 0.74 (0.61–0.86) | 41.4 nmol/L | 65.6 | 77.8 |
| BMI | 0.76 (0.63–0.88) | 27.6 kg/m2 | 67.7 | 75.9 |
| LH/FSH ratio | 0.71 (0.57–0.84) | 0.9 | 83.9 | 53.6 |
BMI, body mass index; FSH, follicle-stimulating hormone; LH, luteinizing hormone; SHBG, sexual hormone-binding protein.
Figure 5.
Receiver operating characteristic (ROC) analysis of serum afamin concentrations showing the discrimination between patients who will develop gestational diabetes and those who will not.
Figure 6.
Receiver operating characteristic (ROC) analysis of HOMA-IR (homeostasis model assessment of insulin resistance) showing the discrimination between patients who will develop gestational diabetes (GDM) and those who will not.
Since SHBG, BMI and LH/FSH ratio differed significantly between patients developing GDM and controls, we additionally performed ROC analyses of these parameters. Their AUC were similar compared to the AUC for afamin or HOMA (Table 2).
Discussion
The aim of this study was to evaluate the predictive potency of afamin concentrations and the HOMA-IR to predict GDM in PCOS patients preconceptionally. We were able to demonstrate that the risk to develop GDM is strongly associated with increased preconceptional afamin serum concentrations and HOMA-IR in PCOS patients. Preconceptional values of 2.5 for HOMA-IR and 88.6 mg/L for afamin concentrations showed the best sensitivity and specificity in predicting the development of GDM.
Patients who developed GDM also had higher BMI, SHBG concentrations und LH/FSH ratio preconceptionally than did pregnant women without GDM. However, the potency of these parameters to predict GDM was lower than that of afamin or HOMA-IR.
Several further authors were able to demonstrate that preconceptional IR is a significant risk factor for developing GDM in non-PCOS (16) as well as in PCOS patients (35, 36). In uncomplicated pregnancies, IR increases physiologically and is necessary for proper materno-fetal glucose transfer. In the case of elevated pre-pregnancy IR, pathological glucose tolerance of the mother with increased glucose transfer to the fetus can occur. The impaired obstetrical and neonatal outcomes were convincingly demonstrated in the HAPO trial (18).
Knowledge about the occurrence of increased IR and the subsequent early detection and treatment of GDM is advantageous with regard to early pregnancy loss (37, 38) and perinatal outcome (39). Consequently, the determination of pathological glucose tolerance should be monitored early in pregnancy in women with pre-pregnant IR. Otherwise, the performance of a glucose tolerance test in the second trimester may ignore GDM that is already present before the 24th week of pregnancy.
Our findings are in accordance with those published by de Wilde et al. (14). Those authors studied 72 PCOS patients, of whom 31% developed GDM. After multivariate analysis, HOMA-IR was the only significant predictor of GDM in pre-pregnant PCOS patients. In the cited study, median preconceptional HOMA-IR was 2.1 in the group of GDM patients. Median HOMA-IR in our study was 3.1. However, the participants with GDM in the study by de Wilde et al., were obviously leaner (median BMI: 27.4 kg/m2; IQR 22.7–33.8) than were those in our cohort (median BMI: 32.0 kg/m2; IQR 27.5–37.7).
We excluded GDM patients from our cohort who had a history of pregnancy complications like recurrent early miscarriages or fetal loss in the second trimester and therefore received metformin during the first trimester of pregnancy. In observational studies it was shown that the intake of metformin may reduce the risk of suffering pregnancy complications including GDM (38), although this remains controversial (40, 41). Nevertheless, exclusion of these patients may be a bias resulting in an altered subgroup distribution with a higher mean HOMA-IR compared to the study of de Wilde et al. (14). In accordance with this study (14), the newborn weight of our participants’ babies did not differ between women with and without GDM. Very intensive care with straight glucose control was offered to our patients with GDM, which may be an explanation for the low rate of large for gestational age babies in our study population.
The exact role of afamin in contributing to impaired glucose tolerance and metabolic syndrome development is not fully clarified. Increased serum afamin levels were shown to indicate conditions with elevated risk for metabolic syndrome like dyslipidemia, hypertension, glucose tolerance disorders and obesity in an animal model as well as in large human population-based cohorts (42, 43). Evidence was provided for a direct influence of afamin on glucose metabolism in vitro (44). The most important association between impaired glucose tolerance and afamin, however, seems to be founded in the known interplay between oxidative stress, chronic inflammation and IR (43). From clinical research with elevated afamin concentrations in distinct clinical conditions as described above, a functional role of afamin in oxidative stress situations and chronic inflammation is hypothesized. However, a functional relation between afamin and the antioxidant vitamin E in human plasma has not yet been demonstrated (45).
Since afamin concentrations increase linearly with gestational age (46), their determination and interpretation in pregnancy require defined gestational age-specific thresholds that are not yet exactly described. Determination before pregnancy, in contrast, does not depend on gestational age-specific alterations of the parameter.
As a limitation of this study it should be mentioned that the time between afamin determination and conception differed between patients. Weight gain or loss may have contributed to afamin concentrations immediately before conception.
In summary, IR is associated with oxidative stress in PCOS patients (26). This condition seems to be reflected by increased afamin serum concentrations (19). Afamin is therefore able to identify PCOS patients with IR and an elevated risk to develop GDM. Since serum afamin concentrations are independent of sex, age and fasting status (32), it is an easily determinable biomarker. In contrast, determination of HOMA-IR needs precise fasting conditions and defined pre-analytical standards to avoid glycolysis. Since HOMA-IR is a valid method for diagnosing IR (13, 47), afamin probably will not replace it, but may act as a surrogate marker for IR screening.
Conclusion
PCOS patients are at elevated risk for pregnancy complications like GDM. Pre-pregnant impaired glucose tolerance seems to be the major risk factor. The gold standard for IR determination is HOMA-IR. The afamin serum concentration is a surrogate parameter for IR, correlates strongly with HOMA-IR and showed the highest AUC in distinguishing between pre-pregnant PCOS patients who will develop GDM and those who will not. Therefore, afamin appears to be a suitable and easily determinable biomarker in pre-pregnant PCOS patients indicating an elevated risk for GDM.
Declaration of interest
The authors declare that there is no conflict of interest that could be perceived as prejudicing the impartiality of the research reported.
Funding
This work was supported by aid provided by the University of Duisburg-Essen to A K and by the Austrian Research Fund (P19969-B11) to H D.
Acknowledgments
The authors thank the laboratory staff and the nurses of Essen University Hospital, Department of Gynecology and Obstetrics, for technical assistance and data documentation. They are also indebted to Johanna van Halteren and Caroline Schwenk for data collection and to Mary Heaney Margreiter for English language editing and critical reading of the manuscript.
References
- 1.Azziz R. PCOS: a diagnostic challenge. Reproductive Biomedicine Online 2004. 8 644–648. ( 10.1016/S1472-6483(10)61644-6) [DOI] [PubMed] [Google Scholar]
- 2.Michelmore KF, Balen AH, Dunger DB, Vessey MP. Polycystic ovaries and associated clinical and biochemical features in young women. Clinical Endocrinology 1999. 51 779–786. ( 10.1046/j.1365-2265.1999.00886.x) [DOI] [PubMed] [Google Scholar]
- 3.The Rotterdam ESHRE/ASRM‐sponsored PCOS consensus workshop group. Revised 2003 consensus on diagnostic criteria and long-term health risks related to polycystic ovary syndrome (PCOS). Human Reproduction 2004. 19 41–47. ( 10.1093/humrep/deh098) [DOI] [PubMed] [Google Scholar]
- 4.Fauser BC, Tarlatzis BC, Rebar RW, Legro RS, Balen AH, Lobo R, Carmina E, Chang J, Yildiz BO, Laven JS, et al. Consensus on women’s health aspects of polycystic ovary syndrome (PCOS): the Amsterdam ESHRE/ASRM-Sponsored 3rd PCOS Consensus Workshop Group. Fertility and Sterility 2012. 97 28.e25–38.e25. ( 10.1016/j.fertnstert.2011.09.0240) [DOI] [PubMed] [Google Scholar]
- 5.Baillargeon JP, Nestler JE. Commentary: polycystic ovary syndrome: a syndrome of ovarian hypersensitivity to insulin? Journal of Clinical Endocrinology and Metabolism 2006. 91 22–24. ( 10.1210/jc.2005-1804) [DOI] [PMC free article] [PubMed] [Google Scholar]
- 6.Hahn S, Tan S, Elsenbruch S, Quadbeck B, Herrmann BL, Mann K, Janssen OE. Clinical and biochemical characterization of women with polycystic ovary syndrome in North Rhine-Westphalia. Hormone and Metabolic Research 2005. 37 438–444. ( 10.1055/s-2005-870236) [DOI] [PubMed] [Google Scholar]
- 7.Hahn S, Tan S, Sack S, Kimmig R, Quadbeck B, Mann K, Janssen OE. Prevalence of the metabolic syndrome in German women with polycystic ovary syndrome. Experimental and Clinical Endocrinology & Diabetes 2007. 115 130–135. ( 10.1055/s-2007-967093) [DOI] [PubMed] [Google Scholar]
- 8.Willis D, Mason H, Gilling-Smith C, Franks S. Modulation by insulin of follicle-stimulating hormone and luteinizing hormone actions in human granulosa cells of normal and polycystic ovaries. Journal of Clinical Endocrinology and Metabolism 1996. 81 302–309. ( 10.1210/jcem.81.1.8550768) [DOI] [PubMed] [Google Scholar]
- 9.Dunaif A, Segal KR, Futterweit W, Dobrjansky A. Profound peripheral insulin resistance, independent of obesity, in polycystic ovary syndrome. Diabetes 1989. 38 1165–1174. ( 10.2337/diab.38.9.1165) [DOI] [PubMed] [Google Scholar]
- 10.Stepto NK, Cassar S, Joham AE, Hutchison SK, Harrison CL, Goldstein RF, Teede HJ. Women with polycystic ovary syndrome have intrinsic insulin resistance on euglycaemic-hyperinsulaemic clamp. Human Reproduction 2013. 28 777–784. ( 10.1093/humrep/des463) [DOI] [PubMed] [Google Scholar]
- 11.Boomsma CM, Eijkemans MJ, Hughes EG, Visser GH, Fauser BC, Macklon NS. A meta-analysis of pregnancy outcomes in women with polycystic ovary syndrome. Human Reproduction Update 2006. 12 673–683. ( 10.1093/humupd/dml036) [DOI] [PubMed] [Google Scholar]
- 12.Palomba S, de Wilde MA, Falbo A, Koster MP, La Sala GB, Fauser BC. Pregnancy complications in women with polycystic ovary syndrome. Human Reproduction Update 2015. 21 575–592. ( 10.1093/humupd/dmv029) [DOI] [PubMed] [Google Scholar]
- 13.Matthews DR, Hosker JP, Rudenski AS, Naylor BA, Treacher DF, Turner RC. Homeostasis model assessment: insulin resistance and beta-cell function from fasting plasma glucose and insulin concentrations in man. Diabetologia 1985. 28 412–419. ( 10.1007/BF00280883) [DOI] [PubMed] [Google Scholar]
- 14.de Wilde MA, Goverde AJ, Veltman-Verhulst SM, Eijkemans MJ, Franx A, Fauser BC, Koster MP. Insulin action in women with polycystic ovary syndrome and its relation to gestational diabetes. Human Reproduction 2015. 30 1447–1453. ( 10.1093/humrep/dev072) [DOI] [PubMed] [Google Scholar]
- 15.de Wilde MA, Veltman-Verhulst SM, Goverde AJ, Lambalk CB, Laven JS, Franx A, Koster MP, Eijkemans MJ, Fauser BC. Preconception predictors of gestational diabetes: a multicentre prospective cohort study on the predominant complication of pregnancy in polycystic ovary syndrome. Human Reproduction 2014. 29 1327–1336. ( 10.1093/humrep/deu077) [DOI] [PubMed] [Google Scholar]
- 16.Catalano PM. Trying to understand gestational diabetes. Diabetic Medicine 2014. 31 273–281. ( 10.1111/dme.12381) [DOI] [PMC free article] [PubMed] [Google Scholar]
- 17.Gudmundsson S, Henningsson AC, Lindqvist P. Correlation of birth injury with maternal height and birthweight. BJOG 2005. 112 764–767. ( 10.1111/j.1471-0528.2004.00545.x) [DOI] [PubMed] [Google Scholar]
- 18.HAPO Study Cooperative Research Group, Metzger BE, Lowe LP, Dyer AR, Trimble ER, Chaovarindr U, Coustan DR, Hadden DR, McCance DR, Hod M, et al. Hyperglycemia and adverse pregnancy outcomes. New England Journal of Medicine 2008. 358 1991–2002. ( 10.1056/NEJMoa0707943) [DOI] [PubMed] [Google Scholar]
- 19.Koninger A, Edimiris P, Koch L, Enekwe A, Lamina C, Kasimir-Bauer S, Kimmig R, Dieplinger H. Serum concentrations of afamin are elevated in patients with polycystic ovary syndrome. Endocrine Connections 2014. 3 120–126. ( 10.1530/EC-14-0053) [DOI] [PMC free article] [PubMed] [Google Scholar]
- 20.Koninger A, Mathan A, Mach P, Frank M, Schmidt B, Schleussner E, Kimmig R, Gellhaus A, Dieplinger H. Is afamin a novel biomarker for gestational diabetes mellitus? A pilot study. Reproductive Biology and Endocrinology 2018. 16 30 ( 10.1186/s12958-018-0338-x) [DOI] [PMC free article] [PubMed] [Google Scholar]
- 21.Lichenstein HS, Lyons DE, Wurfel MM, Johnson DA, McGinley MD, Leidli JC, Trollinger DB, Mayer JP, Wright SD, Zukowski MM. Afamin is a new member of the albumin, a-fetoprotein, and vitamin D-binding protein gene family. Journal of Biological Chemistry 1994. 269 18149–18154. [PubMed] [Google Scholar]
- 22.Voegele AF, Jerkovic L, Wellenzohn B, Eller P, Kronenberg F, Liedl KR, Dieplinger H. Characterization of the vitamin E-binding properties of human plasma afamin. Biochemistry 2002. 41 14532–14538. ( 10.1021/bi026513v) [DOI] [PubMed] [Google Scholar]
- 23.Ricciarelli R, Zingg JM, Azzi A. Vitamin E 80th anniversary: a double life, not only fighting radicals. IUBMB Life 2001. 52 71–76. ( 10.1080/15216540252774801) [DOI] [PubMed] [Google Scholar]
- 24.Heiser M, Hutter-Paier B, Jerkovic L, Pfragner R, Windisch M, Becker-Andre M, Dieplinger H. Vitamin E binding protein afamin protects neuronal cells in vitro. Journal of Neural Transmission: Supplementa 2002. (Supplement 62) 337–345. [DOI] [PubMed] [Google Scholar]
- 25.Gonzalez F, Minium J, Rote NS, Kirwan JP. Hyperglycemia alters tumor necrosis factor-alpha release from mononuclear cells in women with polycystic ovary syndrome. Journal of Clinical Endocrinology and Metabolism 2005. 90 5336–5342. ( 10.1210/jc.2005-0694) [DOI] [PubMed] [Google Scholar]
- 26.Gonzalez F, Rote NS, Minium J, Kirwan JP. Increased activation of nuclear factor kappaB triggers inflammation and insulin resistance in polycystic ovary syndrome. Journal of Clinical Endocrinology and Metabolism 2006. 91 1508–1512. ( 10.1210/jc.2005-2327) [DOI] [PubMed] [Google Scholar]
- 27.Gonzalez F, Rote NS, Minium J, Kirwan JP. Reactive oxygen species-induced oxidative stress in the development of insulin resistance and hyperandrogenism in polycystic ovary syndrome. Journal of Clinical Endocrinology and Metabolism 2006. 91 336–340. ( 10.1210/jc.2005-1696) [DOI] [PubMed] [Google Scholar]
- 28.Kleinwechter H, Schafer-Graf U, Buhrer C, Hoesli I, Kainer F, Kautzky-Willer A, Pawlowski B, Schunck K, Somville T, Sorger M, et al. Gestational diabetes mellitus (GDM) diagnosis, therapy and follow-up care: practice guideline of the German Diabetes Association (DDG) and the German Association for Gynaecologyand Obstetrics (DGGG). Experimental and Clinical Endocrinology and Diabetes 2014. 122 395–405. ( 10.1055/s-0034-1366412) [DOI] [PubMed] [Google Scholar]
- 29.Ferriman D, Gallwey JD. Clinical assessment of body hair growth in women. Journal of Clinical Endocrinology and Metabolism 1961. 21 1440–1447. ( 10.1210/jcem-21-11-1440) [DOI] [PubMed] [Google Scholar]
- 30.Ludwig E. Classification of the types of androgenetic alopecia (common baldness) occurring in the female sex. British Journal of Dermatology 1977. 97 247–254. ( 10.1111/j.1365-2133.1977.tb15179.x) [DOI] [PubMed] [Google Scholar]
- 31.Bonifacio M, Bradley CK, Karia S, Livingstone M, Bowman MC, McArthur SJ. The original Beckman Coulter Generation II assay significantly underestimates AMH levels compared with the revised protocol. Journal of Assisted Reproduction and Genetics 2015. 32 1691–1696. ( 10.1007/s10815-015-0579-y) [DOI] [PMC free article] [PubMed] [Google Scholar]
- 32.Dieplinger B, Egger M, Gabriel C, Poelz W, Morandell E, Seeber B, Kronenberg F, Haltmayer M, Mueller T, Dieplinger H. Analytical characterization and clinical evaluation of an enzyme-linked immunosorbent assay for measurement of afamin in human plasma. Clinica Chimica Acta: International Journal of Clinical Chemistry 2013. 425 236–241. ( 10.1016/j.cca.2013.08.016) [DOI] [PMC free article] [PubMed] [Google Scholar]
- 33.Youden WJ. Index for rating diagnostic tests. Cancer 1950. 3 32–35. () [DOI] [PubMed] [Google Scholar]
- 34.R Core Team. A Language and Environment for Statistical Computing: Vienna, Austria: R Foundation for Statistical Computing, 2014. [Google Scholar]
- 35.Wei D, Zhang B, Shi Y, Zhang L, Zhao S, Du Y, Xu L, Legro RS, Zhang H, Chen ZJ. Effect of preconception impaired glucose tolerance on pregnancy outcomes in women With polycystic ovary syndrome. Journal of Clinical Endocrinology and Metabolism 2017. 102 3822–3829. ( 10.1210/jc.2017-01294) [DOI] [PubMed] [Google Scholar]
- 36.Xia H, Zhang R, Sun X, Wang L, Zhang W. Valuable predictors of gestational diabetes mellitus in infertile Chinese women with polycystic ovary syndrome: a prospective cohort study. Gynecological Endocrinology 2017. 33 448–451. ( 10.1080/09513590.2017.1290074) [DOI] [PubMed] [Google Scholar]
- 37.Cundy T, Gamble G, Neale L, Elder R, McPherson P, Henley P, Rowan J. Differing causes of pregnancy loss in type 1 and type 2 diabetes. Diabetes Care 2007. 30 2603–2607. ( 10.2337/dc07-0555) [DOI] [PubMed] [Google Scholar]
- 38.Nawaz FH, Khalid R, Naru T, Rizvi J. Does continuous use of metformin throughout pregnancy improve pregnancy outcomes in women with polycystic ovarian syndrome? Journal of Obstetrics and Gynaecology Research 2008. 34 832–837. ( 10.1111/j.1447-0756.2008.00856.x) [DOI] [PubMed] [Google Scholar]
- 39.Dong ZG, Beischer NA, Wein P, Sheedy MT. Value of early glucose tolerance testing in women who had gestational diabetes in their previous pregnancy. Australian and New Zealand Journal of Obstetrics and Gynaecology 1993. 33 350–357. ( 10.1111/j.1479-828X.1993.tb02107.x) [DOI] [PubMed] [Google Scholar]
- 40.Glueck CJ, Wang P, Kobayashi S, Phillips H, Sieve-Smith L. Metformin therapy throughout pregnancy reduces the development of gestational diabetes in women with polycystic ovary syndrome. Fertility and Sterility 2002. 77 520–525. ( 10.1016/S0015-0282(01)03202-2) [DOI] [PubMed] [Google Scholar]
- 41.Vanky E, Stridsklev S, Heimstad R, Romundstad P, Skogoy K, Kleggetveit O, Hjelle S, von Brandis P, Eikeland T, Flo K, et al. Metformin versus placebo from first trimester to delivery in polycystic ovary syndrome: a randomized, controlled multicenter study. Journal of Clinical Endocrinology and Metabolism 2010. 95 E448–E455. ( 10.1210/jc.2010-0853) [DOI] [PubMed] [Google Scholar]
- 42.Kollerits B, Lamina C, Huth C, Marques-Vidal P, Kiechl S, Seppala I, Cooper J, Hunt SC, Meisinger C, Herder C, et al. Plasma concentrations of afamin are associated With prevalent and incident Type 2 diabetes: a pooled analysis in more than 20,000 individuals. Diabetes Care 2017. 40 1386–1393. ( 10.2337/dc17-0201) [DOI] [PubMed] [Google Scholar]
- 43.Kronenberg F, Kollerits B, Kiechl S, Lamina C, Kedenko L, Meisinger C, Willeit J, Huth C, Wietzorrek G, Altmann ME, et al. Plasma concentrations of afamin are associated with the prevalence and development of metabolic syndrome. Circulation: Cardiovascular Genetics 2014. 7 822–829. ( 10.1161/CIRCGENETICS.113.000654) [DOI] [PubMed] [Google Scholar]
- 44.Shen CT, Wei WJ, Qiu ZL, Song HJ, Luo QY. Afamin promotes glucose metabolism in papillary thyroid carcinoma. Molecular and Cellular Endocrinology 2016. 434 108–115. ( 10.1016/j.mce.2016.06.013) [DOI] [PubMed] [Google Scholar]
- 45.Jerkovic L, Voegele AF, Chwatal S, Kronenberg F, Radcliffe CM, Wormald MR, Lobentanz EM, Ezeh B, Eller P, Dejori N, et al. Afamin is a novel human vitamin E-binding glycoprotein characterization and in vitro expression. Journal of Proteome Research 2005. 4 889–899. ( 10.1021/pr0500105) [DOI] [PubMed] [Google Scholar]
- 46.Hubalek M, Buchner H, Mortl MG, Schlembach D, Huppertz B, Firulovic B, Kohler W, Hafner E, Dieplinger B, Wildt L, et al. The vitamin E-binding protein afamin increases in maternal serum during pregnancy. Clinica Chimica Acta: International Journal of Clinical Chemistry 2014. 434 41–47. ( 10.1016/j.cca.2014.03.036) [DOI] [PMC free article] [PubMed] [Google Scholar]
- 47.Jensterle M, Weber M, Pfeifer M, Prezelj J, Pfutzner A, Janez A. Assessment of insulin resistance in young women with polycystic ovary syndrome. International Journal of Gynaecology and Obstetrics 2008. 102 137–140. ( 10.1016/j.ijgo.2008.03.017) [DOI] [PubMed] [Google Scholar]


 This work is licensed under a