POLITICAL SCIENCES Correction for “Causal effect of intergroup contact on exclusionary attitudes,” by Ryan D. Enos, which was first published February 24, 2014; 10.1073/pnas.1317670111 (Proc Natl Acad Sci USA 111:3699–3704).
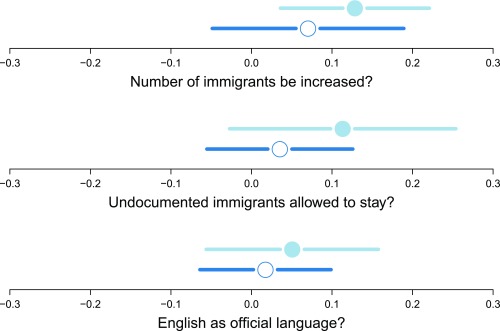
The author notes that, in Fig. 2 and Table 1, the second listed question appears incorrectly. It appeared as “Children of undocumented be allowed to stay?” but should instead have appeared as “Undocumented immigrants allowed to stay?” The correct version of the question appears in full on page 3701, right column, first full paragraph, lines 9–11. The corrected Fig. 2 and corrected Table 1 appear below. The online version has been corrected.
Fig. 2.
Time effects. ATE and 95% confidence intervals for 3-d treatment (solid circle) and 10-d treatment (open circle). P values from top to bottom generated from a two-tailed test against the Null Hypothesis of no difference in effect between the 3-d and 10-d treatments are P = 0.195, 0.094, and 0.305. n = 55 for 3-d dose and 54 for 10-d dose. Confidence intervals are constructed by drawing the 2.5% and 97.5% quantiles from the randomization distribution.
Table 1.
Experiment results
| Question | All respondents | Waits on platform | All respondents |
| Question | ATE (P)* | CATE (P) | T1 levels (SD) |
| Number of immigrants be increased?† | 0.09 (0.008) | 0.083 (0.012) | 0.489 (0.272) |
| Undocumented immigrants allowed to stay? | 0.073 (0.016) | 0.098 (0.016) | 0.441 (0.362) |
| English as official language? | 0.03 (0.27) | 0.043 (0.152) | 0.619 (0.364) |
| n | 109 | 100 | 109 |
In the first “All respondents” column, ATE represents responses in T2-T1 for the treatment group compared with the control group for the entire experimental sample. Positive values mean a more politically conservative response. In the “Waits on platform” column, CATEs are the Conditional Average Treatment Effects for persons who said they stand on the platform, rather than wait in their cars. In the second “All respondents” column, T1 levels and SDs for each variable for all respondents. All variables scaled 0–1.
P values from a one-tailed test against the Null Hypothesis of no effect are in parentheses.
Each of the questions allowed responses on a five-point scale ranging from strongly agree to strongly disagree (exact answers were changed to be appropriate to the actual question).


